Abstract—In order to understand current state of the thermal sensation and environment control strategy in different climate zones of China, a questionnaire survey was conducted on the internet during extreme weather in summer. The questions in the survey were designed based on ISO 7730 and previous literatures on adaptive thermal comfort. A total of 927 valid questionnaires were acquired, which involved respondents from 29 provincial-level administrative regions of China in different climate zones. The result, which is based on the compilation of responses from the survey, indicates that the occupants living in the hot summer and cold winter zone are more dependant on the air conditioner, and occupants living in south of the hot summer and cold winter zone are more adaptable to extreme weather in summer. The most common adaptive behavior is reducing clothes for all the investigated zones. Compared with male respondents, more female respondents would like to use hand fans to improve their thermal comfort. This paper provides speaking proof that different thermal comfort standard is needed for different climate zones in China.
Index Terms—Environment control strategy, indoor thermal environment, questionnaire, thermal sensation.
NOMENCLATURE
TSV: Thermal Sensation Vote HSV: Humidity Sensation Vote DSV: Draught Sensation Vote
H.S.C.W: Hot summer and cold winter
I. INTRODUCTION
There has been a great deal research on thermal comfort under steady state worldwide [1]-[4], which most air-conditioning temperature design based on. However, conclusion of thermal comfort under steady state are easy to cause the deviation if there’s no heat balance between environment and body. Therefore scholars began to conduct thermal comfort study under dynamic state. Humphreys established a relationship between neutral temperature and outdoor environment [5], [6]. Richard de Dear proposed adaptability theory, In adaptability theory, people adapt thermal environment by physiological adaptation, behavioural adaptation and psychological adaptation [7]. Yao combined adaptability theory with heat balance theory and proposed adaptive PMV model [8], which introduced thermal experience into thermal comfort study. To date, many studies
Manuscript received December 12, 2016; revised February 4, 2017. The authors are with the Faculty of Urban Construction and Environmental Engineering, Chongqing University, Chongqing, China (e-mail: tiger518zch@163.com, tandy017@outlook.com, yuweixscq@126.com).
under dynamic state focused on natural ventilation buildings and reducing building energy consumption, but these studies didn’t consider usage of air-conditioning buildings in natural ventilation buildings [9]-[11]. There’s still have no conclusion on how to balance thermal comfort and building energy consumption.
There is a big advantage to conduct field study of thermal comfort in China because climate in China is divided into five zones: severe cold zone, cold zone, hot summer and cold winter zone, hot summer and warm winter zone, temperate zone. So far, many field studies of thermal comfort have been conducted in China. Mao calculated indoor neutral temperature of natural ventilation buildings in different climate zone in China [12]. Luo proposed that indoor neutral temperature with individual control strategy are closer to outdoor temperature than without individual control strategy in winter [13]. However, few studies related thermal sensation with adaptation behaviour to understand current thermal environment condition.
In order to compare current indoor thermal sensation and environment control strategy of occupants in different climate zones of China, the survey was sent on the internet during August 23th to 25th. The temperature of representative city during 3 days are in Table I.
II. QUESTIONNAIRE DESIGN
The survey aimed to record occupants’ perceived thermal comfort and environment control strategy in minute detail, and the questionnaire content mainly involves basic information of respondents, indoor thermal sensation and environment control strategy, as shown in Table II. The basic information part involves gender, age, current residence, which can ensure random distribution of location of respondents and eliminate invalid data. The indoor thermal conditions were assessed by voting the thermal sensation, humidity sensation and draught sensation using the evaluation scale listed in Table III. The environment control strategy includes personal behaviour and usage of refrigerating devices. Personal adaptive behaviours includes 4 mainly behaviours: reducing clothes, cold drink, shower, hand fan. An ‘other’ option which can be filled in by other adaptive behaviour. Usage of refrigerating devices involves usage of air-conditioner and electric fan. Temperature setting is correlate with the item ‘whether turn on the air-conditioner’. Invalid data can also be eliminated if setting temperature is over 30℃(Upper limit of temperature with refrigerating mode).
Before filling out the questionnaire, the respondents were informed of objectives of the survey and the meaning of terminology in detail.
Thermal Comfort Study Based on Questionnaire Survey
among Occupants in Different Climate Zones in China
TABLEI:THE TEMPERATURE OF REPRESENTATIVE CITY IN AUGUST 23TH TO 25TH
Climate zone City
August 23th August 24th August 25th
Highest Temperature
(℃)
Highest Temperature
(℃)
Highest Temperature
(℃)
Lowest Temperature
(℃)
Highest Temperature
(℃)
Lowest Temperature
(℃)
Hot summer and cold winter zone Chongqing 39 39 40 30 36 26
Wuhan 35 35 35 28 34 25
Nanjing 34 34 34 25 34 25
Shanghai 34 34 34 27 35 27
Cold zone Beijing 30 30 32 24 31 18
Xi’an 35 35 35 25 27 20
Jinan 32 32 33 21 27 18
Hot summer and warm winter zone Guangzhou 36 36 36 27 36 26
Xiamen 34 26 34 26 34 27
Temperate zone Guiyang 30 30 31 22 31 21
Kunming 28 28 28 17 28 17
(From China Meteorological Data Network)
TABLEII: DETAILS OF SURVEY QUESTIONNAIRES
Basic Information Indoor Thermal Sensations
Environment Control Strategy
Gender, Current residence.
TSV, HSV, DSV
Personal adaptive behaviours, Dressing level,
Usage of refrigerating devices.
TABLEIII:INDEX SCALE OF SELF-EVALUATION
Scale TSV HSV DSV
3 2 1 0 -1 -2 -3
Hot Slightly warm warm Neutral Cool Slightly cool Cold
Very humid Humid Slightly humid Neutral Slightly dry Dry Very dry
Stagnant Gently breeze Breeze Neutral Slightly draught Draught Strong Draught
III. RESULTS
A. Respondents
In total, 927 valid questionnaires were collected, 29 provincial-level administrative regions of China in different climate zones were included. Respondents’ age ranges from 15 to 70 years old. The distribution of respondents’ location were scattered. Table IV showed the age distribution of respondents.
TABLEIV:AGE DISTRIBUTION OF RESPONDENTS
Age Range Number(n) Age Range Number(n)
15-19 29 40-49 91
20-29 506 50-59 79
30-39 212 60-70 10
According to current residence, the study re-divided into 3 climate zones: North of hot summer and cold winter zone (severe cold zone, cold zone), hot summer and cold winter zone, south of hot summer and cold winter zone (hot summer and warm winter zone, temperate zone). The reason for the re-division is as follows:
1) The survey mainly focused on indoor thermal condition of hot summer and cold winter zone.
2) The questionnaire spread by Moments, an app’ where people can sharing and spread information among acquaintances. The labour migration of China has
significant space conglomeration effect while the writer who launched the investigation is located in Chongqing, one of the hot summer and cold winter zones. Therefore, it is reasonable that nearly 70% of the respondents were located in hot summer and cold winter zone.
3) According to former studies [12], there’re differences among these three climate zones, but cities in different zones have high similarities on climate.
Table V summarizes gender and regional distribution of respondents.
TABLEV:GENDER AND REGIONAL DISTRIBUTION OF RESPONDENTS
Sex Number(n) H.S.C.W
zone
North of H.S.C.W zone
South of H.S.C.W zone
Male 477 333 65 79
Female 450 342 63 45
Total 927 675 128 124
Table VI shows the consistency reliability of questionnaires, Cronbach’s α is calculated. K is the number of items, 𝑆𝑖2 is the variance of the ith item and S𝑥2 is the
variance of the total score formed by summing all the items. If the variables are positively correlated, the variance of the sum will be increased. As is shown in table, the Cronbach’s α
is 0.68503 > 0.6, which mean the questionnaire had better reliability.
TABLEVI:CONSISTENCY RELIABILITY OF QUESTIONNAIRE
Parameters K ∑ 𝑆𝑖2 S𝑥2 α
Total 927 675 128 124
B. Subjective Assessment
Fig. 1 shows the distribution of questions (TSV, HSV, DSV) assessing the indoor thermal environment in three zones.
1) Thermal sensation
scale (TSV=-1, 0, 1). And the number of respondents who voted out of the acceptable scale in north of H.S.C.W zone is slightly less than that in the other two zones.
a)
b)
c)
Fig. 1. Statistic summary of survey questions: a) Thermal sensation vote b) Humidity sensation vote c) Draught sensation vote
2) Humidity sensation
From this Fig. 1 b), it’s clear that, while over 60% male occupants voted for neutral, only 47% female occupants in three zone voted for the same in H.S.C.W zone and north of H.S.C.W zone. In south of H.S.C.W zone, proportion of female occupants who voted for neutral are close to proportion of male occupants, but female occupants who voted for neutral are still fewer than male occupants. Also, over 25% female occupants voted for slightly dry, moderate dry and very dry, only 15% male occupants voted for the same in all 3 zones, which means female occupants feel more dry than male occupants.
From the figure, occupants in north of H.S.C.W zone who voted for wet is more than other two zones. That is because during August 23th to 25th, the weather of most cities in north of H.S.C.W zone are cloudy to medium rainy, while the weather of most cities in other two zones are sunny.
3) Draught sensation
The distribution of subjective response on Air flow of male and female occupants in three zones is different. As is shown
in Fig. 1 c), it is evident that around 77% male occupants voted for acceptable, slightly draughty, moderately draughty and very draughty, while only 25% female occupants voted for the same in three zones. Meanwhile, nearly 75% female occupants voted for slightly still, moderately still and very still. It can be seen that female is more sensitive, and feel more dissatisfied than male on air flow in the same thermal comfort, which is in accordance with the research of S. Karjalainen [15]. In particular, around 70% female occupants in north of H.S.C.W zone voted for moderately still and very still, which means female occupants in north of H.S.C.W zone feel more sensitive on air flow in summer than other two zones.
C. Environmental Control Strategy 1) Personal adaptive behaviors
Questions about adaptation behaviours in the questionnaire mainly focus on behaviours of occupants’ daily habits. Fig. 2 shows the proportion of adaptation behaviours that occupants in three climate zones choose to improve thermal sensation and adapt thermal environment in summer. As is shown in the figure, only 2.77% occupants voted for other behaviours to improve thermal sensation, which means occupants improve their thermal sensation mainly by reducing clothes, having cold drink, showers and using hand fans.
Nearly 60% male occupants voted for reducing clothing to improve thermal sensation, the proportion of other three behaviours for males ranged from 40% to 50%. 55.7% female occupants voted for using hand fans to improve thermal sensation, 50.5% female occupants voted for reducing clothing to improve thermal sensation, the proportion of showers and having cold drinks for females was 40.2% and 44.8%. By the way, 62.87% female occupants of south of H.S.C.W zone voted for reducing clothing. It can be seen that occupants of three zones adapt thermal environment mainly by reducing clothing in summer, and female of three zones also adapt thermal environment by using hand fan. Combing with Fig. 1, it is evident that local skin surface will contact against strengthened air flow by using hand fans. Meanwhile, using hand fans can provide fluctuating flow on local skin surface, which can produce more cold sensation and draft sensation [16].
Fig. 2. Proportion of adaptation behaviours in summer.
2) Clothing insulation
Clothing insulation was calculated based on ISO 9920 [17]. Respondents checked the boxes of the type of garments according to their own situation. And the clothing insulation
0% 50% 100%
MALEFEMALE MALEFEMALE MALEFEMALE HSCW zone North of HSCW zone South of
HSCW zone
Perc
ept
ion
of
R
es
pondents
-3 -2 -1 0 1 2 3
0% 20% 40% 60% 80% 100%
MALEFEMALE MALEFEMALE MALEFEMALE
HSCW zone North of HSCW zone South of HSCW zone
Perc
ept
ion
of
R
es
pondents
-3 -2 -1 0 1 2 3
0% 20% 40% 60% 80% 100%
MALEFEMALE MALEFEMALE MALEFEMALE HSCW zone North of HSCW zone South of
HSCW zone
Perc
ept
ion
of
R
es
pondents
-3 -2 -1 0 1 2 3
0.00% 20.00% 40.00% 60.00% 80.00%
MALE FEMALE MALE FEMALE MALE FEMALE
HSCW zone North of HSCW zone
South of HSCW zone
Perc
ept
ion
of
R
es
pondents
of a respondent is calculated by adding together the thermal insulation of each garments he (or she) checked. For example, a male respondent checked the boxes of T-shirt, long trousers and slippers, then it is 0.09+0.20+0.05=0.34. Fig. 3 shows the interquartile range of clothing insulation of respondents in three zones. Although the median value has no significant difference among the respondents in three zones, it could be seen that the distance from the first to second quartile of north of H.S.C.W zone is a little larger than that of the other two zones, no matter it is of male or female.
Fig. 3. Clothing insulation
3) Usage of refrigerating devices
Fig. 4 shows the proportion of air-conditioner running in the room where the respondents were staying. The result shows the proportion of air-conditioner running is a little higher in H.S.C.W zone than that in the other two zones, while occupants in south of H.S.C.W zone have the lowest demand for air-conditioning in three zones. The result also shows that female respondents in H.S.C.W zone prefer to turn on the devices than male , while female’s demand for devices running in other two zones is lower than male’s demand.
Fig. 4. Proportion of air-conditioner running.
The setting temperature of air-conditioning in China is based on Chinese standard called Design Code for heating ventilation and air conditioning of civil buildings (GB50736-2012) [18]. The standard stipulate air-conditioning temperature in refrigeration condition should be“24℃ ~26℃ for thermal comfort level I” and “26℃~28℃ for thermal comfort level II” for comfort demand . Therefore, statistics of setting temperature were divided into 4 intervals. As shown in Fig. 5, over 90% respondents set temperature in thermal comfort zones, in which over 60% respondents used to set temperature between
26℃~28℃ , which is level II thermal comfort zone.
Fig. 5. Proportion of setting temperature with device working.
To reflect the behavior adaptive deference among the three zones more directly, the proportion of air conditioner running among respondents who voted for warm and hot(TSV=2,3) was summarized as shown in Fig. 6. It can be seen that the proportion of air conditioner running among respondents voting for warm and hot in north of H.S.C.W zone is less than that in the other two zones, which leads to a presumption that the occupants living in the north of H.S.C.W zone are less dependent on the air conditioner.
Fig. 6. Propotion of air conditioner running among respondents voting for warm and hot.
Occupants use refrigerating devices to control and improve indoor thermal environment. Fig. 7 shows the proportion of refrigerating devices using habits of three climate zones in summer. From this figure, while 22.8% occupants in three zones only use air-conditioning to improve thermal environment, 64.1% occupants use air-conditioning and fan alternately. Occupants used to use air-conditioning when the thermal environment is hard to accept, otherwise, they use electric fan at first. That means Chinese have better ideology of energy efficiency.
Fig. 7. Refrigerating devices using habits in summer.
While over 26% occupants in other two zones voted for only using fan and natural ventilation to improve thermal environment, only 8% occupants in H.S.C.W zone voted for 0.00%
20.00% 40.00% 60.00% 80.00% 100.00%
HSCW zone North of HSCW zone
South of HSCW zone
Pe
rcep
tion
o
f
Respo
n
d
en
ts
MALE FEMALE
0% 20% 40% 60% 80% 100%
MALE FEMALE MALE FEMALE MALE FEMALE HSCW zone North of HSCW zone South of HSCW
zone
P
ercep
tio
n
of
Resp
on
de
nts
18℃~23℃ 24℃~25℃ 26℃~28℃ 29℃~30℃
55.36% 65.71% 50.00%
75.00% 46.15%
33.33%
0.00% 20.00% 40.00% 60.00% 80.00% MALE
FEMALE MALE FEMALE MALE FEMALE
HS
C
W
zone
N
or
th
of
HS
C
W
zone
So
u
th
of
HS
C
W
zone
0.00% 20.00% 40.00% 60.00% 80.00%
MALE FEMALE MALE FEMALE MALE FEMALE
HSCW zone North of HSCW zone
South of HSCW zone
Perc
ept
ion
of
R
es
pondents
only air-conditioning air-conditioning and fan
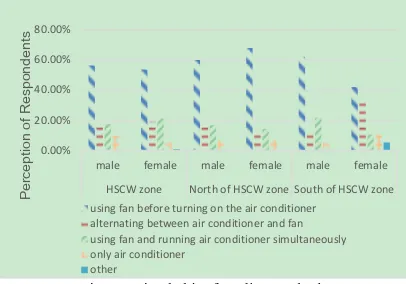
the same, which means H.S.C.W zone has the worst indoor thermal environment of China in summer. It is also clear that female occupants in north and south of H.S.C.W zone prefer non-air conditioning devices in summer. Fig. 8 shows the using habit of cooling method in the three different zones. More than half the respondents would use fan before turning on the air conditioner in the three zones except the female in south of H.S.C.W zone.
Fig. 8. Using habit of cooling method.
IV. CONCLUSIONS
In this study, a detailed questionnaire survey on the subjective responses of thermal sensation along with adaptive behaviours was conducted in three climate zones of China. The analysis of the survey results is as follow:
1) In general, the usage frequency of air conditioner in H.S.C.W zone is slightly higher than that in the other two zones. However, it is found that the dependence on air conditioner in H.S.C.W zone and south of H.S.C.W zone is more heavily than that in the north of H.S.C.W zone if going deeper into the investigation of the relationship between thermal sensation and air conditioner running.
2) Reducing clothing insulation is the most common adaptation behaviour to improve thermal comfort. As for the gender difference, female is more sensitive to air flow, therefore, compared with male respondents, more male respondents would like to use hand fans to improve their thermal comfort
This survey was mainly to understand current indoor thermal environment in hot summer and cold winter zones, and current status in other climate zones is understood as reference. The questionnaire survey in winter and field study of indoor thermal environment in hot summer and cold winter zones will be conducted in following step. Meanwhile, combining with study of energy consumption, the whole study aims to control energy consumption under the premise of thermal comfort.
ACKNOWLEDGMENT
This study was supported by National Program on Key
Research Project (2016YFC0700300), the Faculty of Urban Construction and Environmental Engineering, Chongqing University, China.
REFERENCES
[1] P. O. Fanger, Thermal Comfort: Analysis and Applications in Environmental Engineering, Copenhagen: Danish Technology Press, 1970.
[2] Ashrae Handbook, American Society of Heating, Refrigerating and Air Conditioning Engineers, Inc. Atlanta, 2008.
[3] A. P. Gagge, A. Fobelets, and L. Berglund "A standard predictive index of human response to the thermal environment," ASHRAE Trans, vol. 92, pp. 709-731, 1986.
[4] M.-L. Tan, "Effects of air humidity and velocity on human thermal sensation in summer," Ph.D. dissertation, Dept. Elect. Chi. Chongqing Univ, Chongqing, China, 2011.
[5] M. A. Humphreys, "Outdoor temperatures and comfort indoors,"
Building Research and Practice, vol. 6, pp. 92-92, 1978
[6] J. F. Nicol and M. A. Humphreys, "Adaptive thermal comfort and sustainable thermal standards for buildings," Energy and Buildings, vol. 34, pp. 563-572, 2002.
[7] R. Dear and G. S. Brager, "Developing an adaptive model of thermal comfort and preference," ASHRAE Transactions, vol. 104, pp. 73-81, 1998.
[8] R. Yao, B. Li, and J. Liu, "A theoretical adaptive model of thermal comfort—adaptive predicted mean vote (aPMV)," Building and Environment, vol. 44, pp. 2089-2096, 2009
[9] A. Auliciems, "Towards a psycho-physiological model of thermal perception," International Journal of Biometeorology, vol. 25, pp. 109-122, 1981.
[10] J. F. Nicol, I. A. Raja, and A. Allaudin, "Climatic variations in comfortable temperatures: the Pakistan projects," Energy and Buildings, vol. 30, pp. 261-279, 1999.
[11] S. Heidari and S. Sharples, "A comparative analysis of short-term and long-term thermal comfort surveys in Iran," Energy and Buildings, vol. 34, pp. 607-614, 2002.
[12] Y. Mao. "A study on the climatic adaptability of human thermal comfort," Ph.D. dissertation, Dept. Elect. Chi. Xi`an University of Architecture and Technology, Xi'an, China, 2007.
[13] M.-H. Luo, B. Cao, X. Zhou, M. Li et al., "Can personal control influence human thermal comfort? A field studyin residential buildings in China in winter," Energy and Buildings, vol. 72, pp. 411-418, 2014. [14] L. G. Berglund, "Thermal acceptability," ASHRAE Transactions, vol.
85, pp. 825–834, 1979.
[15] S. Karjalainen, "Thermal comfort and gender: A literature review,"
Indoor air, vol. 22, pp. 96-109, 2012.
[16] S. Tanabe and K. Kimura, "Importance of air movement for thermal comfort under hot and humid conditions," in Proc. 2nd ASHRAE FEC on Air Conditioning in Hot Climates, 1989.
[17] Ergonomics of the thermal environment - Analytical determination and interpretation of thermal comfort using calculation of the PMV and PPD indices and local thermal comfort criteria, ISO 7730-2005. [18] Design Code for Heating Ventilation and Air Conditioning of Civil
Buildings, GB50736-2012.
Xuyuan Zhao was born in 1993, who is a second year master student of Chongqing University. Xuyuan Zhao’s major FIELDS of study are indoor thermal environment and building consumption efficiency.
Wei Yu was born in 1983, who is an associate professor, Ph.D tutor of Chongqing University, Youth Committee Member of China Green Building and Energy Conservation Committee. Wei Yu’s major fields of study are indoor environment and health.
Diyi Tan was born in 1993, who is a second year master student of Chongqing University. Diyi Tan’s major fields of study are human thermal comfort and indoor thermal environment.
0.00% 20.00% 40.00% 60.00% 80.00%
male female male female male female
HSCW zone North of HSCW zone South of HSCW zone
Perc
ept
ion
of
R
es
pondents
using fan before turning on the air conditioner alternating between air conditioner and fan using fan and running air conditioner simultaneously only air conditioner