OPTIMIZATION
OF
SPINNING
PROCESS
USING COMPUTATIONAL INTELLIGENCE
Prof. Chandrakant Jadhav1 and Atul Kamble2
1 Department of Computer Science & Engineering, Bharatratna Indira Gandhi College of Engineering, Solapur, Maharashtra (INDIA) 2
Department of Computer Science & Engineering, Bharatratna Indira Gandhi College of Engineering, Solapur, Maharashtra (INDIA)
I.INTRODUCTION
Spinning process in Textile Industry involves raw material selection process, optimization and quality evaluation. Engineering of spun yarns having specific yarn properties is the challenging task of spinning technology. The spinnability of a fiber depends on its quality and the setting of the spinning machine. It would be very beneficial to be able to predict the spinnability and resulting properties of a yarn in advance. The quality of any yarn spun from cotton depends on fiber quality chiefly, Span Length (SL), Uniformity Ratio (UR), Short Fibre Index (SFI), Micronaire (MIC), Strength (STR) and Trash (TR). Therefore selection of cotton is very important for a better end product design. Presently, the assessment for yarn quality is done according to previous experience of the spinner. They process a small quantity of cotton sample for ascertaining the quality of yarn so produced. However, this is time consuming, machine & labor intensive process. If the quality of resulting yarn is not satisfactory the process is required to repeat by selecting different cotton Properties.
It is more important to find out the resultant properties of end product in advance. Many researchers had developed fiber to yarn process, forward engineering process [3, 4, 5, 6]. But these modules predict only
Abstract- The BP feed-forward neural network is popular in solving many non-linear problems. The most important problem in this is to decide optimal structure of a feed-forward neural network. Literature presents a multitude of methods but there is no rigorous and accurate analytical method. Different ANN topologies can be trained for prediction, but results obtained are not necessarily be optimal. In Hybrid ANN-GA methodology, many neural network topologies are trained and results obtained for these topologies are optimized using GA.
This paper presents hybrid approach of neural networks and genetic algorithms for application of Textile Spinning in computing optimal values of fibre properties for required yarn. It is feasible to predict yarn properties in advance for provided fibre for spinning. This help in selection of fibre to produce yarn required by customer. ANN is developed to predict multi-property fibre for required yarn. Total 25 different structures of ANN are trained for same data and mean absolute error is calculated. After testing, predicted fibre properties of each topology, i.e. 25 results are provided to GA. GA searches optimal fibre properties from outcome of different ANN topologies. The result shows that the accuracy of proposed integrated approach is higher than individual topologies of ANN.
Keywords- Artificial Neural Network, Genetic Algorithm, Optimization
limited number of yarn properties [9, 14]. It is more desirable to find out fiber properties in advance according to customer design yarn properties i.e. yarn to fiber reverse engineering process [15] .This is one of the challenging task of spinning technologies.
The hybrid ANN-GA technique is a powerful method for process modeling and optimization of very complex processes. The objective of the process optimization is to maximize the process performances. The integrated ANN-GA strategy meets the objective based on two steps:
(a) ANN models with 25 different structures are trained to predict fibre properties. (b) GA is used to optimize results of ANN (fibre properties).
II.BACKGROUND
Various researchers have investigated yarn properties from fiber specification and process parameters. Spinners estimate the yarn quality, they are likely to produce from a given raw material in advance. They can select the raw material & accordingly adjust the process parameters in various departments so that most optimum quality at competitive cost of yarn is obtained.
Previous statistical approach and empirical approach [1, 2] establishing relationship between fibre & yarn quality characteristics are having some disadvantages. Statistical approach is based on the multiple regression method in which coefficients estimated are generally applicable only to specific population & operating conditions. Empirical approach assumes that fiber properties are independent & exert an exclusive influence on the yarn properties, which is not always true. Dr. J. V. Desai et. el [14] implemented yarn property prediction & showed that single neural structure is unable to predict all the yarn properties with desired accuracy. But with the help of powerful algorithms this conclusion can be discarded.
A Majumdar et el [15] have predicted the properties of final yarn using fibre properties as a inputs. However the use of all the cotton fibre properties for ANN model was almost impossible due to structural complexity of the model and therefore they used one comprehensive quality index as the regression equation. But regression equation will not accurately predict all fibre characteristics. S Sette et el [9] have presented a method to optimize a fibre to yarn production process. They simulate the production process by back propagation neural network and optimization of this network by Genetic Algorithm. To implement a multi-objective optimization, the fitness function is calculated using Parito optimality and is then modified by sharing function. But, however, authors have considered forward engineering concept which is unable to predict raw material needed according to yarn requirement of end user. Genetic Algorithm used doesn’t consider current available stock.
Lieva Van Langenhove et. el. [13] compared several techniques to model complex fibre to yarn production process. He concluded that the best technique depends on the type of data, the available number of data, the expectation of the user and the use of the model. He found that neural Network gives good results both for quality and for processability as a function of fibre parameters and machine setting. But this model presents an immediate solution without taking into account stock limits or the available of new qualities within the near future
III.ARTIFICIALNEURALNETWORK
The ANN technique is a powerful method for process modeling of very complex process. The feed forward neural network is a nonlinear function-mapping device that determines the K-dimensional nonlinear function vector f where f: X Y. Here, the input data vector X is mapped into a high-dimensional feature spaces via nonlinear mapping function f for predicting Y. In this architecture, X is a set of R-dimensional input vectors with Np numbers of data element X = {xp};
Where, p=1,2,…,Np and x=[x1, x2, …, xR]Tand
Y is a set of corresponding K-dimensional output vectors Y={yp};
Where,p=1,2,…,Np and Y=[y1, y2, …, yK]T).
The nonlinear mapping can be expressed as:
y = y ( x ; W ) + b (1)
Where,W = {WH, WO} and b = { bH,bO}.
The equation suggests that y is a function of x, which is parameterized by W and b. Precisely, the closed-form expression of the input-output relationship approximated by the two-layered ANN model is:
y= f 2 (WOf1( WH x + bH)+bO .. (2)
where f1 and f2 denote the nonlinear activation/transfer functions.
The back propagation training procedure aims at obtaining an optimal set (W) of the network weight matrices WH and WO, which minimize an error function. The commonly employed error function is Mean-Squared Error (MSE).
MSE=
2 1 1 , ,
1
p N i i K k k k i k i py
t
K
N
….(3)Where Np and K denote the number of patterns and output nodes used in the training, i denotes the Index of the input pattern (vector), and k denotes the index of the output node. Meanwhile, ti,k and yi,k express the desired (target) and predicted values of the kth output node at ith input pattern, respectively .
The outputs are computed as follows:
(a) The weighted sum of all the node-specific inputs is evaluated, which is then transformed using a nonlinear activation function f, such as tangent-sigmoid (tansig) and linear (purelin) transfer functions for hidden and output layers, respectively.
(c) Upon the MSE computation, the weight matrices WHand WO are updated using gradient descent method.
The procedure completes one network training iteration (1 epoch) when repeated with the remaining input patterns in the training set. Numbers of epochs are fixed to achieve performance goal by minimizing MSE.
IV.GENETICALGORITHM
A genetic algorithm is used in an attempt to find optimized fibre properties obtained from different structure of neural network. The GA uses and manipulates a population of potential solutions to find the optimal solutions. The process involves the GA evolving several vectors for fibre properties. Fitness function is used to determine the fitness level of each individual(fibre). Using these fibre properties from the neural network, the genetic algorithm would then evolve a new population to try. Over successive generations, the population evolves toward an optimal solution. Training BP-ANN and GA is divided into two parts: the first one is to predict fibre properties from different ANN topologies, and the second one is to optimize results of all ANN topologies with GA.
The detail stepwise procedure for the proposed approach is described below.
Step 1 (Train different structures of ANN)
Train different ANN topologies with same input/output data file of fibre and yarn, keeping different nodes in hidden layers.
Step 2 (Obtain results from different ANN topologies)
Obtain results from different ANN topologies(fibre properties) by providing yarn properties.
Step 3 (Initialization of solution population).
The genetic algorithm would create a population of initial fibre properties obtained in step2. Set the initial generation index (Gen). Set the number of independent variables (nvars). Generate a random initial population of Npop individuals. Each individual possesses vector entries with certain length or called as genes which are divided into many segments based on the number of decision variables (nvars). The genetic algorithm would create a population of fibres.
Step 4 (Fitness computation).
In this step the performance (fitness) of the solution vector in the current population is computed by using a fitness function given below,
Min f(x)= √ ∑ni=0(100 – Ai )2
Where,
f(x) = fitness value
Ai =ANN predicted individual property.
n = number of properties (variables).
We have minimized the equation because we want Optimal Fibre which resembles ANN results. Performance is checked and if it is not reached fibres for new generation are calculated.
Scale/rank the raw fitness scores to values in a range that is suitable for the selection function. In the GA, the selection function uses the scaled fitness values to choose the parents for the next generation. Because the algorithm minimizes the fitness function, lower raw scores have higher scaled values. Rank based scaling function is used.
Step 6 (Parents selection).
Choose the parents based on their scaled values by utilizing the selection function. Stochastic uniform selection function is used. The parents with the highest evaluations are favored in the selection.
Step 7 (Reproduction of children).
Each member of the population is evaluated, using the ANN as fitness function.
Crossover - Crossover enables the algorithm to extract the best genes from different individuals by
selecting genes from a pair of individuals in the current generation and recombines them into potentially superior children for the next generation with the probability equal to crossover fraction. Scattered crossover function is used.
Mutation - Mutation function makes small random changes in the individuals, which provide genetic
diversity with better fit.
Step 8 (Replaces the current population with the children).
After the reproduction is performed and the new children are obtained, the current population is replaced with the children to form the next generation.
Step 9 (Update/increment the generation index).
Increment the generation index by 1: Gen=Gen+1.
Step 10 (Repeat Steps 4-9 until convergence is achieved).
Repeat the steps 4-9 on the new generation until the convergences are met. The algorithm stops when the number of generations reaches the maximum value (Genmax).
Step 11 (Assign the top ranking of children to the optimal solution vector).
After the GA convergence criteria is achieved, the children possessing top ranking of fitness value is assigned as optimized value.
V.EXPERIMENTALSETUP
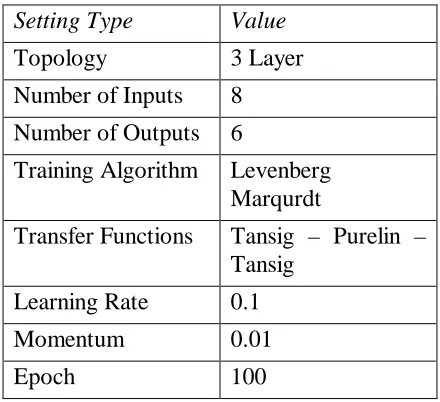
Table 1. Parameter Setting for ANN
Setting Type Value
Topology 3 Layer Number of Inputs 8
Number of Outputs 6
Training Algorithm Levenberg Marqurdt
Transfer Functions Tansig – Purelin – Tansig
Learning Rate 0.1 Momentum 0.01
Epoch 100
The objective of training is obtaining an effective generalization of the relationship between the input and output dataset. This involved modifying the performance function on the basis of MATLAB Package- Mean Absolute Error Function. Learning rate used was 0.01. Momentum rate was optimized at 0.9 and 50 epoch’s were used for training. The ANN will predict fibre properties. During testing phase different samples are taken and average mean absolute error is calculated. Predicted output of 25 different neural network structures is given to GA as initial population (For individual sample). Hence forth, the next aim is to predict optimized fibre properties from ANN results using Genetic Algorithm
Proposed GA model uses 25 different cotton fibre predicted output of particular samples (output of ANN) as Initial Population. Each individual has six different properties which are explained before. Hence, the initial population will be a matrix of 25x6 elements. Fitness function is the vital component of GA. Fitness function is,
Min f(x) = √∑ni=0(100 – Ai )
2
Where,
f(x) = fitness value
Ai =ANN predicted individual property.
n = number of properties (variables).
We have minimized the equation because we want Optimal Fibre which resembles ANN results.
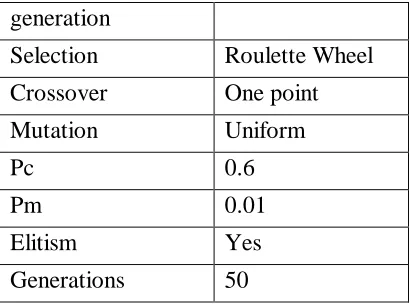
Table 2. Parameter Setting for GA
Setting Type Value
Encoding Scheme Binary Encoding Population size 25
generation
Selection Roulette Wheel Crossover One point Mutation Uniform
Pc 0.6
Pm 0.01
Elitism Yes
Generations 50
VI.RESULTS
Proposed Computational model is hybrid approach of ANN-GA. Hence forth, results has to be given stepwise.
Results for back-propogation network in predicting fibre properties from requied yarn is given in figure 2. Only one result for Neural network structure 7-12-22 is given. The figure shows that results are satisfactory for fibre property Short Length(SL). Similar results can be obtained for remaining properties. After testing, results found were satisfactory. Mean average error of best 5 structure are shown in table 2. The
co-relation co-efficients are in between 0.9999 to 1. The predicted values by structure 7-12-22 and average error of individual properties are given in table1. Mean Absolute Error is 0.065.
Table 3. Mean average error and standard deviation.
Fibre Prop. SL UR GTEX MIC SFI CG
Predicted Values 26.6 45.8 20.7 3.4 11 21.4
Average Error 0.07 0.05 0.06 0.05 0.07 0.06
Table 4. Mean Absolute Error for 5 results
Structure 7-11-22 6-10-22 7-11-27 10-16-18 10-16-25 06-09-17
Figure 2. ANN Results for fibre property SL
The ANN provides six different fibre properties for given customer defined yarn. This fibre properties are no doubt are most suitable and accurate. But ANN predicts values without considering available stock in mill. The values predicted is not necessarily be available in stock, or can be blended.
GA undoes the problem by searching the results of ANN in available stock. Since, ANN provides population to GA, the searching of required yarn or optimal yarn resembling results given by ANN can be done. The results given by GA given in figure 3 below. The graph shown in figure 3 shows the best individual generated by GA after 500 generations.
0 20 40 60
SL GTEX SFI
Property Value 27 46 21 3.4 10 21
SL UR GTE MIC SFI CG
Figure 3. Results of GA providing best individual.
Results given by computational model compared to system practiced in industry is much accurate.
VI.CONCLUSION
Hybrid approach of ANN-GA technique ensembles a powerful model that could significantly improve the predictability related to spinning department of Textile Industry.
In this paper, a Computational Model is proposed which combines advantages of Artificial Neural Network and Genetic Algorithms by providing ANN results to GA. ANN-GA provides more accurate fibre properties.
ACKNOWLEDGMENTS
Our thanks to Bharatratna Indira Gandhi College of Engineering, Solapur (M.S., INDIA) for providing platform.
REFERENCES
[1] EI Mogahzy Y E, Roy Broughton Jr & W K Lynch; “A statistical approach for Determining the Technological Value of Cotton Using HVI Fibre Properties , Textile Research Journal, Oct 1990, PP 497-500.
[2] J L Chanselme, E Heqet & R Frydrych, Relationship between AFIS Fibre Characteristics and Yarn Evenness & Imperfections, Preceedings of 1997 Beltwide Cotton Conference, PP 512-515.
[3] Ramesh M C, Rajamanickam R and Jayaraman S: The Prediction of Yarn Tesile Properties by Using Networks, J Text Intst 459-469, 1995
[4] Pynckels, F., Sette, S., Van Langenhove, L., Kiekens, P and Impe, K., Use of Neural Nets for determining the Spinnability of Fibres, J. Textile Inst. 86(3) 425-437, 1995.
[5] Sette. S., and Boullart, L., Fault Detection and Quality Assessment in Textiles by Means of Neural Nets, in “Proc. Textile Process Control 2001,” UMIST, Manchester, April 18-20, 1995.
[6] Cheng, L. and Adams, D.L., 1995. Yarn strength prediction using neural networks, Text. Res. J., 65(9), 495-500.
[7] Ethridge Da and Zhu R : Prediction of Rotor Spun Cotton Yarn Quality: A Comparison of Neural Networks Algorithm, Proceeding of the Beltwide Cotton, 1314-1417, 1996.
[8] Pynckels F, Kiekens P, Sette S and Impe K: The use of Neural Nets to Simulate the Spinning Process, 4447, 1997.
[9] S. Sette, L. Boullart, L. Langenhove, and P.Kiekens: Optimizing the Fibre-to-Yarn Production Process with Combined Neural Network/ Genetic Algorithm Approach, 1997.
[10] Rajamanickam R, Hansen S M and Jayaraman S: Analysis of Modelling Methodologies for Predicting the jet Spun Yarns, Text Res J, 67, 39-44, 1997.
[11] Anirban G, Chattopadhyay R and Jayadeva: Predicting yarn Tenacity: A Comparison of Mechanistic Neural Network Models, J Text Instst 139-145, 2001.
[12] Guha, A., 2002. Application of Artificial Neural Networks for Predicting Yarn Properties and Process Parameters, PhD thesis, Indian Institute of Technology, New Delhi.
[13] Lieva Van Lagenhove, Stefan Sette: The Complex Relationship Between Fibres, Production Parameters and Spinning Results, 14th European Symposium, 2002
[14] J. V. Desai & C. D. Kane; TEI, Ichalkaranji & & B Bandyopadhayay IIT Bombay, Mumbai, India- Neural Networks: An Alternative Solution for Statistically Based Parameter Prediction, 2004