Further Findings on the Positive Effects of Minimum Grading
James Carifio
University of Massachusetts-Lowell
Theodore Carey
University of Massachusetts-Lowell
Abstract
The debates concerning minimum grading systems have grown increasing more intense in the past decade. However, there has been an absence of empirical data, theory and comparative policy analysis relative to the different sides in these debates. In this study, we first define and conceptualize minimum grading and its underlying theory and then summarize the views of it proponents, opponents and critics, which we analyze in detail. We then summarize the results of the seven year longitudinal study of macro minimum grading we did at a large urban high school to the test theory and the competing views, and we present new analyses of this data set as well to answer other outstanding questions. We found no evidence of grade inflation or social promotion in the urban High School studied using a macro minimum grading system over a seven year period and most of the benefits posited by minimum grading theory including considerable cost savings. The benefits of minimum grading as sound educational policy are then discussed in detail.
Key Words:
Minimum grading, grading, grade inflation, social promotion, intermittent student failures, dropout prevention, optimizing student motivation, cost savings, minimizing grading biases.1.0 Overview
School grading practices have long been the subject of heated discussions (see Brook hart, 2009), yet the debates concerning grading have grown even more intense in the past decade (e.g., see the November 2011 issue of Educational Leadership), and particularly so relative to both NCLB and Common Core Standards and reduced budgets, rising costs, and increased accountabilities of various kinds (see Hernandez, 2009; and Erikson, 2011). A common theme found in this growing body of literature concerns the discrepancy between recommended and actual grading practices and calls for reforms in three areas: (1) reducing the wide variation in teacher-to-teacher grading methods evident in most schools, (2) creating more flexibility in allowing students to make good on failed tests and missing assignments, and (3) eliminating the inherent inequities found in traditional 100-point grading schemes (and any other grading scheme containing and using a true zero point) by instituting some form of minimum grading(Cox, 2011).
The focus of this article is primary on point (3) above (minimum grading), which is one critical but typically overlooked and unexamined component of all grading and assessment systems in some form, either explicitly or implicitly. Minimum grading, it should be well and clearly noted, is a specific grading practice and/or policy that is focused on particular subgroups of students who are unfairly failed due to intermittent performance failures that current grading systems “average out” (in one way or another) to a failing grade or grades for the semester or year. All current grading system, therefore, are heavily gamed against such students (never mind the many constant and intermittent ‘subjective” factors that also affects both grades and grading practices and procedures).Therefore, minimum grading is not about all grading and grading practices and problems, which is a common and widespread misconception about minimum grading and the minimum grading movement, both of which are fairly narrowly focused (see Wormeli, 2006; and Kohn, 2011 for details).
Consequently, although the student still fails the assignment or assignments, the minimum grade or (grades) leaves the student in a better position to recover from the failure or failures or/and not be catastrophically over-punished for them and have a better chance (probability) of successfully obtaining a passing grade for the quarter or course, if the student’s other work is of high enough quality at the point when the “averaging” (i.e., indexing or summation) is done to achieve the desired “passing grade” state (see Carifio & Carey, 2009 for details).The probability that a student who receives a minimum grade or grades on assignments or for a quarter will fail the course or quarter is still high and a good deal higher than the probability that the student will pass, but it is not
catastrophically and unfairly high, and passing is still possible, if past and future performance is of high enough
quality, which is the whole point of minimum grades and a minimum grading system and policy.
The point about minimum grading that is typically missed by many for whom the concept is new is that it is only a relatively or comparatively small percentage of certain students with a certain profile who receive one or more minimum grades who will pass the course or quarter, whereas most other students who receive one or more minimum grades most probably will not. Further, students who consistently receive good grades will not benefit
from minimum grading; but why should they, as they have no need for a catastrophic “safety net,” although it is there if they ever happen to need it. Also, students who consistently receive roughly average grades will not
benefit from minimum grading either: but again, why should they; however, the protective and minimizing safety net is there for these students as well if they should need it.
These types of arguments are all normative as opposed to criterion referenced arguments and unlike the many claims about minimum grading made (usually from parents) are both illogical and not relevant to minimum grading and minimum grading being part of a grading system for the following simple fact. Good students and average students lose nothing and are not diminished in any way from an appropriately implemented macro-minimum grading system, as our seven year longitudinal study of a large urban high school in MA clearly showed, but even these students may positively gain from minimum grading when they need the safety net such a system provides (see Wormeli, 2006; Dunham, 2008; Freiss, 2008; and Carifio & Carey, 209 for details). The argument that good and average students are harmed and lessened by minimum grading is a completely specious and illogical argument, and, as good and average students are not harmed by minimum grading in any really material way, they do not need “to be made whole again” in any way when a teacher, school, or system uses minimum grading practices, which is another specious and illogical claim often main by opponents of minimum grading. Yet, the minimum grading safety net is there for good and average students as well if they ever needed it similar to fire and automobile insurance.
In this regard, the minimum grading safety net is there for all students, and teachers as well, and actually acts to
protect both students and teachers in several different ways that are highly beneficial (and particularly once one
realizes that there is and will always be more to grading than just measures of “objective” academic achievement) as will be addressed below. To summarize and emphasize once again, then, minimum grading is about minimizing the impacts of intermittent catastrophic performance failures that certain subgroups of students experience, and even have tendencies to experience (and the same can be said of teachers as well). Current learning theories, moreover, provide us with several good explanatory models of intermittent performance failures of various kinds (see Bandura, 2001; Carifio & Rhodes, 2002; Carifio, 2005; Carifio & Carey, 2009, and Carey & Carifio, 2011 for details) that are quite useful relative to looking at various questions and issues and making predictions about intermittent failures and the effects minimum grading should have on lessening their catastrophic effects. Our theoretical view of minimum grading, therefore, is not a blind empirical or mere statistical approach to various questions, problems and issues associated with both performance and grading (as most approaches are), but rather it is a theory-based and theory-guided view and approach which not only provides a framework for (coherent and consistent) analyses of issues, points and disagreements, but also various a priori predictions that can be confirmed or denied. This later point is what distinguishes our approach from others in one way or another and the never ending debates and policies they produce without empirical support or discord resolution.
2.0 Methodology
A large urban high school in Massachusetts (Mill City High School) implemented a macro-minimum grading
As previously stated, micro-minimum grading is the grading system each teacher uses in each course to arrive at a grade for the quarter in that course. Mill City High School’s policy was silent on the point of the micro-grading systems teachers used in their courses (as is this study), except to note that most current teachers reported using micro-minimum grading systems in their courses in the past few years, and micro-minimum grading had become the de facto micro grading model used in most courses in this high school. Working with school officials, we retrospectively constructed a seven year longitudinal “unit-record” database for the years 2004 to 2010 at the individual student and teacher level for all quarterly grades in all courses, which began three years after the macro-minimum grading system, had been implemented and stabilized. Various important profile data were in this database for students, teachers and courses, which meant that we could control and filter analyses and comparisons fairly precisely, which greatly reduced if not eliminated many analytical and statistical problems, and across years and cohorts. We could also conduct falsification analyses as well as various a priori predictions we had developed from our theoretical framework and the various “claim and counter-claims” view testing from the literature we did.
We also had Massachusetts MCAS (Gong, 1999) math and language arts scores (an external and independent achievement criterion required of all students in MA) across the years students were in attendance. The MCAS has been judged by NCES as one of the top 5 if not best state exam in the nation(NCES, 2007).We also had a wide variety of other information and statistics about the high school and the community. The high school had sizable Black, Hispanic, Asian, and Special Needs student groups in attendance. In all we had 343,425 quarterly grades (not unduplicated) given by 851 teachers (not unduplicated) in the seven year database making this study something more than a “small clinic case study.”
3.0 Findings from the First Study We Did
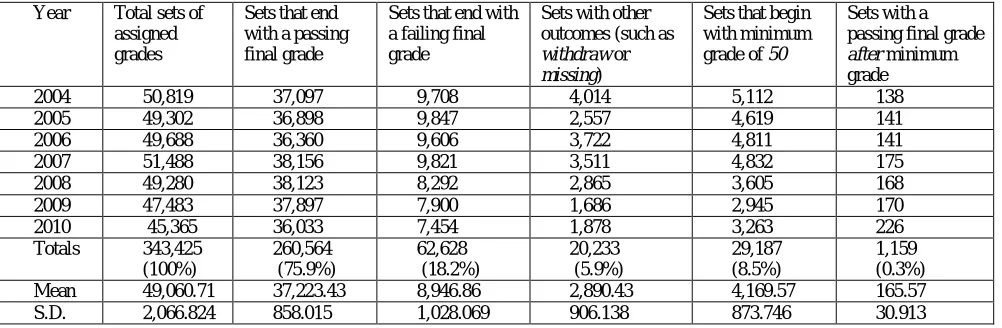
As we predicted, the grading data showed that 29,187 (or 8.5%) of the 343,425 sets of grades assigned from 2004-2010 began with the assigning of a minimum grade of 50 for the first quarter. However, only 1,159 of these 29,187 students that began with the assigning of a minimum grade of 50 ended with a passing course grade, a number that represents just 0.3% of all assigned grades (see Table 1 for details). It is more than extremely difficult to say from these data that the assignment of quarterly minimum grades in this urban high school were rampant, or pervasive with large groups of students getting “gifts they didn’t deserve” (as claimed by opponents) and even far more difficult to say the relative few interim quarterly minimum grades assigned resulted in a large number of undeserving students ending up with a passing grade in the course (see Carey and Carifio, Educational Researcher, September 2011 for details).
Table 1: Means, standard deviations and confidence intervals for key variables based on ends in the grading data of Mill City High School, 2004-2010.
Year Total sets of
assigned grades
Sets that end with a passing final grade
Sets that end with a failing final grade
Sets with other outcomes (such as
withdraw or
missing)
Sets that begin with minimum
grade of 50
Sets with a passing final grade
after minimum grade
2004 50,819 37,097 9,708 4,014 5,112 138
2005 49,302 36,898 9,847 2,557 4,619 141
2006 49,688 36,360 9,606 3,722 4,811 141
2007 51,488 38,156 9,821 3,511 4,832 175
2008 49,280 38,123 8,292 2,865 3,605 168
2009 47,483 37,897 7,900 1,686 2,945 170
2010 45,365 36,033 7,454 1,878 3,263 226
Totals 343,425
(100%) 260,564 (75.9%) 62,628 (18.2%) 20,233 (5.9%) 29,187 (8.5%) 1,159 (0.3%)
Mean 49,060.71 37,223.43 8,946.86 2,890.43 4,169.57 165.57
S.D. 2,066.824 858.015 1,028.069 906.138 873.746 30.913
Now multiply those numbers by roughly 800 high schools in Massachusetts alone to get the cost saving from the use of minimum grading systems for a program and policy that costs very close to zero dollars to implement never mind the even more valuable social benefits gained relative to these students and preserving their motivation to learn and keeping them in school and persisting rather than dropping out (see below for details). Over a seven year period, roughly 1,000 students were not forced to go to summer school and were retained and kept progressing in this one high school, which obviously increased graduation rates and had some other not so obvious benefits.
4.0 The Current Study
Two of the chief (and quite vocal) long standing arguments against minimum grading is that the “undeserved minimum grades” students receive will cause both grade inflation and social promotions with the implications being that the magnitudes of both will be large and detrimental to both school quality and true achievement levels. These arguments were made in the absence of any real and reasonable data (and in fact from just snippets of bad data), of course, as so many policy and practice arguments are made. These off-the-cuff arguments and claims typically implicitly assume that large numbers of minimum grades are given quarterly to large subgroups of students in particular that result in these large number of students passing their courses with elevated GPA’s and being socially promoted, which is not the case or anywhere near the case as our seven years of data showed. Nevertheless, we closely, tightly and cleaning examined and analyzed the grade inflation and social promotion data at the individual case level in our data set to put these claims to rest one way or the other (see Carey and Carifio, 2011 for the exact methodological details on this point).
We began by reviewing the theoretical and empirical literature on grade inflation and social promotions (see Lanning & Perkins, 1995; Zionek & Svec, 1997; Koretz & Berends, 2001; Kohn, 2002; Woodruff & Ziomek, 2004; Hu, 2006; and Godfrey, 2011 for details). It is a very confused and flawed literature in several different ways, both theoretically and empirically, with blind normative and statistical empiricism being rampant in the views and works available and much of the data and analyses being on aggregate rather than unit record data. Nevertheless, we used Hu’s (2006) views and models of explicit and implicit grade inflation and the same for social promotion, as they were the most coherent, theory-based, and data-supported in the literature.
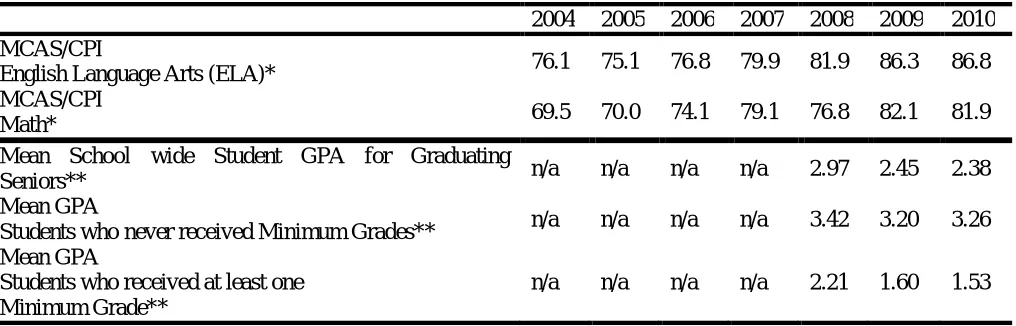
In terms of explicit grade inflation and social promotions year over year we found no evidence of either in our 7 year data set and in fact just the reverse. This point is easiest to see by looking at graduating cohorts (see Table 2) which could only be done for 3 years (2008 to 2010). As can be seen from Table 2, the overall GPA’s for graduating classes as well as those students who did and did not receive minimum grades over the prior 4 year period all declined significantly, while overall MCAS scores (the implicit measure of grade inflation) and graduation rates increased steadily and significantly from 2004 to 2010. No evidence for grade inflation or social promotions could be found in this data set and in fact the GPA’s of graduating students who had received minimum grades decline more than the students who did not receive any minimum grades, which more than just contradicts the arguments of those who oppose minimum grading systems and clearly show how conceptually flawed and confused these arguments are.
Table 2: Trends in school school-wide MCAS performance and assigned GPA’s of graduating seniors, Mill City High School, 2004-2010.
2004 2005 2006 2007 2008 2009 2010 MCAS/CPI
English Language Arts (ELA)* 76.1 75.1 76.8 79.9 81.9 86.3 86.8 MCAS/CPI
Math* 69.5 70.0 74.1 79.1 76.8 82.1 81.9
Mean School wide Student GPA for Graduating
Seniors** n/a n/a n/a n/a 2.97 2.45 2.38
Mean GPA
Students who never received Minimum Grades** n/a n/a n/a n/a 3.42 3.20 3.26 Mean GPA
Students who received at least one Minimum Grade**
n/a n/a n/a n/a 2.21 1.60 1.53
To check for implicit grade inflation, the student body was divided into two naturally occurring groups: those who had never been assigned a minimum grade and those who had. An Analysis of Covariance was performed to determine if a significant difference existed in the combined MCAS scaled scores of the two naturally occurring groups. The results indicated that, even after minimum grading has taken place, the grades assigned to struggling students were still under-reporting student academic achievement on the MCAS when compared to the better performing students who did not benefit from minimum grading. In fact, our results show that, after adjusting for grade point average, the students who had received minimum grades were outperforming their peers who had
never received a minimum grade on the Massachusetts state exams. This point will be explained in more detail
below.
5.0 Discussion
These results certainly contradict critics’ claims that struggling students are unfairly benefitting from minimum grading. Indeed, our results are consistent with recurrent claims found in the literature that common grading schemes can often lead to the assigning of punishingly low grades that are neither earned nor deserved and are in great part due to the use of a “100” point scale with a zero point that is treated and used as a mathematical zero in “averaging.” On this hundred point scale a “passing grade” is set in the upper third of the scale making the scale and the use of averages heavily gamed against the student who fails intermittently. This fact in turn produces an overabundance of “false negatives” (inappropriately and unfairly failed students) with all of the very serious negative consequences of failing such students have, never mind failing them in significant numbers, and the large financial and social-human costs of doing so. It is with little argument a self-defeating system and particularly so in an age where all lives matter and no students is supposed to be left behind and particularly by educational and grading practices that are heavily gamed against such students. One would be hard-pressed to characterize such a grading system as a culture of compassion, particularly given how basically subjective all grading systems are. Minimum grading is all about how to reasonably and fairly value failure, which is a factor few grading system or grading practices explicitly and consciously address.
It is very interesting to note that the traditional 100 point grading scale when first introduced over a century ago set a score of 50 as a grade of C (average), thereby making the impact of a failing grade (40 to zero) and intermittent failure less than one-half of what it is today with the way the traditional 100 point scale is used. So if there is anything that has been (implicitly) “inflated” in the last century, it is not “grades,” but rather the size of the negative effects of intermittent failures for students and the gaming of grading systems against students who intermittently fail, and particularly when the failure may not be due to just a lack of achievement but other factors that influence grading as well (see below).
Using external criteria, every analysis we did showed that working class males were achieving better than the grades that Mill City High School teachers were giving them and there are several explanations of these facts.
Yet, there was clearly an empirical grading bias in quarterly grades assigned by Mill City High School teachers
that greatly exceeded chance or other factors, which neither the Mill City High School teachers nor administrators seemed to be (consciously) aware of from the various and many discussion we had with them. However, the minimum grading policy and system that Mill City High School had in place minimized the effects and impacts of this grading bias and protected (and aided) teachers (and the school) as well as working class male students attending their school, and that is the whole point and function of minimum grading and grading system.
Minimum grading protects teachers from the potential influences of their own (and to a very great extent inescapable) biases and subjectivities in evaluating and grading student work by dampening down and minimizing these potential influences in situations where the student is doing substandard and failing work, so that the student is not over punished and the failure is far less catastrophic and the student has a chance of recovering from the failure and growing and developing as a student and person. Minimum grading is fairer to both the student and the teacher, and society as well, and it communicates this protective dimension of the assessment and grading process explicitly and in terms of how failure will be valued on an a priori and explicit basis. Standards, therefore, may be set high in a minimum grading system because protections have been built in and how failure will be valued has been explicitly addressed. On these factors alone, minimum grading is a wise professional practice for teachers to adopt and use.
Biases in grading will never be eliminated, as they are the ineluctable modality of reality of being human and
different from one another. But the biases may be minimized and even ones that one or an entire group of teachers and administrators are not aware of (and such biases of one kind or another will always be with us) and helping to minimizing both conscious and unconscious biases in grading is one of the greatest strengths and arguments for minimum grading systems. Minimum grading systems do not inflate grades, or produce social promotions, and save sizable amounts of money and the lives of a significant number of worthy students while they are in school and after and all for almost zero costs, which is why minimum grading is sound and wise policy.
We would like to acknowledge and praise the “Mill City” School Committee, administrators and teachers
for their vision and commitment in championing, implementing and developing a school-wide macro minimum grading system as part of their overall school improvement plan 10 years before the approach was widely advocated or implemented by other educators or educator policy makers. It has been both our distinct privilege and good fortune to work with all of these educational professionals the past several years developing this longitudinal and highly informative database and study of minimum grading that showed its many effects and lack of claimed effects, and completely autonomously and independently on our own, and what a wise and cost-saving educational and grading policy and approach minimum grading is.
References
Bandura, A. (2001). Self-efficacy beliefs as shapers of children's aspirations and career trajectories. Child Development, 72(1), 187-206.
Brookhart, S. M. (2009). Grading (2nded.). New York: Merrill.
Carifio, J. & Rhodes, L. (2002), Optimism, hope, self-efficacy, and locus of control. Work: A Journal of Prevention, Assessment, and Rehabilitation, 19, 125-136.
Carifio, J. (2005). An integrated information processing theory of learning. Proceedings of the Eighth International History, Philosophy & Science Teaching Conference, Leeds, England, 101-173.
Carifio, J., & Carey, T. (2009).A critical examination of current minimum grading policy recommendations. High School Journal, 93(1), 23-37.
Carey, T., & Carifio, J. (2010). Do minimum grading practices lower academic standards and produce social promotions? Educational Horizons, 88(4), 219-230.
Carey, T. & Carifio, J. (2012). The minimum grading controversy: Results of a quantitative study of seven years of grading data. Educational Researcher, 41(6), 201-208.
Cross, L. H., & Frary, R. B. (1999). Hodgepodge grading: Endorsed by students and teachers alike. Applied Measurement in Education, 12(1), 53-72
Dunham, L. (2008). Why zeros should not be permitted. Principal, 87(3), 62.
Erickson, J. A. (2011). How grading reform changed our school. Educational Leadership, 69(3), 66-70.
Friess, S. (2008 May 19). At some schools, failure goes from zero to 50. USA Today. Retrieved May 20, 2008, from http://usatoday.com
Godfrey, K. E. (2011). Investigating grade inflation and grade equivalence.(College Board Research Report 2011-2).
Gong, B. (1999).Relationships between student performance on the MCAS (Massachusetts Comprehensive Assessment System) and other tests—collaborating district A grades 4 and 10. Prepared for the Massachusetts Department of Education. The National Center for the Improvement of Educational Assessment, Inc. Dover, NH.
Hernandez, M. D. (2009, November 17). Teachers pledge lawsuit if grade policy unchanged in El Paso.El Paso Times. Retrieved January 23, 2010, from http://www.elpasotimes.com
Hu, S. (2006).Beyond grade inflation: Grading problems in higher education. ASHE Higher Education Report Series, 30(6). San Francisco: Jossey Bass.
Kohn, A. (1993). Punished by rewards: The trouble with gold stars, incentive plans, A's, praise and other bribes. Boston: Houghton Mifflin Co.
Kohn, A. (2002). The dangerous myth of grade inflation. The Chronicle of Higher Education, 49(11), B7. Kohn, A. (2011). The case against grades. Educational Leadership, 69(3), 28-33.
Koretz, D., &Berends, M. (2001).Changes in high school grading standards in mathematics. Santa Monica, CA: RAND.
Lanning, W., & Perkins, P. (1995).Grade Inflation: A consideration of additional causes. Journal of Instructional Psychology, 22(2), 163-168.
National Center for Education Statistics (2007).Mapping 2005 state proficiency standards onto the NAEP scales (NCES 2007-482).U.S. Department of Education. Washington, DC: Author.
Woodruff, D. J., &Ziomek, R. L. (2004).High school grade inflation, 1991-2003.(ACT Research Report 2004-4). Wormeli, R. (2006). Fair isn't always equal: Assessing and grading in the differentiated classroom. Portland,
ME: Stenhouse Publishers.