DETECTION OF HEART DISEASE USING DIFFERENT
MACHINE LEARNING TECHNIQUES
Jhumpa Mistri1, Pranati Rakshit2
1. INTRODUCTION
1.1. Problem Definition
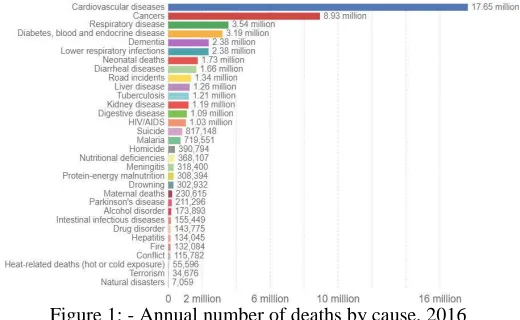
Cardiovascular disease or heart diseases have come out as the number one cause of death in both urban and rural areas. Initial results from the biggest study, yet to find out the main causes of death rate in India, have revealed that heart disease take most lives in both urban and rural areas.
In the age group of 25- 69 years 25 per cent of deaths occur because of heart diseases. In urban areas, 32.8 per cent deaths occur, while this percentage in rural areas is 22.9 because of heart disease. If all age groups are included, heart diseases cause for approximately 19 percent of all deaths. It is one of the biggest causes of death among males as well as females. It is also the leading cause of death in all areas and the numbers vary. The ratio of deaths caused by heart disease is maximum in south India (25 per cent) and lowest - 12 per cent - in the central areas.
The most important behavioural risk factors of heart related disease are unhealthy diet, physical inactivity, lack of exercise, being overweight, tobacco use and harmful use of alcohol. The effects of behavioural risk factors may raise blood pressure, raised blood glucose, raised blood lipids, obesity, and also arteries become narrowed and hardened due to plaque around the artery wall. These risks factors can indicate an increased risk of developing a heart attack, stroke, heart failure and other complications.
Figure 1: - Annual number of deaths by cause, 2016 1.2. Overview of the current work
This is very important to determine the accurate diagnosis early and appropriately. Detection of heart disease is very complicated. The detection of heart disease is often made, based on doctor’s experience & knowledge. This cause to unwanted results & excessive medical costs of treatments provided to patients. Therefore, an automatic medical detection system would be extremely beneficial for us. Our research work tries to represent the complete study about the different Machine Learning techniques which can be deployed in these automated systems.
Here we are using some classification model to predict whether the person have heart disease or not. Here we use three classifier such as Naive Bayes, Logistic Regression, Decision Stump. These classification algorithms are selected because
1 M.Tech student, Department of Computer Science & Engineering, JIS College of Engineering, Kalyani 2 Asst.Prof. Department of Computer Science & Engineering, JIS College of Engineering, Kalyani
DOI: http://dx.doi.org/10.21172/1.131.05
e-ISSN:2278-621X
Abstract - Heart disease is the world’s leading cause of death. Heart diseases have come out as the number one cause of death in both urban and rural areas. The early invention and timely treatment of heart disease can play a vital role. So, we need to discover an effective analysis tool which can easily & accurately detect the presence of heart disease. There are many risk factors for heart disease. In this paper we have used only 14 important attributes of heart disease. Here we use three classifier such as Naive Bayes, Logistic Regression, Decision Stump. Using different classifier we will determine whether there is any heart disease or not.
they are usually used for research purposes and have potential to yield accurate results. Using that classification model, we will predict the vital disease. At first, we compare performance of this classifier. Then we will find which classifier can predict the disease in better manner.
So, at first, we will apply the training data for which we are specifying the class value. The dataset which we used for our work has 76 attributes. But In this research paper, we have only used 14 most important attribute of heart disease. Total no of data is 200. In our work, we have used percentage split 80%: this is going to be 80% training data and 20% test data. Using 80% of training data we have designed the model. Then after learning that model will generalise its learning, on some test data. 20% test data we have applied on that model and we get 75% accuracy.
2. LITERATURE SURVEY
Deepali Chandna et al. [01] proposes a new technique for investigating feature selection techniques as well as developed new machine learning algorithms for providing automatic computer aided analysis and decision support system for heart disease detection. The main focus is to develop an integrated structure with a righteous workflow.
Vikas Chaurasia et al. [02] performed a work whose main objective is to report on a research project which took advantage of the available technological advancements to build up prediction models for heart disease survivability.
Sunita Soni et al. [03] discussed on the problem of constraining and summarizing different algorithms of data mining used in the field of medical prediction. The focus is on using various algorithms and combinations of different target features for intelligent and effective heart attack prediction using data mining.
Aditya Methaila et al. [04] exhibit the analysis of various data mining techniques which can be very helpful for medical analysts for exact heart disease detection. In this research paper various data mining Techniques are used, such as Decision Trees, Naïve Bayes and Neural Network, and weighted association Apriori algorithm and also MAFIA algorithm in Heart Disease Prediction.
Mayuri Takore et al. [05] performed a work which tries to determine the heart diseases through data mining, Support Vector Machine (SVM), Genetic Algorithm, rough set theory, association rules and Neural Networks.
A.Q. Ansari et al. [06] worked on a Neuro fuzzy integrated system for the diagnosis of heart diseases. The effectiveness of the proposed system and simulation for computerized analysis is performed by means of the realistic causes of coronary heart disease. This type of systemis is suitable for the identification of patients with high/low cardiac risk.
Mrs. G. Subbalakshmi et al. [07] performed a work whose main objective is to establish a Decision Support system for Heart Disease Prediction using Naïve Bayes algorithm. The proposed system finds out all the hidden useful information from the heart disease database. This model could answer difficult queries, each one with its own potency, access to complete information and accurateness.
Ramin Assari et al. [08] tried to help healthcare specialists to early determine heart disease and evaluate related risk factors. For determining heart disease data mining techniques were applied on a heart related dataset. Here the heart disease diagnosis indices were found out and a model was developed based on extracted rules.
Soodeh Nikan et al. [09] performed a work which proposes an algorithm depending on the machine learning techniques to detect the risk of coronary artery atherosclerosis. Here they have used a ridge expectation maximization imputation (REMI) technique is use to determine the missing values databases and a conditional likelihood maximization method for remove irrelevant attributes and reduce the size of feature space and also improve the speed of the learning.
Mai Shouman et al. [10] performed a work which finds out gaps in the research on heart disease diagnosis and treatment and proposes a model which systematically close those gaps to find out if applying data mining techniques to heart disease treatment data can come up as reliable performance as that achieved in detecting heart disease.
Sellappan Palaniappan et al. [11] developed a prototype of Intelligent Heart Disease Prediction System (IHDPS) using different data mining techniques, such as Decision Trees, Naive Bayes and Neural Network. This proposed work’s results show that both the techniques have a unique strength in realizing the objectives of the defined mining goals.
Syed Umar Amin et al. [12] proposed a technique for detection of heart disease using vital risk factors. Here two most effective data mining tools are involved, such as neural networks and genetic algorithms. This proposed system implementedglobal optimization advantage of genetic algorithm for initialization of neural network weights.
Yanwei Xing et al. [13] developed data mining algorithms for predicting survival of CHD patients depending on 1000 cases. Here three popular data mining algorithms are used to develop the prediction models and also used 10-fold cross-validation methods to determine the unbiased estimate of the three prediction models for performance comparison purposes.
3. DATA PRE-PROCESSING
3.1. Dataset
The dataset which we used for our work has 76 attributes. But in this research paper, we have only used 14 most important attribute of heart disease. The attributes are Age, Sex, P, Trstbps, Chol, Fbs, estecg, Thalach, Exang, OldPeak, Slope, Ca, Thal and Num. The publicly available heart disease database is used which can be used for detecting of various heart diseases.
sex: sex (1 = male; 0 = female) cp: chest pain type
trestbps: resting blood pressure (in mm Hg on admission to the hospital) chol: serum cholestoral in mg/dl
fbs: (fasting blood sugar > 120 mg/dl) (1 = true; 0 = false) restecg: resting electrocardiographic results Value 0: normal
Value 1: having ST-T wave abnormality (T wave inversions and/or ST elevation or depression of > 0.05 mV) Value 2: showing probable or definite left ventricular hypertrophy by Estes' criteria
thalach: maximum heart rate achieved
exang: exercise induced angina (1 = yes; 0 = no)
oldpeak = ST depression induced by exercise relative to rest
slope: the slope of the peak exercise ST segment Value 1: upsloping Value 2: flat Value 3: downsloping
ca: number of major vessels (0-3) colored by flourosopy thal: 3 = normal; 6 = fixed defect; 7 = reversable defect num: diagnosis of heart disease (angiographic disease status) Value 0: < 50% diameter narrowing
Value 1: > 50% diameter narrowing
3.2 Missing Data manipulation
The Dataset which we used had many missing values. So, at first, we fill all the missing values by 0. Then we calculate the mean or average of the column & put the value in place of 0. It means all the missing values are updated with the mean of the values of that column.
4. METHODOLOGY & IMPLEMENTATION
Here we are using some classification model to predict whether the person have heart disease or not. We use three classifier such as naive Bayes, Logistic Regression, Decision Stump. The dataset which we used for our work has 76 attributes. But In this research paper, we have only used 14 most important attribute of heart disease. Total no of data is 200.
4.1. Classifier
4.1.1. Naïve Bayes Classifier –
Naïve Bayes Classifier is a statistical classifier which assumes no dependency between attributes. This classifier algorithm uses conditional independence, means it assumes that an attribute value on a given class is independent of the values of other attributes. The advantage of using nave Bayes is that one can work with the Naïve Bayes model without using any Bayesian methods.
After determination correctly classified value of Naïve Bayes Classifier is 30, and incorrectly classified value is
4.1.2 Accuracy of Naive Bayes Classifier is 75%. b. Logistic Regression –
Like all regression analyses, the logistic regression is a predictive analysis. Logistic regression is used to describe data and to explain the relationship between one dependent binary variable and one or more nominal, ordinal, interval or ratio-level independent variables.
After determination correctly classified value of Naïve Bayes Classifier is 28, and incorrectly classified value is 12. Accuracy of Naive Bayes Classifier 70%.
4.1.3. Decision Stump –
A decision stump is a machine learning model consisting of a one level decision tree. That is, it is a decision tree with one internal node (the root) which is immediately connected to the terminal nodes (its leaves). A decision stump makes a prediction based on the value of just a single input feature.
After determination correctly classified value of Naïve Bayes Classifier is 27, and incorrectly classified value is 13. Accuracy of Naive Bayes Classifier 67.5%.
4.2. Dataset
The three classifiers Naive Bayes, Logistic Regression, DecisionStump were implemented in WEKA. The data is analysed and implemented in WEKA ("Waikato Environment for Knowledge Analysis") tool.The dataset which we used for our work has 76 attributes. But In this research paper, we have only used 14 most important attribute of heart disease. Total no of data 200. We have used percentage split 80%: this is going to be 80% training data and 20% test data.
5. RESULT & DISCUSSION
True Positives (TP) - These are the correctly predicted positive values which means that the value of actual class is yes and the value of predicted class is also yes. E.g. if actual class value indicates that this passenger survived and predicted class tells you the same thing.
True Negatives (TN) - These are the correctly predicted negative values which means that the value of actual class is no and value of predicted class is also no. E.g. if actual class says this passenger did not survive and predicted class tells you the same thing.
False positives and false negatives, these values occur when your actual class contradicts with the predicted class.
False Positives (FP) – When actual class is no and predicted class is yes. E.g. if actual class says this passenger did not survive but predicted class tells you that this passenger will survive.
False Negatives (FN) – When actual class is yes but predicted class in no. E.g. if actual class value indicates that this passenger survived and predicted class tells you that passenger will die.
Accuracy - Accuracy is the most intuitive performance measure and it is simply a ratio of correctly predicted observation to the total observations. If we have high accuracy then our model is best. Yes, accuracy is a great measure but only when we have symmetric datasets where values of false positive and false negatives are almost same. Therefore, have to look at other parameters to evaluate the performance of model. Accuracy = TP+TN/TP+FP+FN+TN
Precision - Precision is the ratio of correctly predicted positive observations to the total predicted positive observations.
Precision = TP/TP+FP
Recall (Sensitivity) - Recall is the ratio of correctly predicted positive observations to the all observations in actual class - yes.
Recall = TP/TP+FN
Confusion matrix -A confusion matrix is a table that is often used to describe the performance of a classification model (or "classifier") on a set of test data for which the true values are known.
Confusion Matrix
Confusion Matrix of Naive Bayes –
b
a
9 8
a = heart Disease
b
2 21
b = normal
Confusion Matrix of Logistic Regression –
b
a
8 9
a = heart Disease
b
3 20
Confusion Matrix of Decision Stump –
b
a
5 12
a = heart Disease
b
1 22
b = normal
Accuracy: -
Accuracy of Naive Bayes Classifier = 9+21/9+8+2+21 = 0.75%
Accuracy of Logistic Regression Classifier = 8+20/8+9+3+20 = 0.70%
Accuracy of Decision Stump Classifier = 5+22/5+12+1+22 = 0.675%
Comparison of performance of Classifier -
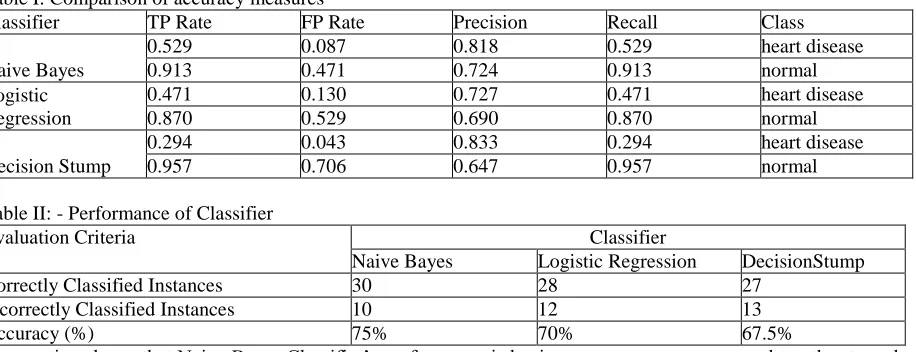
Table I: Comparison of accuracy measures
Classifier TP Rate FP Rate Precision Recall Class
Naive Bayes
0.529 0.087 0.818 0.529 heart disease
0.913 0.471 0.724 0.913 normal
Logistic Regression
0.471 0.130 0.727 0.471 heart disease
0.870 0.529 0.690 0.870 normal
Decision Stump
0.294 0.043 0.833 0.294 heart disease
0.957 0.706 0.647 0.957 normal
Table II: - Performance of Classifier
Evaluation Criteria Classifier
Naive Bayes Logistic Regression DecisionStump
Correctly Classified Instances 30 28 27
Incorrectly Classified Instances 10 12 13
Accuracy (%) 75% 70% 67.5%
Observation shows that Naive Bayes Classifier’s performance is having more accuracy compared to other two classifier. So the best algorithm based on the patient’s dataset is Naive Bayes classifier with accuracy of 75%.
6. CONCLUSION
7. REFERENCES
[1] Deepali Chandna, “Diagnosis of Heart Disease Using Data Mining Algorithm”, (IJCSIT) International Journal of Computer Science and Information
Technologies, ISSN: 0975-9646, Vol. 5 (2), 2014, 1678-1680.
[2] Vikas Chaurasia,“Early Prediction of Heart Diseases Using Data Mining Techniques”,2013,Vol.1,208-217.
[3] Sunita Soni,”Predictive Data Mining for Medical Diagnosis: An Overview of Heart Disease Prediction”, International Journal of Computer
Applications (0975 – 8887), Volume 17– No.8, March 2011.
[4] Aditya Methaila,” Early heart disease prediction using data mining techniques”, CCSEIT, DMDB, ICBB, MoWiN, AIAP – 2014.
[5] Mayuri Takore,”Data Mining Techniques to Find Out Heart Diseases: An Overview”,Volume 4 Issue III, March 2016, ISSN: 2321-9653.
[6] A.Q. Ansari et. al.," Automated Diagnosis of Coronary Heart Disease Using Neuro-Fuzzy Integrated System", 2011 World Congress on Information
and Communication Technologies 978-1-4673-0125-1@ 2011 IEEE (pp 1383-1388).
[7] Mrs. G. Subbalakshmi, Mr.M.Chinna Rao “Decision Support in heart disease prediction system using naïve bays”,IJCSE Indian journal of computer
sciense and engineering, ISSN : 0976-5166 Vol. 2 No. 2 Apr-May 2011
[8] Ramin Assari1,” International Journal of Economics & Management Sciences”, Int J Econ Manag Sci 6: 415. doi: 10.4172/2162-6359.1000415
[9] S. Nikan, F. Gwadry-Sridhar and M. Bauer, "Machine Learning Application to Predict the Risk of Coronary Artery Atherosclerosis," 2016
International Conference on Computational Science and Computational Intelligence (CSCI), Las Vegas, NV, 2016, pp. 34-39.
[10] M. Shouman, T. Turner , "Using data mining techniques in heart disease diagnosis and treatment," 2012 Japan-Egypt Conference on
Electronics,Communications and Computers, Alexandria, 2012, pp. 173-177., doi: 10.1109/JEC-ECC.2012.6186978.
[11] S. Palaniappan and R. Awang, "Intelligent heart disease prediction system using data mining techniques," 2008 IEEE/ACS International Conference on
Computer Systems and Applications, Doha, 2008, pp. 108-115., doi: 10.1109/AICCSA.2008.4493524.
[12] S. U. Amin, K. Agarwal and R. Beg, "Genetic neural network based data mining in prediction of heart disease using risk factors," 2013 IEEE
Conference on Information & Communication Technologies, Thuckalay, Tamil Nadu, India, 2013, pp. 1227-1231. doi: 10.1109/CICT.2013.6558288.
[13] Y. Xing, J. Wang, Z. Zhao and a. Gao, "Combination Data Mining Methods with New Medical Data to Predicting Outcome of Coronary Heart