publications from 2014 to 2018
Yeping Li
1*, Jeffrey E. Froyd
2and Ke Wang
1Abstract
In this editorial, we conduct a systematic review of 144 items published in theInternational Journal of STEM Educationover its first 5-year period from 2014 to 2018. We analyze publication quantities and types, authorship nationality, publication readership, research topic, and top 10 most accessed and top 10 most cited articles over the years. The results provide a snapshot of the research and readership development in multidisciplinary STEM
education as an international field.
Keywords:Journal publications, Readership, Research development, Systematic review
Introduction
TheInternational Journal of STEM Educationis a
multi-disciplinary journal in subject-content education that fo-cuses on the study of teaching and learning in science, technology, engineering, and mathematics (STEM). The year of 2018 is the fifth calendar year of publication for the journal that started in August 2014, although it com-pleted only four publication cycle years by the end of July 2018 (Li, 2018a). The counting by calendar year provides an opportunity to systematically collect and analyze data such as publication downloads, citations, author nationality, and research topics. The review pro-vides valuable information about the core focus of this new journal: educational scholarship and readership across the STEM disciplines. We will explore questions that include: What has been published in multidisciplin-ary STEM education research? Which countries or re-gions, based on the countries or regions in which the authors were located, contributed publications to multi-disciplinary STEM education research? Who accessed and read multidisciplinary STEM education publica-tions? What main topics have emerged in multidisciplin-ary STEM education research based on the journal’s
publications? Which articles in multidisciplinary STEM education research have been highly accessed or cited? Are possible trends identifiable from our analysis?
In this editorial, we examine and summarize the items published in the journal as a window to get a glimpse of the status and trends in scholarship and readership development in multidisciplinary STEM education research. A previous editorial reported on the journal’s general performance and published items’ disciplinary concentrations on the basis of publication cycle year (Li,
2018a), In contrast, this editorial uses data from the first five years from 2014 to 2018 to systematically analyze (1) numbers and types of items published in the journal, (2) geographic distribution of the authors of the journal’s articles, (3) geographic distribution of the journal’s readers, (4) topical areas addressed by the articles and possible developing trends, and (5) the top ten articles in terms of access and citation over the five-year period.
What had the journal published over the 5-year period, 2014 to 2018?
By the end of 2018, the journal had published a total of 144 items, thus averaging 28 items per year. Figure 1
shows the number of items published for each calendar year, from 2014 to 2018. The figure shows the journal started to publish many more items since 2017 (34 and
© The Author(s). 2019Open AccessThis article is distributed under the terms of the Creative Commons Attribution 4.0 International License (http://creativecommons.org/licenses/by/4.0/), which permits unrestricted use, distribution, and reproduction in any medium, provided you give appropriate credit to the original author(s) and the source, provide a link to the Creative Commons license, and indicate if changes were made.
* Correspondence:[email protected]
1Texas A&M University, College Station, TX 77843-4232, USA
56 publications in the fourth and fifth years, respect-ively), in comparison to the first three years from August 2014 to the end of 2016 (i.e., 13, 20, and 21 in the first, second, and third years, respectively). We postulated that the growth in the number of the journal publica-tions reflects growing interest in multidisciplinary STEM education scholarship.
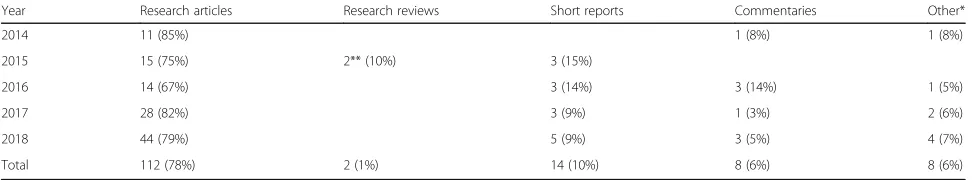
Because the journal publishes several types of items, Table 1 shows the breakdown of these 144 publications by type and calendar year.
Table 1 shows that research articles have been the main type of publication each year, followed by short reports and commentaries. There are also a few items as editorials, guest editorials, and errata. These two errata do not really have specific content; instead, they correct results published in a table. As mentioned in a previous editorial (Li, 2018a), re-search reviews comprise only 1% of the publications over the 5-year period. Although the relatively short history of STEM education may be one reason for such a shortage, the journal certainly encourages submission of research reviews.
Who published in the journal over the 5-year period, 2014 to 2018?
In addition to numbers of publications, analyzing authorship provides another perspective on activity in multi-disciplinary STEM education scholarship. Because each publication may have either one or multiple au-thors, there are different ways of analyzing authorship and nationality. One way (method 1) is to consider only
the corresponding author’s nationality and the first insti-tution affiliation, if multiple instiinsti-tution affiliations are listed. This approach is often valued by some countries and fields, where the scholarly productivity count is not taken as distributed but concentrated. Another approach (method 2) considers every author of a publication. Howard, Cole, and Maxwell (1987) used such an ap-proach with the following formula to quantitatively iden-tify and estimate each author’s contribution to a publication (and thus associated institution’s productivity), when multiple authors are included in a publication. Tsai and his colleagues used this approach of calculating and estimating each author’s contribution to a publication in their sequence of reviews of journal publications in sci-ence education (e.g., Lin, Lin, Potvin, & Tsai,2019; Tsai & Wen,2005). As an example, each publication is given one credit point. For the publication co-authored by two, the first author would be given 0.6 and the second author 0.4 credit point. For this editorial contributed by Li, Froyd, and Wang, the three authors would be credited with scores of 0.47, 0.32, and 0.21, respectively.
Credit score¼ 1:5
n−i
Pn i¼11:5i−1:
Clearly, these two approaches differ in terms of what is considered when analyzing authorship. When a publi-cation has only one author, there would be no difference between these two methods. Both methods would
Fig. 1Number of publications by year (Source: Journal website)
Table 1Number (percentage) of publications of each type by calendar year
Year Research articles Research reviews Short reports Commentaries Other*
2014 11 (85%) 1 (8%) 1 (8%)
2015 15 (75%) 2** (10%) 3 (15%)
2016 14 (67%) 3 (14%) 3 (14%) 1 (5%)
2017 28 (82%) 3 (9%) 1 (3%) 2 (6%)
2018 44 (79%) 5 (9%) 3 (5%) 4 (7%)
Total 112 (78%) 2 (1%) 14 (10%) 8 (6%) 8 (6%)
*Includes editorials, guest editorials, and errata
vantages and disadvantages; therefore, we use both methods in allocating credit to multiple authors for the purpose of analyzing contributions from different coun-tries. In our analysis, we did not differentiate further across different types of publications. However, we ex-cluded the two errata.
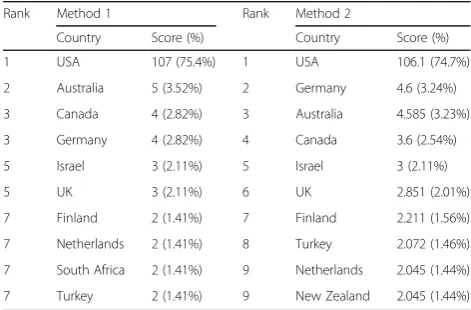
Table2shows authors from a broad range of countries have published in the journal, consistent with the name of the journal. However, a vast majority (75% calculated in either method) of contributions were made by authors from the USA, followed by countries in Europe, Ocea-nia, and Africa. No country in Asia made the top 10 list, except Israel and Turkey depending on how they are identified as in Western Asia or the Middle East as a unique region. Although the results are limited to the journal’s first 5 years from 2014 to 2018, they provide a snapshot on activity in STEM education scholarship across different countries.
Further examination of Table 2 reveals that the two methods provide fairly consistent results, but also yield some differences. For example, Australia had more pub-lications if only the corresponding author was consid-ered, but Germany had more publications when co-authors were considered. A similar pattern can be seen for South Africa and Turkey, where South Africa had more publications under method 1, but Turkey under method 2. Such differences could be dramatic if there
around the world. Figure 2 shows the total number of times journal publications were accessed by year. Over-all, there are three dramatic increases of access over these 5 years: (1) from 2014 (6669 times) to 2015 (55,698 times), a 735% increase or net 49,029 more accesses in 2015; (2) from 2016 (54,883 times) to 2017 (119,095 times), a 117% increase or net 64,212 more accesses in 2017; and (3) from 2017 (119,095 times) to 2018 (217, 873 times), a 83% increase or net 98,778 more accesses in 2018. It may be reasonable to assume that the first dramatic increase from 2014 to 2015 is mainly due to the fact that the journal was launched in August 2014, and more readers got to know about the journal in 2015. However, the second and the third dramatic increases (i.e., from 2016 to 2017, from 2017 to 2018) could be ex-plained by (1) high-quality articles being published in this journal and (2) increasing interest in multidisciplin-ary STEM education research.
Furthermore, it should be pointed out that the second and the third dramatic increases in access (see Fig. 2) parallel the increases in journal publications over the same time period (see Fig. 1). The pattern of the jour-nal’s growth in both publication and access suggests a mutually supportive development of scholarly activity and readership in STEM education over the years.
Going beyond the total number of accesses, it is also important to know who accessed and read the journal. Table 3shows the top five countries that accessed jour-nal publications by year. It shows the internatiojour-nal reach of the journal as well as shifts in access by country. For example, the readers in USA accessed the journal the greatest numbers of times in 2015, 2016, and 2017; how-ever, in 2018, India took the top spot. Brazil was not in the top five in first 3 years in Table 3, but emerged as a country with the third largest number of accesses in 2018.
The development of the journal’s readership is contrib-uted by all five continents. Table4 shows the ranking of five continents in terms of access by year. The Americas had the largest numbers of accesses in 2015 and 2016 but Asia in 2017 and 2018. Taken together, Tables 2, 3, and 4 show the growing international reach of the jour-nal (Li,2018a).
Table 2Comparisons of authorship nationality to 142 publications using two methods
Rank Method 1 Rank Method 2
Country Score (%) Country Score (%)
1 USA 107 (75.4%) 1 USA 106.1 (74.7%)
2 Australia 5 (3.52%) 2 Germany 4.6 (3.24%)
3 Canada 4 (2.82%) 3 Australia 4.585 (3.23%)
3 Germany 4 (2.82%) 4 Canada 3.6 (2.54%)
5 Israel 3 (2.11%) 5 Israel 3 (2.11%)
5 UK 3 (2.11%) 6 UK 2.851 (2.01%)
7 Finland 2 (1.41%) 7 Finland 2.211 (1.56%)
7 Netherlands 2 (1.41%) 8 Turkey 2.072 (1.46%)
7 South Africa 2 (1.41%) 9 Netherlands 2.045 (1.44%)
The journal’s rapid growth in publication and inter-national readership may be attributed both to the rapidly evolving interest in multidisciplinary STEM education around the globe and to the quality of articles published in this journal (see the“Notes”section at the end of this edi-torial).
What main topics were published in the journal over the 5-year period from 2014 to 2018?
To specify and examine research topics published in the journal, we checked several sources of informa-tion including the list of topics in calls for proposals from the US National Science Foundation EHR Core Research in STEM education, several conferences in STEM education, and journal publication reviews in selected disciplines in STEM education (e.g., Hynes, Mathis, Purzer, Rynearson, & Siverling, 2017; Lin et al., 2019; Tsai & Wen, 2005). We initially generated 11 categories of topics and used the 11 topic categories to test code 100 articles published in another journal. Through test coding and discussions, we eventually developed and used the following seven topic categories for examining and classifying the 142 items (excluding the two errata) published in this journal over the 5-year period from 2014 to 2018.
(1) K-12 teaching, teacher, and teacher education in STEM (including both pre-service and in-service teacher education);
(2) Post-secondary teacher and teaching in STEM (including faculty development, etc.);
(3) K-12 STEM learner, learning, and learning environment;
(4) Post-secondary STEM learner, learning, and learning environments (excluding pre-service teacher education); (5) Policy, curriculum, evaluation, and assessment in
STEM education (including literature review about a field in general);
(6) Cultural, social, and gender issues in STEM education; and
(7) History, epistemology, and perspectives about STEM and STEM education.
It should be pointed out that we assigned each publica-tion to only one topic, following other researchers’journal publication analyses (e.g., Lin et al., 2019). When there were cases that more than one topic could have been used, a decision was made in choosing and assigning a topic. The agreement between two coders for all 142 pub-lications was 89%. When topic coding discrepancies oc-curred, a final decision was reached after discussion.
Fig. 2Number of accesses by year (Source: Springer).
Accesses are defined as the number of times full text or PDF versions of articles are accessed directly from the journal website and SpringerLink. Downloads are defined as HTML, LookInside, PDF, and Epub click. Please note that this does not include article downloads from mirror databases such as PubMed Central
Table 3Top five countries that accessed the journal’s publications by year
Rank 2015 2016 2017 2018
1 USA USA USA India
2 Indonesia Indonesia Philippines USA
3 Turkey Philippines Indonesia Brazil
4 UK India India Philippines
5 Hong Kong Thailand Australia Indonesia
Source: Google Analytics
Table 4The journal’s access ranking across five continents by year
Rank 2015 2016 2017 2018
1 Americas Americas Asia Asia
2 Asia Asia Americas Americas
3 Europe Europe Europe Europe
4 Oceania Oceania Africa Oceania
5 Africa Africa Oceania Africa
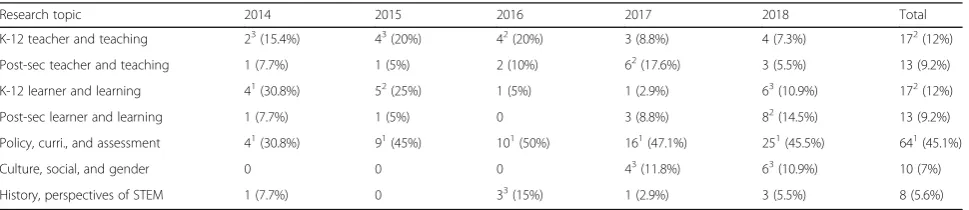
est in both teaching and learning in K-12 STEM educa-tion. On an annual basis, the topics with the second or third most publications varied across the 5-year period.
Table5 shows there was a tie between two topics with the fourth most cumulative publications,“post-secondary teacher & teaching”and“post-secondary learner & learn-ing.”Also, the number of publications in these two areas combined was high over the last 2 years. This may suggest a growing interest in post-secondary STEM learning and teaching. Further for the topic“culture, social, and gender issues in STEM education,”there were no publications for the first 3 years, but it was the topic with the third most publications in 2017 and 2018, with a focus“on cultural, social, and gender issues in STEM education” such as STEM identity and students’career choices in STEM. This may also suggest a growing interest in this topic. It would be interesting to see how these publication patterns with respect to these research topics evolve in the future.
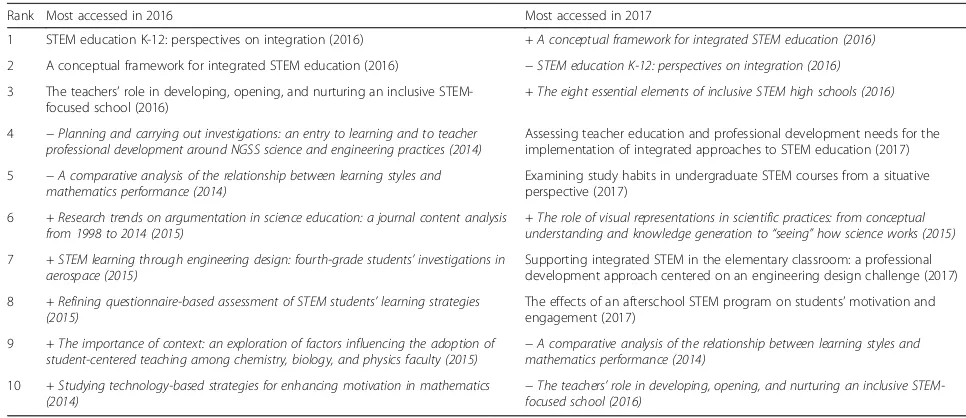
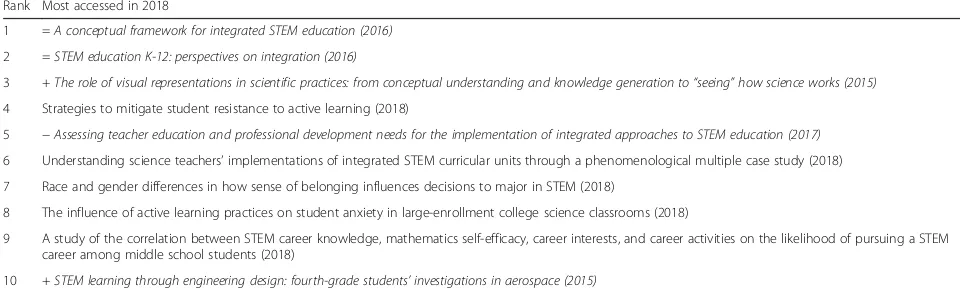
Which publications were the top 10 most accessed or cited over the 5-year period from 2014 to 2018?
With the data from Springer, we were able to rank publi-cations in terms of access and citations. Tables 7, 8, and 9 in the Appendix show the top 10 publications most frequently accessed in each year. In general, there are no obvious patterns across these tables. The publications that made the top 10 most accessed list each year vary in terms of how many were new publications in that year and how many were from previous years (e.g., two
some publications are the most accessed overall and most accessed for multiple years. The synthesis shows that the same is true for theInternational Journal of STEM Educa-tion. We took a further look at research topic areas for each of the 10 publications that made the top 10 most accessed lists 2 or more years, and found that three are in
“K-12 teacher & teaching,”one in“post-secondary teacher & teaching,”two in“K-12 learner & learning,”two in“ pol-icy, curriculum, and assessment,”and two in“history, per-spectives of STEM.”Although discerning specific patterns is difficult, K-12 STEM education (topics“K-12 teacher & teaching” and “K-12 learner & learning”) had sustained interest from readers with five out of these 10 publications in these topic areas. The observation aligns with the num-ber of cumulative publications on these topics (see Table5) . However, the topic“policy, curriculum, and assessment,” which was the topic with the most publications, has only two publications that made to the top 10 most accessed lists in multiple years. These diverse results likely suggest that STEM education, as a field, is still undergoing tre-mendous development.
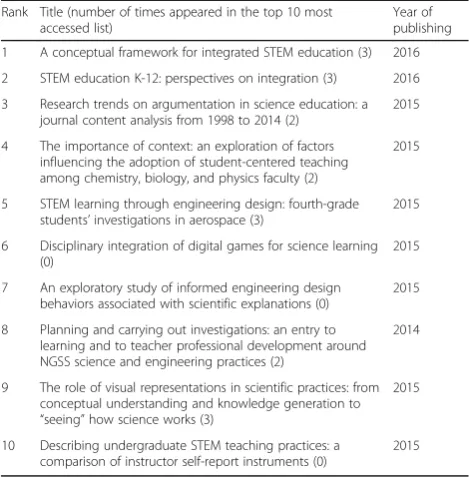
Table 6 shows the top 10 most cited publications by the end of 2018. The middle column shows the title and the number of years the title appeared in the top 10 most accessed list. It is understandable that none of these publications is from the years of 2017 and 2018, as accumulating citations takes time. Additionally, we checked this list in terms of the number of times an art-icle appeared in the top 10 most accessed list. It is inter-esting, but not so surprising, that some publications
Table 5Frequencies and percentages of research topic distributions over the 5 years
Research topic 2014 2015 2016 2017 2018 Total
K-12 teacher and teaching 23(15.4%) 43(20%) 42(20%) 3 (8.8%) 4 (7.3%) 172(12%)
Post-sec teacher and teaching 1 (7.7%) 1 (5%) 2 (10%) 62
(17.6%) 3 (5.5%) 13 (9.2%)
K-12 learner and learning 41(30.8%) 52(25%) 1 (5%) 1 (2.9%) 63(10.9%) 172(12%)
Post-sec learner and learning 1 (7.7%) 1 (5%) 0 3 (8.8%) 82
(14.5%) 13 (9.2%)
Policy, curri., and assessment 41(30.8%) 91(45%) 101(50%) 161(47.1%) 251(45.5%) 641(45.1%)
Culture, social, and gender 0 0 0 43
(11.8%) 63
(10.9%) 10 (7%)
History, perspectives of STEM 1 (7.7%) 0 33(15%) 1 (2.9%) 3 (5.5%) 8 (5.6%)
1
Number one topic
2
Number two topic
3
were both highly accessed and highly cited. At the same time, three publications made this top 10 most cited list, but never appeared on a top 10 most accessed list. The result suggests that the most accessed publications and the most cited publications provide us two lenses to learn about readers’and researchers’interests.
If taking a further look at these publications in Table6
in terms of research topic areas, we found that five are in“policy, curriculum, and assessment”(topic 5), a topic area with the most publications in the journal over the 5-year period (see Table 5). The results likely suggest that researchers shared similar interest, as a community, on research topics in terms of what received the most attention in publications and citations.
Coda
The systematic analysis of publications in theInternational Journal of STEM Educationfrom 2014 to 2018 reveals tre-mendous development in terms of both publications and readership. While there are demonstrable increases in terms of quantity, the evidence, especially on citations and access, suggests an on-going elevation on the quality of publications. Analysis of publications in terms of research topics, albeit with the limited number of publications, showed the development of STEM education as a field in its early stage (Li,2014,2018b). Specifically, with the rapid changes in STEM education internationally, it is often diffi-cult for researchers to gauge interests of researchers and readers. The analyses of the top 10 most accessed and top 10 most cited publications may thus help uncover not only possible trends in research development, but also possible consistencies and inconsistencies in terms of scholarly
interest and attention for both authors and readers. Such information should be helpful to the research community in thinking about and reflecting on possible research devel-opment. At the same time, the results of this analysis also suggest the need and importance of analyzing publications in other journals to examine and document the status and development trends in STEM education research.
In many ways, the analysis shows trends beyond the journal. For example, it is interesting that Asia had the most dramatic increases in readership about STEM edu-cation over the past 5 years (see Table4), but publications in the journal from Asia were very limited over the same time period (see Table 2). The contrast suggests that al-though scholarship in STEM education started in the USA, not Asia, increased interest in scholarship in STEM education in Asia may likely fuel an increase in research productivity in STEM education in the near future.
We want to take this opportunity to thank all authors, reviewers, and readers for their contributions and sup-port. We are happy to learn from this review that the journal has drawn authors and readers from all over the world. We cannot be happier if this journal also serves as a platform to help “fuel” research development in STEM education in all five continents. We sincerely hope that the journal will continue its growth as a gath-ering place for many more international researchers and readers in STEM education to enjoy.
Notes
As reported before (Li, 2018a), the International Journal
of STEM Educationhas been selected and reviewed in the
Web of Science’s Emerging Sources Citation Index (ESCI) beginning in early 2018, in addition to other important indexing services including Scopus, Google Scholar, and almost 20 other data searching and indexing services. Fur-thermore, analysis of citations of the journal’s publications is ongoing. The initial analysis of citations based on Springer Nature Insights data shows there were a total of 417 citations for the 142 publications by the end of 2018. This achievement reflects the high quality of the articles that authors have contributed to the multidisciplinary field of STEM education internationally.
In a related note, another new journal,Journal for STEM Education Research(see https://www.springer.com/41979), was launched as an interdisciplinary education research journal in STEM education (Li, 2018b). The journal pub-lished only nine items as the first double issue in December 2018 but already had 5147 downloads in 2018 from Spring-erLink alone. In comparison to this journal’s first year ac-cess (i.e., 6669 in 2014 on 13 items published in that year), theJournal for STEM Education Research enjoyed signifi-cant access in its first year. Its number of downloads pro-vides another indication of the rapid growth of the international field of STEM education.
Table 6Top 10 most cited publications by the end of 2018
Rank Title (number of times appeared in the top 10 most accessed list)
Year of publishing
1 A conceptual framework for integrated STEM education (3) 2016
2 STEM education K-12: perspectives on integration (3) 2016
3 Research trends on argumentation in science education: a
journal content analysis from 1998 to 2014 (2)
2015
4 The importance of context: an exploration of factors
influencing the adoption of student-centered teaching among chemistry, biology, and physics faculty (2)
2015
5 STEM learning through engineering design: fourth-grade
students’investigations in aerospace (3)
2015
6 Disciplinary integration of digital games for science learning
(0)
2015
7 An exploratory study of informed engineering design
behaviors associated with scientific explanations (0)
2015
8 Planning and carrying out investigations: an entry to
learning and to teacher professional development around NGSS science and engineering practices (2)
2014
9 The role of visual representations in scientific practices: from
conceptual understanding and knowledge generation to
“seeing”how science works (3)
2015
10 Describing undergraduate STEM teaching practices: a
comparison of instructor self-report instruments (0)
STEM education and research worldwide (2014) global trends (2015)
4 Investigation about representations used in teaching to prevent misconceptions regarding inverse proportionality (2014)
Learning to teach scientific practices: pedagogical decisions and reflections during a course for pre-service science teachers (2015)
5 Developing a computer-based assessment of complex problem solv-ing in chemistry (2014)
Exploring variation in measurement as a foundation for statistical thinking in the elementary school (2015)
6 Meteorology meets engineering: an interdisciplinary STEM module for middle and early secondary school students (2014)
Teachers’perceptions of students’mathematical work while making conjectures: an examination of teacher discussions of an animated geometry classroom scenario (2015)
7 Mathematics and biology teachers’tacit views of the knowledge required for teaching: varying relationships between CK and PCK (2014)
Research trends on argumentation in science education: a journal content analysis from 1998 to 2014 (2015)
8 Diffusion of research-based instructional strategies: the case of SCALE-UP (2014)
STEM learning through engineering design: fourth-grade students’ in-vestigations in aerospace (2015)
9 Exploring the dynamics of organizational learning: identifying the decision chains science and math faculty use to plan and teach undergraduate courses (2014)
The role of visual representations in scientific practices: from conceptual understanding and knowledge generation to“seeing”how science works (2015)
10 Understanding of high-achieving science students on the nature of science (2014)
The importance of context: an exploration of factors influencing the adoption of student-centered teaching among chemistry, biology, and physics faculty (2015)
*Access counts only in that specific year, not accumulated from previous year(s)
**Title (publishing year), the publication initalicmeans that it was published in a previous year;“=”the same rank,“+”rank up,“−” rank down. The same notations are used in Tables8and9
Table 8Top 10 most accessed publications in 2016 and in 2017
Rank Most accessed in 2016 Most accessed in 2017
1 STEM education K-12: perspectives on integration (2016) +A conceptual framework for integrated STEM education (2016)
2 A conceptual framework for integrated STEM education (2016) −STEM education K-12: perspectives on integration (2016)
3 The teachers’role in developing, opening, and nurturing an inclusive
STEM-focused school (2016)
+The eight essential elements of inclusive STEM high schools (2016)
4 −Planning and carrying out investigations: an entry to learning and to teacher professional development around NGSS science and engineering practices (2014)
Assessing teacher education and professional development needs for the implementation of integrated approaches to STEM education (2017)
5 −A comparative analysis of the relationship between learning styles and mathematics performance (2014)
Examining study habits in undergraduate STEM courses from a situative perspective (2017)
6 +Research trends on argumentation in science education: a journal content analysis from 1998 to 2014 (2015)
+The role of visual representations in scientific practices: from conceptual understanding and knowledge generation to“seeing”how science works (2015)
7 +STEM learning through engineering design: fourth-grade students’investigations in aerospace (2015)
Supporting integrated STEM in the elementary classroom: a professional development approach centered on an engineering design challenge (2017)
8 +Refining questionnaire-based assessment of STEM students’learning strategies (2015)
The effects of an afterschool STEM program on students’motivation and
engagement (2017)
9 +The importance of context: an exploration of factors influencing the adoption of student-centered teaching among chemistry, biology, and physics faculty (2015) −
A comparative analysis of the relationship between learning styles and mathematics performance (2014)
10 +Studying technology-based strategies for enhancing motivation in mathematics (2014)
Acknowledgements
The author would like to thank Marius Jung and other staff at Springer Nature for their support of providing relevant data and valuable feedback on earlier versions of this editorial, and Yu Xiao for helping code and cross-check the publications’research topics.
Authors’contributions
YL initiated to analyze the data and draft the manuscript. JEF reviewed the drafts and contributed to the draft revisions. KW helped with the data coding and reviewed the manuscript drafts. All authors read and approved the final manuscript.
Funding Not applicable
Availability of data and materials
The data and materials used and analyzed for the editorial were these articles published in this journal or were provided by Springer. Journal article information is publicly available at the journal’s website (https://
stemeducationjournal.springeropen.com).
Competing interests
The authors declare that they have no competing interests.
Author details 1
Texas A&M University, College Station, TX 77843-4232, USA.2Ohio State University, Columbus, OH 43210, USA.
Received: 12 May 2019 Accepted: 30 May 2019
References
Howard, G. S., Cole, D. A., & Maxwell, S. E. (1987). Research productivity in psychology based on publication in the journals of the American Psychological Association.American Psychologist, 42(11), 975–986. Hynes, M. M., Mathis, C., Purzer, S., Rynearson, A., & Siverling, E. (2017). Systematic
review of research in P-12 engineering education from 2000–2015.
International Journal of Engineering Education, 33(1B), 453–462. Li, Y. (2014). International Journal of STEM Education–a platform to promote
STEM education and research worldwide.International Journal of STEM Education, 1, 1.https://doi.org/10.1186/2196-7822-1-1.
Li, Y. (2018a). Four years of development as a gathering place for international researchers and readers in STEM education.International Journal of STEM Education, 5, 54.https://doi.org/10.1186/s40594-018-0153-0.
Li, Y. (2018b). Journal for STEM Education Research–promoting the development of interdisciplinary research in STEM education.Journal for STEM Education Research, 1(1–2), 1–6. https://doi.org/10.1007/s41979-018-0009-z.
Lin, T.-J., Lin, T.-C., Potvin, P., & Tsai, C.-C. (2019). Research trends in science education from 2013 to 2017: A systematic content analysis of publications in selected journals.International Journal of Science Education, 41(3), 367–387.
Tsai, C.-C., & Wen, L. M. C. (2005). Research and trends in science education from 1998 to 2002: A content analysis of publications in selected journals.
International Journal of Science Education, 27(1), 3–14.
Publisher’s Note
Springer Nature remains neutral with regard to jurisdictional claims in published maps and institutional affiliations.
Table 9Top 10 most accessed publications in 2018
Rank Most accessed in 2018
1 =A conceptual framework for integrated STEM education (2016)
2 =STEM education K-12: perspectives on integration (2016)
3 +The role of visual representations in scientific practices: from conceptual understanding and knowledge generation to“seeing”how science works (2015)
4 Strategies to mitigate student resistance to active learning (2018)
5 −Assessing teacher education and professional development needs for the implementation of integrated approaches to STEM education (2017)
6 Understanding science teachers’implementations of integrated STEM curricular units through a phenomenological multiple case study (2018)
7 Race and gender differences in how sense of belonging influences decisions to major in STEM (2018)
8 The influence of active learning practices on student anxiety in large-enrollment college science classrooms (2018)
9 A study of the correlation between STEM career knowledge, mathematics self-efficacy, career interests, and career activities on the likelihood of pursuing a STEM
career among middle school students (2018)