Japan
Full list of author information is available at the end of the article
studying how innovation emerges from the blending of accumulated knowledge, and from which path an innovation mostly inherits. A citation network can be seen as a perfect example of one generative process leading to innovation. However, the impact and influence of scientific publication are always difficult to capture and measure. We offer a new take on investigating how the knowledge circulates and is transmitted, inspired by the notion of “stream of knowledge”. We propose to look at this question under the lens of flows in directed acyclic graphs (DAGs). In this framework inspired by the work of Strahler, we can also account for other well known measures of influence such as theh-index. We propose then to analyze flows of influence in a citation networks as an ascending flow. From this point on, we can take a finer look at the diffusion of knowledge through the lens of a multiplex network. In this network, each citation of a specific work constitutes one layer of interaction. Within our framework, we design three measures of multiplex flows in DAGs, namely the aggregated, sum and selective flow, to better understand how citations are influenced. We conduct our experiments with the arXiv HEP-Th dataset, and find insights through the visualization of these multiplex networks.
Keywords: Citation network, Directed acyclic graph (DAG), Multiplex network, Metrics, Large network, Flow of knowledge
Introduction
From the ancient times, knowledge has passed from individuals to others, each step leading to more discoveries and innovations. In modern times, the industrializa-tion of research renders crucial to track this producindustrializa-tion of knowledge (Gibbons and Johnston 1974; Van Raan 2004). Indeed, it is important for the newly produced innova-tion to state on which ground it stands, enabling peers to judge the quality of the proposed innovation. An innovation must cite its influential sources to give credit to the work it was inspired from and to state its differences with the competing methods. This is one prin-ciple at the heart of the peer reviewing system enabling and validating the publication of new knowledge.
This process of citing sources is very important, because it makes explicit the transmis-sion of knowledge from prior works to an innovation (Bornmann and Daniel 2008) — with the assumption that each new scientific publication is a container of innovation. Thank-fully, this production of scientific knowledge can be easily captured in a citation graph. In this graph, nodes are publications citing other publications. This citation relationship
© The Author(s). 2017Open AccessThis article is distributed under the terms of the Creative Commons Attribution 4.0
is oriented and corresponds to a borrowing or derivation of knowledge. We suspect that the impact of a publication can be captured in this graph. The production of knowledge would then be represented as a growing process in a dynamic network.
Key for countries and organizations in modern science, the study of the production of knowledge is currently investigated from partial indicators that establish rankings and compare scientists. This gave rise to the development of many measures deriving from sociometrics (Waltman 2016) including age, field, and other cues. Three popular indica-tors are often used: the number of citations, theh-index (Hirsch 2005) — which originally measures both the productivity and the quality of an author —, and the impact factor (Reuters 2012) — which is a time-related average number of citations of a collection. These indicators are used for the evaluation of scientists, however they can be sub-ject to controversy (Pendlebury 2009) and are designed to reflect only the productivity of a scientist rather than measuring the overall production of knowledge. One reason explaining these indicators’ popularity is their simplicity in terms of computation, as opposed to previous network analysis that was seen as too complex to deploy. However, progress in modern graph databases has grown, easing the analysis of dynamic networks (Cattuto et al. 2013).
Inspired by the seminal work from Strahler (1957) and from Hirsh (2005), we propose to bring a fresh look at the production of knowledge based on the analysis of flows in Directed Acyclic Graphs (DAGs). This view is not limited to the production of indica-tors but allows a more in-depth analysis of the process and diffusion of knowledge. The traditional indicators are very effective and it is important that our framework allows to establish them, while being easily extended. In addition, this DAG framework allows us to take a new perspective on citation relationships and introduces a multiplex network (Kivelä et al. 2014) model that emphasizes on co-citations (as opposed to the regular monoplex citation network).
In this work, we extend our proposition to join the different views on knowl-edge production in a recursive framework (Renoust et al. 2017) (which is covered in “Ascending flow in citation networks” section) to the analysis of multiplex citation networks and contribute with a new formalism, measures and experiments.
observing controlled domains, with well known sociometric indicators. We are instead interested in the modeling of the production and diffusion of knowledge.
Many interesting attempts for modeling the production and diffusion of knowledge are actually focused on theproducersof knowledge themselves, such as in multi-agent simu-lation (Cowan and Jonard 2001; Cointet and Roth 2007). In these models, the agents are interacting to produce knowledge, and the properties of the resulting interaction network of agents are the focus of analysis. The agents can then be tuned to produce different resulting networks, simulating real world policies (Mueller et al. 2015). The topology of the networks of people producing knowledge is often the main focus in related complex network research (Cowan R and Jonard 2004), with the goal to maximize diffusion in such networks (Alkemade and Castaldi 2005). In contrast, our focus is on the information produced itself and how it relates to previous works.
A good model for this is the citation graph. It mostly applies to academic research, but has found its way in complex network research. Numerous works actually focus on com-munities (Chen and Redner 2010), and on the characterization of the dynamics of the citation graphs (Gehrke et al. 2003). The closest to the spirit of our research would be the work by Hummon and Dereian (1989) who studied the main paths in the citation network in order to extract backbones and areas of interest. The question of the efficient imple-mentation of these cues has been the focus of a previous contribution (Batagelj 2003). An extension of Hummon and Dereian’s original work has actually been applied to the study of the development of theh-index (Liu and Lu 2012). These methods are focused on the path produced by citations and use them as a base for bibliometrics, but without capturing the global flow of information. We propose in contrast a natural interpreta-tion of flows in DAGs that can easily capture the same measures used for main path analysis.
based measures are measures to analyze the productivity of researchers, but do not allow for the in-depth analysis of production, in opposition to main path analysis approaches.
Our work roots its contribution in the analysis of flows in DAGs. Traditional max-flow approaches are quite far from what we define here, because nodes are always sources of information and edges have infinite capacities — we may be closer to multicommodity flows (Assad 1978). Instead, we mostly take our inspiration from a different notion of flows, in river streams, as defined by Strahler (1957). Limited to binary trees, this notion has seen a few extensions (Auber 2002; Delest et al. 2006; Herman et al. 1999) with appli-cations to graph visualization. These versions use flows to highlight and extract most relevant paths in DAGs and trees, then relatively place elements one to another. We will use this approach and adapt it to the production of knowledge.
Multiplex approaches
We later introduce the multiplex formulation of the citation network, which is a network made of multiple overlapping networks (each of which corresponds to a layer) connect-ing the same set of nodes (Berlconnect-ingerio et al. 2013). Multiplex networks have been used to model citation networks mainly for clustering purpose (Boden et al. 2012; Dong et al. 2012; Renoust et al. 2014; Speidel et al. 2015). Boden et al. (2012) model the multiplex network from the keyword-publication associations in order to create clusters of publi-cations of similar topic. Dong et al. (2012) share the same goal but mixes different layers from research domains, or different similarity links across the papers (diverse textual sim-ilarities, author similarity, and citations). Renoust et al. (2014) use an approach closer to Boden’s, with the different goal to find cohesive groups of co-authors in an author-publication network. Analysis of multiplex DAGs has also recently been proposed by Speidel et al. (2015) using the same arXiv HEP-Th dataset that we use, with the difference that layers are defined by year of publication. Beyond community detection, Pujari and Kanawati (2015) investigated the multiplex citation networks to predict the creation of link between authors: from the citation network they infer a multiplex network of authors and predict links, based on community structure. Our context differs in many ways from those works. The object we are studying, although from the same data, is very different. We keep the citation network as a support for modeling multiplex relationships, with the basic assumption of having a DAG structure. The network we construct presents a very large number of layers (one per co-citation) which is often an issue in the methods pre-sented above. Our goals also differ, we are looking to find paths and remarkable nodes to evaluate the notion of publication impact.
Ascending flow in citation networks
We now introduce the notion of flow in a citation network inspired by the work of Strahler. We propose the ascending flow, parameterization, and experiments in the arXiv HEP-Th dataset.
Preliminaries
We consider in our setting a citation graphG = (V,E) where V is a set of nodes — publications— andEa set of directed links, hereafter arcs, between nodes ofV. An arc a(p,q)∈Erepresents a citation of publicationqby publicationp. We consider the graph as being directed acyclic (or DAG). Although real-world data may introduce a few cycles (arXiv edits leading to mutual citations), this is a marginal case that we will discard in our study.
In this setting, an author, journal, book, or proceedings can be modeled as collections of publications. Hence, by observing the collective impact of the collection we can char-acterize the influence of this set of publications. In other words, in our citation graph formalism — although we will not study them — collections are only sink nodes that can be sourced from the publications themselves. In this work, our measures of the impact of individual publications can be trivially reported to authors and collections.
Definition 1For a publication p, its in-neighborhoodN−(p)is the set of all the pub-lications referring to p. The size ofN−(p) is simply its in-degree d−(p). The corollary implies thatN+(p), the out-neighboorhood of p, corresponds to all publications to which p is referring to (with a size d+(p), its out-degree).
Strahler numbers measure the size of river streams depending on their flow of parent streams. If we recall the definition of Strahler’s numbers (Strahler 1957), in binary trees, it starts by assigning 1 to all leaf nodes, then iterates on parent nodes. If a parent node has at least two children with number i, then the node is assigned i + 1, otherwise i. This number corresponds to the number of reg-isters necessary to compute binary operations (Flajolet et al. 1979). The Extended Strahler (Auber 2002) does it for general trees (counting the register numbers ofn-ary operations).
(e.g. an author) does not increase value from his maximum valuated nodes, but instead gets weighted by the maximum Extended Strahler number of his direct descendants (i.e. the publications).
Strahler numbers have been designed to define the size of river streams based on a hierarchy of dependent streams. Transmission of knowledge is very similar in that sense with publications being tributary to prior works they inherit from, and becoming in turn sources for later works — theh-index then captures the latter quantity. However, we want a finer measure which could capture the impact of a publication across all citations it has generated.
We defined above our citations graphs to be DAGs, and fortunately, Strahler num-bers have also been extended to DAGs (Herman et al. 1999; Delest et al. 2006). Herman et al. (1999) proposes a generic framework to compute the importance K of nodes in DAGs — including Strahler numbers — such as:
K(p)=
λ, ifN−(p)= ∅ FK(a1),. . .,K(ad−(p))
, otherwise, (1)
where λ designates a constant for terminal cases (leafs, often λ = 1), ai ∈
N−(p) represents the ancestors of node p, and F is an application depending on the values K(a1),. . .,K(ad−(p)). To simplify the notations, we denote F(N−(p)) =
F(K(a1),. . .,K(ad−(p))).
This framework is nothing but a generic recursive framework, however it allows us to redefine other measures through it. In this context, counting the number of citations would only require to modify the applicationF(N−(p)), such asF(N−(p))= |N−(p)| = d−(p). Similarly, the Strahler number of a nodepis then defined as:
F(N−(p))= ⎧ ⎪ ⎨ ⎪ ⎩
1, ifd−(p)=0
max
q∈N−(p)(K(q))+
d−(p)−1 if all valuesK(q)are equal d−(p)−2 otherwise
(2)
The application for theh-index then becomes:
F(N−(p))= ⎧ ⎨ ⎩
0, ifd−(p)=0 max
X⊂N−(p)minq∈X(d
−(q),|X|) (3)
Strahler numbers, number of citations, andh-index impose a discrete limit in depth which is conceptually an issue — there is no reason not to look for all the extended conse-quences of a publication. Instead, Herman et al. (1999) propose in their framework aFlow metricfor DAGs to emphasize the distribution of information to their successor such as:
F(N+(p))= ⎧ ⎨ ⎩
1, ifd+(p)=0
i K(si)
d+(si) otherwise,
(4)
wheresi∈N+(p)represent the successor ofp(instead of the ancestorai). Note that this
defines adescendingflow measure, which captures how much information all nodes in the network receive.
Before we provide our own measure of flow, two natural definitions help defining our framework and its integration with existing metrics.
each node — being a publication — produces some information and this production of information gives credit to their ancestors (in history, or successors in the DAG) as they refer to them. This translates into the framework as:
F(N+(p))=
i
K(si)
d+(si) +λp
(5)
whereλp represent the information created by the publicationp— in practice we set
λp=1. Hence, the more a publication is influential the more credit it will propagate to its
ancestors. In contrast to the previousFlow metric, our ascending flow is not only applied to the reversed DAG, but is also equivalent to the sum of the flows computed for each sub-DAG induced by each node.
The ascending flow, formalized above, can be implemented as Algorithm 1. It is impor-tant to note that each arc is visited only once and that the total number of visits of all nodes is also equal to the number of arcs. The time complexity of our algorithm is then (m)wheremis the number of arcs. This key property is inherent to the DAG nature of our citation network. Another straightforward property of DAGs is thatm n(n2−1) wherenis the number of nodes. However, even a linear time complexity is often too costly for large dynamic networks.
Depth restriction and dynamic graph
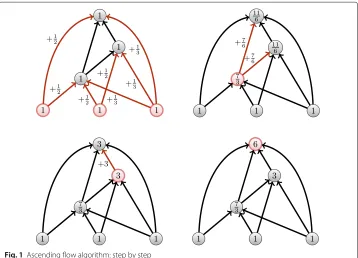
As discussed above, one issue of computing the ascending flow of a nodepfrom our def-inition is that it needs the computation of all its predecessors own influence. Such a con-straint is expansive in the context of a dynamic network, for instance citation networks — in the case of citation network, publication are usually added, not removed. To adapt our previous algorithm, we first need to introduce an update function starting from a single leaf (a new publication). We consider the network initializes as in Algorithm 1 but for the flow value on the nodes — that is kept between the updates. We then propagate upwards the flow value in all the subgraphs defined by the ancestors of this publication (Fig. 1).
Algorithm 1:Ascending flow
input : A citation network with nodes (articles) and arcs (citations) An empty dequeueQ(FIFO)
A functionλinitover the nodes
output: The ascending flow on each node (article) and each arc (citation)
1 Initialize each articlepwith a flow valueλp=λinit(p)(=1by default)
2 Color each arc in white
3 Add all leaves inQ
4 whileQ is not emptydo
5 p←pop_first(Q)
6 foreach q son of pdo
7 Color each(p,q)in blue
8 λq←λq+λp/d+(p)
9 ifall incoming arcs of q are bluethen
10 Q←push_last(q)
11 end
12 end
13 end
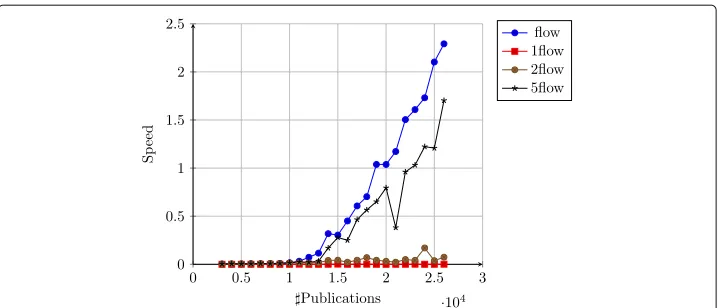
citation network, ak-diffuse measure is very quick to compute whenkis a small constant as displayed in Fig. 2.
This depth parameter additionally allows us to reconnect with known measures. The h-index is 2-diffuse and it would not make sense to extend its definition. In turn, the number of citations — which is also the in-degree (d−(p)) — is 1−diffuse and can be
Fig. 2Speed comparisons of our algorithm in case ofk-diffuse limitations
easily translated in ak-diffuse measure, the k-degree, which would be the number of publications created until generationk. Then, an∞-degree would be the number of all publications seeded bypeven indirectly.
Experimental results
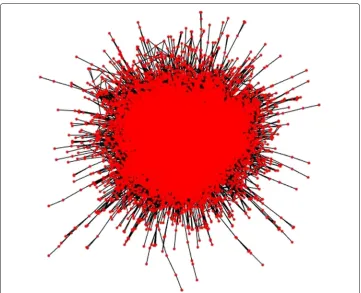
We now apply our framework on a real-world setting. We used an available citation graph from 2003 KDD Cup: arXiv HEP-Th1(Gehrke et al. 2003). It consists in an archive of 27,770 publications with 352,807 (internal) citations from the well-known arXiv website of pre-prints in the domain of high energy physics theory, archived between January 1992 to April 2003.
The resulting graph (Fig. 3) is not acyclic due to the nature of publications in arXiv — some publications have been updated with cross-references to others. We can however consider this graph as pseudo-acyclic because the number and size of the cycles are lim-ited (a few cycles of size 2 and 1 cycle of size 3). In our setting we simply remove those edges to keep the properties of a DAG. A resulting excerpt of the graph is shown in Fig. 4.
Correlations between measures on the whole archive
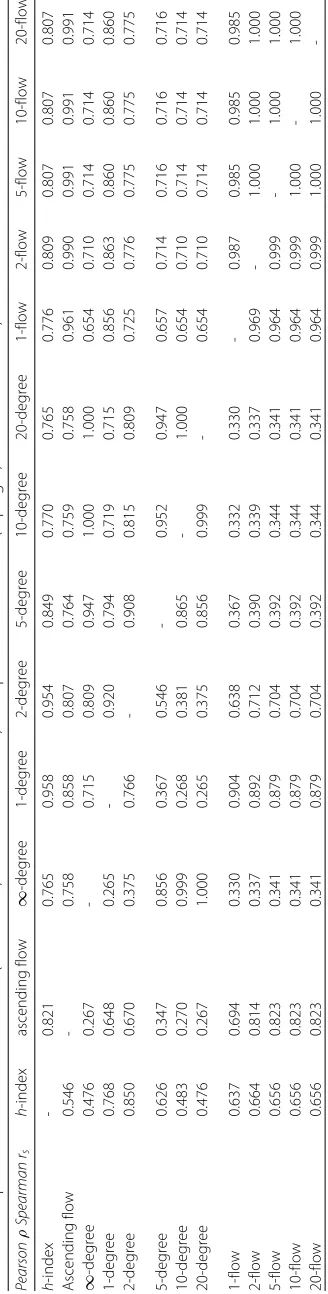
As we have defined the generalized version of the number of citations in our framework and theh-index, we can compare these measures together using the Pearson (ρ) and Spearman (rs) correlation coefficients. We hold the following assumption: if the
ascend-ing flow can reconnect at least partially to the notion of degree andh-index, we can then validate the relevance of our framework. Results of the analysis are presented in Table 1 and Fig. 5.
Fig. 3The arXiv HEP-Th (high energy physics theory) citation network. Its main connected component with 27770 nodes (articles) and 352807 arcs (citations)
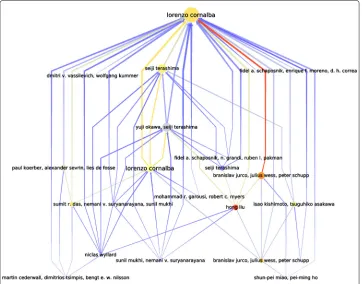
Our main observation, is, by value, theh-index is most correlated to the 2-degree. This makes complete sense, since theh-index is also limited in depth at 2 for which it con-siders a subset of publications. In contrast, when it comes to rankings, theh-index is most correlated to the 1-degree which is equivalent to the number of citations. Inter-estingly, our ascending flow also shares most correlation with the 2-degree as well and ranks with the 1-degree. This interesting effect may also be observed in Fig. 4 show-ing that most publications brshow-ingshow-ing influence to the source publication has done it already in depth two. The link between theh-index and the degree is further observable in Fig. 5.
In terms of computation, fromk = 2, the ranks obtained by thek-flow arers = 0.99
similar of those of the regular flow so when a gain of computation is needed, one can use k-diffuse version of the algorithm (Fig. 2).
Searching for a needle in the haystack
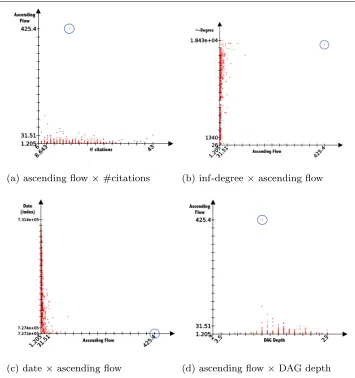
We observed all publications withh-index= 6 (1054 publications in the dataset). With this sample of fixedh-index nodes, the ascending flow does not correlate well with other classical measures:ρ = 0.136 with the 2-degree which was the most correlated value over the network with the ascending flow and theh-index,ρ=0.096 with the number of citations,ρ=0.228 with the total descending nodes (∞-degree).
Fig. 4An example of the ascending flow metric in an excerpt of 22 nodes (60 edges) of our dataset, rooted by a publication by Lorenzo Cornalba. The size of nodes corresponds to their ascending flow in this subgraph. The color of nodes and edges (frombluetored) is actually their ascending flow in the real global dataset — we can see that Hong Liu’s publication has probably been a seed for more knowledge than of its ancestor Lorenzo Cornalba
if the node was an outlier in all other measures, including date and DAG depth (which could be the longest if the node has deep descending nodes), but the work is not an outlier in any of those measures.
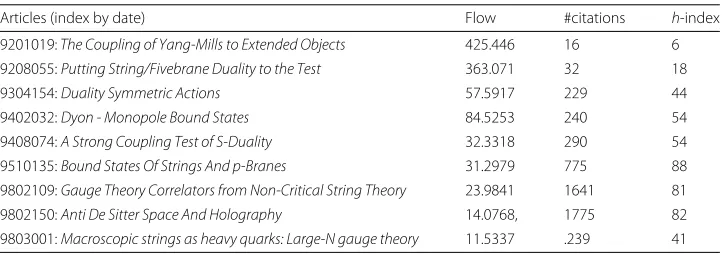
If we look in details at why this node received so much flow, we can “follow down” the path of maximum flow passed by its citing publications: we recursively take the edge that shares the maximum value until there is no other citing node. The path is only 22 edges long and the influence received by the nodes constantly increases up to 7 nodes before decreasing (Table 2 presents the statistics of the 8 first nodes of the path). Two articles in this path are the #2 and #3 most cited works in the whole archive!
Comparisons of “similar” publications
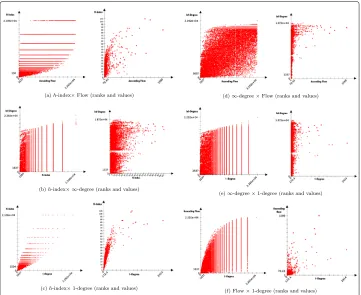
-Fig. 5Comparative distribution of ranks and values among:•h-index (a,b,c),•ascending flow (a,d,f),
• ∞-degree – i.e. number total of generated publications (b,d,e),•and 1-degree – i.e. number of citations of a publications (c,e,f). The plots illustrate the difference between what those statistics are measuring
this same publication). In the first case, we have 390 citation arcs, while we have 171 arcs in the second case.
We repeated the same experiment with two varying 2-flow measures (h-index=6 and similar date of publication): the first one is 2.25 with 10 citations (Fig. 7b, left), and the second one is 21.59 with 20 citation (Fig. 7b, right). The averageh-index is actually higher in the least influential publication (3.45) than in the most influential publication (1.80). However, the most influential has seeded 102 publications (2-degree) for 107 arcs out, when the first one has seeded 68 publications (2-degree) for 182 arcs. The flow measures then capture much more details of the graph produced by citations than theh-index does.
The citation network as a multiplex network
The ascending flow is based on the notion that knowledge diffuses equally among cita-tions, with the implication that two works inspired by a third work borrow equally from it, and that one work citing two other works also borrows equally from each of them. How-ever, there should be a notion of proximity between works that would translatehowa work borrows from other works it is citing. Without parsing the whole text of a publication, there is no trivial and unbiased way to evaluate this notion of influence.
Fig. 6Comparative distributions of the ascending flow against:a1-degree (i.e. number of citations
b∞-degree (i.e. number total of generated publications),cdate of publication, anddin blue the outlier detected by the ascending flow
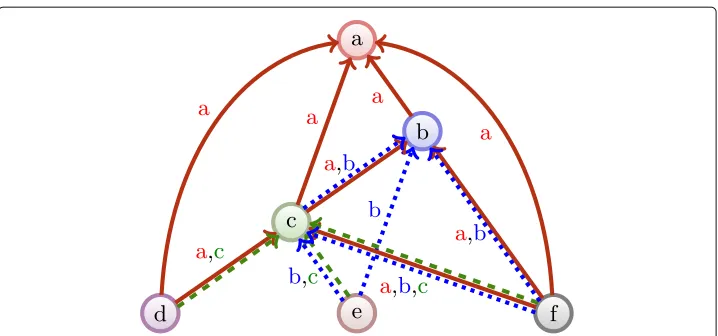
top-level node. If we consider our whole citation network as a unified collection of such subgraphs, we can consider that many layers of interactions induced by different pub-lications overlap over the edges. Such a pattern can be captured through amultiplex formulation of our network (Kivelä et al. 2014). A multiplex networkGcan connect the same two nodesp,qover arcsa(p,q,l)in multiple layersl(see Fig. 12, left).
We present the citation network as a new application case for multiplex network analy-sis. It allows us to formulate a notion of multiplex flows that may be closer to the spirit of the flow of knowledge we want to capture. In addition, it also enables us to ask new types of questions in terms of relative influence of other work within a citation network, as we will illustrate in the following sections.
order to investigate influential works found from our experimental results in “Experimen-tal results” section.
Preliminaries
If we recall our original definition of the citation network (“Preliminaries” section), we consider a citation graphG=(V,E)in which a nodep∈Vrepresents a publication, and arcs(p,q)∈Ewhen an articlepcites an articleq, that is considered a DAG. Each nodep then bears a subgraph induced by all its citing articles.
Figure 8 illustrates the concept introduced below.
Definition 4A citation subgraph Gp=(Vp,Ep)is induced by a node p such that Vp=
p∪N−(p)⊂V , and Ep⊂E is such that,∀(q,r)∈Vp2, ∃a(q,r)∈E.
Let consider, for each publicationp, its induced citation subgraphGp = (Vp,Ep) of
G, the multiplex citation networkG results in combining all individual subgraphs Gp
together.
Definition 5A multiplex networkG=(V,E,L)connects nodes(p,q)on different layers l such that arcs a(p,q,l)∈l∈LEl. A multiplex citation networkG=(V,E,L)is defined
such thatG=pp∈VGp, henceE = p∈V
p EpandL=V .
Note that an arca(p,q,l) exists if and only if both pandq cite l or ifl = q. As a consequence, the multiplex network once “flattened”3, has the exact same topology as the original citation network. The difference lies in the multiple edges.
Definition 6A multiplex connectionα(p,q)between nodes p and q is defined such that α(p,q)=ll∈Lpa(p,q,l), s.a. ∃a(p,q)∈E.
By extension of Definition 4, Gp = (Vp,Ep,Lp) designates the multiplex subgraph
induced by a nodepand its citing articles N−(p). Note that this definition does not restrict layers to those corresponding to nodes ofVp, since we are interested in observing
co-citations.
Definition 7A citation multiplex subgraphGp = (Vp,Ep,Lp)is induced by a node p
Fig. 7Comparison of direct citations of four publications withh-index=6. Thetop nodeis one original publication, and all other nodes its citing nodes.aComparison of the general ascending flows with two extreme values:leftID9204026 (flow=425.4),rightID9201019 (flow=11.2).bComparison of 2−flows with two extreme values:leftID9201079 (2−flow=2.3),rightID9201058 (2−flow=21.6). Relative node size (between couples of pictures) corresponds toh-index values for each node. Node color, frombluetored, corresponds to,aascending flow,b2-flow
The co-citation relationship can also be characterized in the multiplex network. From the definition of our multiplex network, we can consider a node p to belong to different layers L(p), corresponding to the articles they cite, in addition to their own.
If we look at two articles such thatpcitesq, their multiplex connectionα(p,q) corre-sponds to all the citations they have in common, hence the union of all arcs fromptoq existing in all subgraphsGl,l∈L(p,q)⊂V: this corresponds to the co-citations ofpand
Fig. 8Illustration of the citation network from Fig. 1 transformed to a multiplex network, each citation creates its own layer of interaction
Definition 8The set of layersL(p,q)connecting two nodes p,q is defined byL(p,q)= {N+(p)∩N−(q),q}. By extension, we defineL(p)= {
q∈N−(p)L(p,q),p}.
Note that the number of layers of a multiplex connection|L(p,q)| (respectively, the number of layers to which a publication belongs to|L(p)|) corresponds to themultiplexity of a connection (respectively, to themultiplexityof a node) (Podolny and Baron (1997)), i.e. the number of different layers connecting the pair of nodes α(p,q) (respectively connecting all pairs of nodeα(p,q),∀q∈V).
In our multiplex citation network, the notion of neighborhood remains the same as in the monoplex case (Definition 1). However we can refer to a different notion of multiplex degreesδ+(p)andδ−(p)that takes into account the number of arcs connecting a node to its neighborhood.
Definition 9Denote the multiplex out-degree δ+(p) (respectively the multiplex in-degreeδ−(p)) a node p in the multiplex networkG.δ+(p) = |a(p,q,l)|,∀q ∈ V, ∀l ∈
L, s.a.∃a(p,q,l)∈E(respectivelyδ−(p)= |a(q,p,l)|).
The degreesd+(p)andd−(p)still refer to the degree in the monoplex networkG, i.e. the size of the neighborhood (Definition 1). We then introduce the degreesd+l (p)and d−l (p)corresponding to the degree in the subgraphGl, i.e. the number of arc adjacent to
pon the layerl.
Definition 10Denote the layer out-degreeδ+l (p)(respectively the layer in-degreeδ−l (p)) a node p in the subgraphGl.δ+l (p)= |a(p,q,l)|,∀q∈V, s.a.∃a(p,q,l) ∈E(respectively δl−(p)= |a(q,p,l)|).
of measures that can reduce the influence of an article in favor to other co-cited works.
Multiplex extensions of the ascending flow
Since the multiplex formulation of flows in citation networks offers a wide range of possibilities for new measures of influence, we present three measures of flows: two straight-forward extensions of the ascending flow to the multiplex case, and one more elaborated.
Aggregated flow
This is a direct straight-forward extension of the ascending flow (“Ascending flow in cita-tion networks” seccita-tion). We keep the exact same definicita-tion but this time applied in a context with multiple edges.
F(N−(p))=
q∈N−(p) K(kq)
δ+(kq) +λp (6)
Driving this definition is a notion of proximity of sources between two publications: the more they share citations, the closer they can be considered, hence the citing publication is more influenced by the work it is citing. The cited publication will then receive a larger share of the flow gathered by the citing work in comparison to other works marginally cited. One advantage of this view is that, in a developing branch of knowledge, the most recent works sharing many citations with a publication will receive more flow — with the consequence of survey works dispatching more flow to recent works rather than funda-mental works. Similar to “Ascending flow in citation networks” section we setλp=1 the
unit of contribution of one work.
Algorithm 2 shows the algorithm of the aggregated flow is exactly the same as the ascending flow, with the exception of an additional loop among layers (Algorithm 2 line 6). This loop correspond to the fact of going through all the layers of a multiple link between two citations. Computation is illustrated in Fig. 9. As discussed in “Ascending flow in cita-tion networks” seccita-tion, the complexity of Algorithm 2 is(m)wheremis the number of citations. Since the input is a multiplex network, in the worst case the number of links in the networks is equal to the number of nodes (layers) times the number of citations. Thus, the time-complexity of Algorithm 2 is(mn).
Sum flow
This second extension of the ascending flow to a multiplex network consists in combining multiple monoplex versions of the ascending flow. Indeed, as we explain in “Preliminaries” section, for each publication p, we have an induced subgraph Gp, for which we can
compute an ascending flow. With this measure, influential nodes (such as surveys) send individually to each sourcesonlythe flow they directly received through their layer. It would correct the disadvantage of the aggregated flow by introducing some level of fair-ness. Its drawback is that such survey works will receive a boosted flow measure since they have greater chances to belong to many different layers.
Recall the definition of the ascending flow, adapted to a subgraphGl:
FGl(N
−(p))=
q∈N−(p) KGl(kq) d+G
l(kq)
Fig. 9Aggregated flow in a multiplex network, step by step
The sum flow will simply sum ascending flows over all subgraphs composed of one layer, determined for a nodepby:
FG(p)=
l∈L(p)
FGl(N −(p))
λ(p,l)= |Lλ(p
p)|
(8)
If we set the parameterλ(p,l) = 1, the contribution of one publication to the whole system will be exactly its number of citations, and a publication that cites lots of work will produce a lot of flow. In order to maintain constant the unit of contribution of a publication of a work, we setλp = 1 hence ll∈L(p)|L1(p)| = 1 such that a publication
brings exactly 1 unit of contribution to the system.
Algorithm 2:Aggregated flow (multiplex)
input : A citation network with nodes (articles) and arcs (citations) An empty dequeueQ(FIFO)
A functionαinitover the nodes
output: The ascending flow on each node (article) and each arc (citation)
1 Initialize each articlepwith a flow valueλp=λinit(p)(=1by default)
2 Color each arc in white
3 Add all leaves inQ
4 whileQ is not emptydo
5 p←pop_first(Q)
6 foreach q son of pdo
7 foreach layer l∈Lpdo
8 Colora(p,q,l)in blue
9 λq←λq+λp/δ+(p)
10 end
11 ifall incoming arcs of q are bluethen
12 Q←push_last(q)
13 end
14 end
15 end
Selective flow
This last extension attempts to correct both drawbacks of the previously defined flows. It is more restrictive and hybrids both of previous measures: one publication still brings one unit of contribution to the system. Not only flow circulates solely through one layer of interaction, but also the share generated by a layer will be transmitted along this layer.
Similarly to the ascending flow, we suppose that the flow first equally shares from one publication to all citations concerned. Then, within a pair of nodes, we suppose that all citations are equivalent.
Algorithm 3:Sum flow (multiplex)
input : A citation network with nodes (articles) and arcs (citations) output: The sum flow on each node (article) and each arc (citation)
1 Initialize each articlepwith a flow valueλp=0
2 foreach article pdo
3 Construct the citation subgraphGp
4 F←ascending-flow(Gp) with∀q∈Vp,λinit(q)= d+(q1)+1
5 foreach article q∈Vpdo
6 λq←λq+F(q)
7 end
Fig. 10 Illustration of the sum flow: we individually initialize weights to each node, depending on the number of layers each belongs to (including its own). We then compute the ascending flow for each layer (including individual), and sum the obtained weights
FGl(N−(p))=λ(p,l)+
q∈N−(p) KGl(kq)
d+G
l(kq)
FG(p)=
l∈L(p)
FGl(N−(p))
α(p,l)=
j∈N+(p)
λp
d+(p)× |L(p,j)|
(9)
Similarly to the sum flow, we set the unit of contribution of one publication toλp=1,
such that l∈L(p) o∈N+(p)d−(p)×|λpL(p,o)| =1.
The less a cited work shares co-citation, the more it will be rewarded in flow. Contrarily to the aggregated flow, this is designed to increase the flow transmitted from works that brings originality from extra fields.
Algorithm 4:Selective flow (multiplex)
input : A citation network with nodes (articles) and arcs (citations) An empty dequeueQ(FIFO)
output: The selective flow on each node (article) and each arc (citation)
1 Initialize each articlepwith the colorwhiteand the valueλp=1
2 Color all leaves inredand push them intoQ
3 whileQ is not emptydo
4 q←pop_first(Q)
5 foreach r son of qdo
6 ifr is whitethen
7 ConstructGrand initialize allλ(a(q,r,l))to 0
8 push_last(Q,r)
9 Colorrinred
10 end
11 end
12 foreach layer l∈Lqdo
13 Initializeλl,q=0
14 foreach parent p of qdo
15 λl,q←λl,q+λ(a(p,q,l))
16 end
17 foreach son r of qdo
18 λ(a(p,q,l))← d+(q)×(11+|L(q,r)|)+dλ+l,q
l (q)
19 end
20 λq←λq+λl,q
21 end
22 end
Dynamic implementation
Although we presented static algorithms for computing our measure, actual dynamic implementation is much simpler. Similarly to the ascending flow, we consider the construction of our citation graph node by node in order to compute our measures. This means that we only need to compute a series of weights, and propagate them up when updating.
In the case of the ascending flow, we need to propagate in the whole hierarchy each time we add a node. For this reason, we proposed thek-diffuse property to ease the com-putation. The idea is exactly the same with the new measures, although additional details must be taken into account. Since we are using multiplex networks, two implementations are possible: either we take into account each edge colored by its layer individually, or we assign a set of colors (corresponding to layers) to each node and edge.
The aggregated flow propagates exactly the same way as the ascending flow, with the exception of the weighing scheme: there are just a little bit more edges to take into account. The newly added nodepwill propagate toqa weightwagg(p,q) = |L(λpp,q)| and
Fig. 11 The selective flow, step by step. Notice that the weight a node received on one layer is only transmitted this layer only. Only a node’s initial unit is proportionally transmitted to all other layers
For the sum flow, we first assign different weights for each color. The propagation then occurs similarly to the ascending flow. However, we need to compute an ascending prop-agation per each layer this newly added node belongs to (1 per citation). The newly added nodepwill propagate toqfor each co-citationl∈L(p,q)a weightwsum(p,q,l)= 1+δλ+p(q), thenqwill propagate individually on each layerl, following the strategy of the ascending flow withλq,l=wsum(p,q,l).
Finally, the selective flow is similar to the sum flow with a different weighting scheme. The newly added nodepwill propagate toqfor each co-citation l ∈ L(p,q)a weight assigned per each edgewsel(p,q,l)= d+(q)×|λpL(p,q)|, thenqwill propagate individually on each layerl, following the strategy of the ascending flow withλq,l=wsel(p,q,l).
Although we do not propose a study of parameterization — with timely comparisons — here, all flow measures can be constrained similarly to the ascending flow, i.e. we can applyevanescenceork-diffusion to speed up implementation time.
Influence of layers in the multiplex citation network
One very interesting aspect of this approach is that it computes a second net-work, the network of overlapping layers (hereafter referred as the “layer network”, see Fig. 12, right), for which the entanglement measures may be computed. The visualiza-tion of this multiplex network gives interesting insights on how the layers are behaving together in the multiplex network. We use a publicly released online visualization tool4 (Detangler (Renoust et al. 2015)). It offers interaction in the multiplex network allow-ing to identify groups of particular nodes and their associated layers — as well as the other way around, particular groups of layers with their associated nodes (Renoust et al. 2015). Detangler also offers to study many other aspects of the multiplex net-work by changing metrics, taking weights into account, and measuring global cohesion of groups of publications (Renoust et al. 2014). For the sake of simplicity, we will only look at the exploration of the layers in association with citing articles as it already brings insights.
This is particularly useful to investigate a multiplex subgraph Gp induced by a
publication p. For example, the topology of the layer network can indicate sub-groups of citations that tend to be co-cited together. With interaction, we can as well identify a subgroup of publications that tend to co-cite the same subgroup of cita-tions. Since Gp is by definition induced by p, we also expect the publication p to
be the most overlapping publication. However, the co-citing relationships including many additional layers, we can identify other fundamental works that are co-cited in the network.
Experimental results
We follow up on our experiment in “Experimental results” section, and computed values of all new multiplex flows on the arXiv HEP-Th dataset.
Correlations between measures on the whole archive
We compare the Pearsonρand Spearmanrscorrelation coefficients of these measures, as
well with our original ascending flow. Results of the analysis are presented in Table 3 and Fig. 13. The first thing we can notice is that the multiplexity is not correlated to any other measure. By construction of our network, the multiplexity would be highly correlated
Fig. 13 Comparative distribution of ranks and values among:•ascending flow (a,b,c),•aggregated flow (a,d,e),•sum flow (b,d,f),•and selective flow (c,e,f). The plots illustrate the difference between what those statistics are measuring
with the out-degree of a publication (the number of articles cited), since a publication cannot connect through more layers than it is citing. However it has no clear link with its in-degree (its own number of citations).
The second remark is that the original ascending flow and the aggregated flow are very correlated (ρ=0.912). This is of course expected since the definition of the aggregated flow directly extends the ascending flow. Both are actually equivalent when a publication shares exactly the same number of co-citations with all its citing articles. A look at Fig. 13 (a) shows that many cases differ in practice.
Similarly, we can explain the correlation between the selective and sum flows (ρ = 0.946), the selective flow inheriting from the sum flow. What came as a surprise is that both measures actually highly correlate with the number of citations (ρ > 0.95 in both cases). However, our correlation coefficients are not robust (Devlin et al. 1975) and the heavy tailed distribution of our measures render their interpretation difficult (Devlin et al. 1975) (plots in Fig. 13 show that most of the 29+K values are usually tight in a dense group around low values). Nevertheless, if we look at correlations within the subset of h-index=6 publications, the values are widely spread (see Fig. 14a).
Searching for multiple needles in the haystack
Fig. 14 Comparison of sum and selective flows amongaall publication withh-index=6ball publication with #citations = 10.Circled in blueare the publications with the maximum aggregated, selective and sum flows of the subset, corresponding to the graphs shown in figure
591 publications). We can observe in the distributions (Fig. 14b) between our sum and selective flows and theh-index that values widely vary.
To continue our investigation, we can take a look at all publications in this subset having h-index=6. The positions of the nodes with maximum flows show very different cases (identified from the blue circles in Fig. 14b). We put the three works for illustration in Fig. 15 with their information in Table 4.
Exploration of individual induced subgraphs
Fig. 15 The induced subgraphs of the top publication identified by each of the three multiplex flows, in the subset (#citations=10,h-index=6). The size of nodes correspond to their number of citations, the size of edges correspond to their number of co-citations. The color of nodes and edges correspond to the flow measures transiting through each node/edge (a: aggregated,b: sum,c: selective), minimum isblue, maximum isred. In the case of the sum and selective flow, we can notice clear differences between node size and color mapping emphasizing the differences between the flow measures and the #citations
may either form subgroups of layers or be some influent work. Entanglement indices are computed normalized over the whole multiplex network. Relatively high entangle-ment indices are groups of connected layers (in the layer-interaction network) that display higher values than their surrounding.
In the following networks (Figs. 16, 17 and 18), we will present on the left the publi-cation network of citing articles and on the right the layer network of cited articles. The publication networks are laid out with Sugiyama et al.’s algorithm for DAGs (Sugiyama et al. 1981), and the layer network with a force layout (since the relationship is co-occurrence). The size of the publication nodes corresponds to the metric that identified the publication, and the size of the layer nodes corresponds to their entanglement index.
If we look at the subgraph identified by the aggregated flow (ID9503097), we can clearly see two communities of cited articles in the layer network (Fig. 16, right) corresponding to the two separated branches of citing articles (Fig. 16, left). One community of layer nodes is also almost separated in two. One subgroup of layer nodes correspond to a smaller group of three publications, two citing another third. A small investigation on this group of publications actually shows that they all have one author in common (M. Gasperini), and that a fair amount of the corresponding subgroup of cited articles have been also published by this author: this may be a case of excessive self-citations.
Now we can look at the subgraph identified by the sum flow (ID9303050). The topol-ogy of the layer network suggests two intertwined communities. A fair amount of external nodes shows relatively high entanglement index. They are cited by almost all the other
Table 4Information of the most relevant publication and their main influence as discovered with
the different multiplex flows among the (#citations=10,h-index=6) publication subset
Top node Most flow received from
Aggregated Flow ID9503097: Inflation With Variable Omega
ID9802030:Open Inflation Without False Vacua
Sum Flow ID9303050: Conformal Turbulance with Boundary
ID9307091: Solutions of Conformal Turbulence on a Half Plane Selective Flow ID9503097:Infrared regularization of
non-Abelian gauge theories
Fig. 16Detangler (Renoust et al. 2015) view of the subgraph induced by ID9503097 (aggregated flow). On the leftthe citation network (size is the aggregated flow), on therightthe layer network (size is the entanglement index). Nodes are labeled with their authors’ name. We can notice that the layer network splits into two parts, the rightmost part forming another subnetwork. A subgroup of nodes consistently shows one same author. Selection from highlights the citing article. Two articles citing a third one: all include the the same author
nodes (from selection of those nodes). From the publication network, three other publica-tions show relatively high value of sum flow. A little inspection shows us that those three are from the same authors (M. Rahimitabar and S. Rouhani). From selection, we can see they co-cite mainly four publications (bigger highlighted nodes on the right in Fig. 17), but this time among these there is only one self-citation!
Finally, we can investigate the subgraph identified by the selective flow. The layer net-work shows a very different topology: it is almost one big connected clique. All the major layer nodes correspond to citing publications nodes. Additional layer nodes almost always connect only one pair of publications each. Manual inspection does not show dominant
Fig. 18 Detangler (Renoust et al. 2015) view of the subgraph induced by ID9509084 (selective flow). On the leftthe citation network (size is the selective flow), on therightthe layer network (size is the entanglement index). Nodes are labeled with article titles. One citing article displays a very high selective flow, however the original publication (on top) bears a much lower value. We select both to highlight their co-citations and only the original publication pops out: the influence of this work must come from many other publications
authors or much self citation in this group, it is actually very well balanced. One citing publication node pops out as it displays a very high flow value. We could suspect that this node is the reason this subgraph was detected in the first place. However, we know from Fig. 18 that most of the top node’s flow does not come from this citing article. Indeed, if we select this node and its citing node, only the citing node’s layer is displayed: the top publication will only receive from this node the share of citation that corresponds to its layer. The citing article must have received influence from many other works.
We inspected the network, and it appears overall flawless: no major work is often co-cited with the top publication; no other citing article brings an imbalanced larger share of flow to the publication; no dominant authors and no excessive self-citation.
Discussion and conclusion
On the notion of flow in citation networks
the more influential it will become.
The interpretation of flow we propose is much more flexible than theh-index, and can fairly support a wide range of parameters to conduct further experiments (such as addi-tional weights, edge filtering, depth of influence, etc.). More than a metric, when studying the influence of a work (or a collection of works), we argue that the structure of the flow of knowledge it produces, i.e. the DAG generated by a publication and its citations should be taken into account.
On the multiplex interpretation of the citation network
We also proposed to extend this model to a multiplex view of the citation network such as the edges bear the additional information of co-citations. The ascending flow fits well in this new model, and we could define three original flows. Although those interpretations of the flow are not independent of previous metrics, use cases show that it brings finer details, all things being equal. One important direction of future works would be a better study of the design space offered for other measures. We have chosen three interpretations of multiplex flow for our application case, but we will need to study their limits, dynamic/static implementation characteristics, and proper-ties so we can better control and implement them. Implementation of the multiplex measure is a naive extension of the monoplex version, but we surely have room for optimization.
This multiplex view of the network would support many extensions to better fit the idea of knowledge diffusion, and from publication analysis, we could find the number of references to each citation within an article and use it to weight our individual interaction. Text analysis is also another direction that could bring topical proximity to even better refine the networks (as well demonstrated by Dong et al. (2012)).
Conclusion
We have introduced the notion of flow in citation networks, proposed a measure the ascending flow, discussed its implementation and experimented with it in the arXiv HEP-Th dataset. This notion of flow allowed us to propose the new approach of the citation network as a multiplex DAG for which we offered three measures — the aggre-gated, sum and selective flows — with implementation and experiments on the same dataset. We also leveraged visualization to explore our results and discovered interesting insights.
Although our study does not hold for an evaluation for which a comparison with many other metrics and regression will be necessary, we still have set and validated the basis of our framework. Not being high-energy theoretical physicists ourselves, it remains somewhat difficult to directly interpret the results, nonetheless exploration of our results showed interesting insights.
It will be important in the future to carefully curate controlled datasets for which we can expect results and apply former validation. As such, it would be interesting to examine the insights we could extract from a citation network inherited from all publications of a conference venue; to explore neighborhoods of important works such as surveys; to suggest new relevant works from a set of publications; or to analyze the genesis of two merging domains.
We wish to extend our study to other databases, such as DBLP or web of science, and bring the analysis to the authors themselves — although ambiguity in author names is quite challenging. It will be interesting to observe the influence of Nobel prizes for example, find their most influent work and their own influence.
Finally, this framework is not limited to citation networks, but can apply to many other type of transferred information: among our future works is the application to the analysis of news documents. Indeed, DAGs also apply to the study of closely related documents — even if there is no citation relationship, the time dependency between closely related doc-uments can maintain the DAG assumption. It could be an interesting way to find the sources of information, and characterize the impact of news events.
Endnotes
1Available at: http://snap.stanford.edu/data/cit-HepTh.html.
2The Coupling of Yang-Mills to Extended Objects(Dixon et al. 1992), by Dixon, Duff
and Sezgin published on arXiv in 1992. And it has well deserved another citation!
3By “flattening”, we mean the process of projecting the multiplex network such that
one edge only is shared between two nodes in order to obtain a monoplex version of the multiplex network.
4https://github.com/renoust/Detangler/tree/demo.
Funding
This work was supported by JST-ERATO Grant Number JPMJER1201, Japan. This study does not express the view of these institutions in the design of the study and collection, analysis, and interpretation of data.
Availability of data and materials
Polytechnique from 2013 to 2016, specializing in CS, and visited the National Institute of Informatics (NII), Japan, from April 2016 to August 2016. His research interests include graph theory and computer vision.
Competing interests
The authors declare that they have no competing interests.
Publisher’s Note
Springer Nature remains neutral with regard to jurisdictional claims in published maps and institutional affiliations.
Author details
1National Institute of Informatics, Tokyo, Japan.2JST-ERATO Kawarabayashi Large Graph project, Tokyo, Japan. 3Japanese-French Laboratory for Informatics CNRS UMI 3527, Tokyo, Japan.4University of California Berkeley, Berkeley,
USA.
Received: 17 March 2017 Accepted: 23 May 2017
References
Alkemade F, Castaldi C (2005) Strategies for the diffusion of innovations on social networks. Comput Econ 25(1–2):3–23 Assad AA (1978) Multicommodity network flows—a survey. Networks 8(1):37–91
Auber D (2002) Using strahler numbers for real time visual exploration of huge graphs. In: International Conference on Computer Vision and Graphics, vol. 10:1-3. Vaclav Skala Union Agency, Pilsen. pp 56–69. http://wscg.zcu.cz/JWSCG/ and http://www.issn.cc/1213-6972
Batagelj V (2003) Efficient algorithms for citation network analysis. CoRR cs.DL/0309023. http://arxiv.org/abs/cs.DL/ 0309023
Berlingerio M, Coscia M, Giannotti F, Monreale A, Pedreschi D (2013) Multidimensional networks: foundations of structural analysis. World Wide Web 16(5–6):567–593
Boccaletti S, Bianconi G, Criado R, Del Genio CI, Gómez-Gardenes J, Romance M, Sendina-Nadal I, Wang Z, Zanin M (2014) The structure and dynamics of multilayer networks. Phys Rep 544(1):1–122
Boden B, Günnemann S, Hoffmann H, Seidl T (2012) Mining coherent subgraphs in multi-layer graphs with edge labels. In: Proceedings of the 18th ACM SIGKDD International Conference on Knowledge Mining. ACM, New York. pp 1258–1266. http://doi.acm.org/10.1145/2339530.2339726
Bornmann L, Daniel H (2008) What do citation counts measure? A review of studies on citing behavior. J Doc 64(1):45–80 Bucur O, Almasan A, Zubarev R, et al. (2015) An updated h-index measures both the primary and total scientific output of
a researcher. Discoveries 3(3):e50
Cattuto C, Quaggiotto M, Panisson A, Averbuch A (2013) Time-varying Social Networks in a Graph Database: A Neo4J Use Case. In: First International Workshop on Graph Data Management Experiences and Systems, GRADES ’13. ACM, New York. pp 11:1–11:6. doi:10.1145/2484425.2484442, http://doi.acm.org/10.1145/2484425.2484442
Chen P, Redner S (2010) Community structure of the physical review citation network. J Inform 4(3):278–290 Cointet J, Roth C (2007) How realistic should knowledge diffusion models be? J Artif Soc Soc Simul 10(3):5
Cowan R, Jonard N (2001) Knowledge Creation, Knowledge Diffusion and Network Structure. In: Kirman A, Zimmermann J (eds). Economics with Heterogeneous Interacting Agents. Springer Berlin Heidelberg, Berlin. pp 327–343. doi:10.1007/978-3-642-56472-7_20, http://dx.doi.org/10.1007/978-3-642-56472-7_20
Cowan R, Jonard N (2004) Network structure and the diffusion of knowledge. J Econ Dynam Control 28(8):1557–1575 De Domenico M, Lancichinetti A, Arenas A, Rosvall M (2015) Identifying modular flows on multilayer networks reveals
highly overlapping organization in interconnected systems. Phys Rev X 5(1):011027
Delest M, Don A, Benois-Pineau J (2006) Dag-based visual interfaces for navigation in indexed video content. Multimedia Tools Appl 31(1):51–72
Devlin SJ, Gnanadesikan R, Kettenring JR (1975) Robust estimation and outlier detection with correlation coefficients. Biometrika 62(3):531–545
Dixon J, Duff MJ, Sezgin E (1992) The coupling of yang-mills to extended objects. Phys Lett B 279(3–4):265–271 Dong X, Frossard P, Vandergheynst P, Nefedov N (2012) Clustering with multi-layer graphs: A spectral perspective. IEEE
Trans Signal Process 60(11):5820–5831
Ernst D, Kim L (2002) Global production networks, knowledge diffusion, and local capability formation. Res Pol 31(8):1417–1429
Estrada E, Gómez-Gardeñes J (2014) Communicability reveals a transition to coordinated behavior in multiplex networks. Phys Rev E 89(4):042819
Flajolet P, Raoult JC, Vuillemin J (1979) The number of registers required for evaluating arithmetic expressions. Theor Comput Sci 9(1):99–125
Gehrke J, Ginsparg P, Kleinberg J (2003) Overview of the 2003 kdd cup. ACM SIGKDD Explor Newsl 5(2):149–151 Gibbons M, Johnston R (1974) The roles of science in technological innovation. Res Pol 3(3):220–242
Gibbons M, Limoges C, Nowotny H, Schwartzman S, Scott P, Trow M (1994) The New Production of Knowledge: The Dynamics of Science and Research in Contemporary Societies. Sage, 2455 Teller Road, Thousand Oaks, CA 91320 Gomez S, Diaz-Guilera A, Gomez-Gardenes J, Perez-Vicente CJ, Moreno Y, Arenas A (2013) Diffusion dynamics on
multiplex networks. Phys Rev Lett 110(2):028701
Herman I, Marshall MS, Melançon G, Duke DJ, Delest M, Domenger J-P (1999) Skeletal Images as Visual Cues in Graph Visualization. In: Gröller E, Löffelmann H, Ribarsky W (eds). Data Visualization ’99: Proceedings of the Joint EUROGRAPHICS and IEEE TCVG Symposium on Visualization. Springer Vienna, Vienna. pp 13–22. doi:10.1007/978-3-7091-6803-5_2, http://dx.doi.org/10.1007/978-3-7091-6803-5_2
Hirsch JE (2005) An index to quantify an individual’s scientific research output. Proc Nat Acad Sci USA 102(46):16569–16572
Hirsch, JE (2010) An index to quantify an individual’s scientific research output that takes into account the effect of multiple coauthorship. Scientometrics 85(3):741–754
Hummon NP, Dereian P (1989) Connectivity in a citation network: The development of dna theory. Soc Netw 11(1):39–63 Kivelä M, Arenas A, Barthelemy M, Gleeson JP, Moreno Y, Porter MA (2014) Multilayer networks. J Complex Netw
2(3):203–271
Liu JS, Lu LY (2012) An integrated approach for main path analysis: Development of the hirsch index as an example. J Am Soc Inform Sci Technol 63(3):528–542
Mueller M, Bogner K, Buchmann T, Kudic M (2015) Simulating knowledge diffusion in four structurally distinct networks: An agent-based simulation model. Universität Hohenheim, Fakultät Wirtschafts- und Sozialwissenschaften, Stuttgart. http://hdl.handle.net/10419/112745
Pendlebury DA (2009) The use and misuse of journal metrics and other citation indicators. Archivum immunologiae et therapiae experimentalis 57(1):1–11
Podolny JM, Baron JN (1997) Resources and relationships: Social networks and mobility in the workplace. Am Soc Rev 65(5):673–693
Pósfai M, Gao J, Cornelius SP, Barabási AL, D’Souza RM (2016) Controllability of multiplex, multi-time-scale networks. Phys Rev E 94(3):032316
Pujari M, Kanawati R (2015) Link prediction in multiplex networks. NHM 10(1):17–35
Renoust B, Claver V, Baffier J-F (2017) Flows of knowledge in citation networks. In: Cherifi H, Gaito S, Quattrociocchi W, Sala A (eds). Complex Networks & Their Applications V: Proceedings of the 5th International Complex Networks and their Applications (COMPLEX NETWORKS 2016). Springer International Publishing, Cham. pp 159–170. http://dx.doi. org/10.1007/978-3-319-50901-3_13
Renoust B, Melançon G, Munzner T (2015) Detangler: Visual analytics for multiplex networks. Comput Graph Forum 34(3):321–330. http://dx.doi.org/10.1111/cgf.12644
Renoust B, Melançon G, Viaud M-L (2014) Entanglement in Multiplex Networks: Understanding Group Cohesion in Homophily Networks. In: Missaoui R, Sarr I (eds). Social Network Analysis - Community Detection and Evolution. Springer International Publishing, Cham. pp 89–117. doi:10.1007/978-3-319-12188-8_5, http://dx.doi.org/10.1007/ 978-3-319-12188-8_5
Reuters T (2012) The Thomson Reuters Impact Factor. http://thomsonreuters.com/products_services/science/free/ essays/impact_factor/
Solé-Ribalta A, Granell C, Gómez S, Arenas A (2015) Information transfer in community structured multiplex networks. Front Phys 3:61. doi:10.3389/fphy.2015.00061
Speidel L, Takaguchi T, Masuda N (2015) Community detection in directed acyclic graphs. Eur Phys J B 88:203. doi:10.1140/epjb/e2015-60226-y
Strahler AN (1957) Quantitative analysis of watershed geomorphology. Eos, Trans Am Geophys Union 38(6):913–920 Sugiyama K, Tagawa S, Toda M (1981) Methods for visual understanding of hierarchical system structures. IEEE Trans Syst
Man, Cybernet 11(2):109–125
Van Raan AFJ (2004) Measuring science. In: Moed HF, Glänzel W, Schmoch U (eds). Handbook of quantitative science and technology research. Springer, Netherlands. pp 19–50. doi:10.1007/1-4020-2755-9, http://www.springer.com/in/ book/9781402027024
Waltman L (2016) A review of the literature on citation impact indicators. J Informetrics 10(2):365–391 Wuchty S, Jones BF, Uzzi B (2007) The increasing dominance of teams in production of knowledge. Science
316(5827):1036–1039