R E S E A R C H
Open Access
Source camera identification: a distributed
computing approach using Hadoop
Muhammad Faiz
1, Nor Badrul Anuar
1, Ainuddin Wahid Abdul Wahab
1, Shahaboddin Shamshirband
2,3*and Anthony T. Chronopoulos
4,5Abstract
The widespread use of digital images has led to a new challenge in digital image forensics. These images can be used in court as evidence of criminal cases. However, digital images are easily manipulated which brings up the need of a method to verify the authenticity of the image. One of the methods is by identifying the source camera. In spite of that, it takes a large amount of time to be completed by using traditional desktop computers. To tackle the problem, we aim to increase the performance of the process by implementing it in a distributed computing environment. We evaluate the camera identification process using conditional probability features and Apache Hadoop. The evaluation process used 6000 images from six different mobile phones of the different models and classified them using Apache Mahout, a scalable machine learning tool which runs on Hadoop. We ran the source camera identification process in a cluster of up to 19 computing nodes. The experimental results demonstrate exponential decrease in processing times and slight decrease in accuracies as the processes are distributed across the cluster. Our prediction accuracies are recorded between 85 to 95% across varying number of mappers.
Keywords:Source camera identification, Distributed computing, Hadoop, Mahout
Introduction
As we live in an era of high technology, digital images are commonly used due to the availability of various models of digital cameras. Each day, more and more digital cameras are invented by technology companies. Consequently, digital cameras have become more afford-able for the consumers to own. Mobile phones are now equipped with digital cameras. This has further in-creased the number of individuals owning image captur-ing devices. As a consequence, thousands of images are being created each day with some of them capturing a critical moment in time such as a crime. These images can be used in court as evidence to demonstrate the re-lationship between the suspects and criminals [18]. However, a major issue in using digital images as evidence in court is that digital images are easily created and manipulated without leaving any obvious traces of modifications. Evidence manipulation causes the credibility
and authenticity of the digital image to be questioned [12]. Therefore, we need more tools and applications to address the problem of verifying the authenticity of an image [12, 18].
Image authenticity is able to be verified through vari-ous methods ranging from a simpler method like com-paring the EXIF metadata method to a complex method like tracing the digital fingerprints of the image. The lat-ter seems to be more reliable and has attracted a grow-ing interest among researchers in image forensics [16]. The digital fingerprints of an image provide distinguish-ing characteristics of the image. Therefore, the forensic analyzer is able to track the possible source camera of the image under investigation whether it is acquired by the device that it is claimed to be sensed with. Source camera identification has been the focus of recent re-search with various techniques being investigated [14].
There are a number of approaches in source camera identification which are divided into two main categor-ies: hardware and software-related [3, 9–11]. The hardware-related approach is caused by defects in the lens of the camera or any flaws in the device’s sensors. In addition, hardware-related is further divided into two * Correspondence:[email protected]
2
Department for Management of Science and Technology Development, Ton Duc Thang University, Ho Chi Minh City, Vietnam
3Faculty of Information Technology, Ton Duc Thang University, Ho Chi Minh
City, Vietnam
Full list of author information is available at the end of the article
sub-categories which are the optics and sensors. The software-related approach comprises image-related statistics and camera processing. Statistical category con-siders factors such as higher order statistics and condi-tional probability, while the processing category consists of image processing tasks like the CFA configuration and colour interpolation. For example, McKay et al. [10] used CFA interpolation coefficients and noise features in identifying the source camera of the image which ob-tained an average accuracy of 93.75%. Kharrazi et al. [9] achieved 98.73% accuracy by using statistical features (average pixel values, wavelet domain statistics). Bayram et al. [3] successfully used CFA interpolation coefficient but implemented it on different sizes of interpolation kernel. Hu et al. [8] compared the most common fea-tures used in source camera identification and obtained 92% accuracy when combining all compared features. However, the aforementioned works extracted a high number of features on large data sets which affected the total processing time. Wahab and Bateman [17] used conditional probability features and obtained an accuracy of 92.5% by using only 27 features. In spite of that, process-ing time remains an issue and a few works [13, 19, 21] addressed the problem by implementing image processing in a distributed computing environment.
A distributed computing environment enables multiple remote computers connected through a network to perform a specific task concurrently. As a result, the processing capacity of the computers is combined and hence significantly reduces the processing time com-pared to running the task on a single computer. The processing time is reduced because complex tasks and operations can be broken into smaller tasks that can be executed on different computers in parallel. Han et al. [7] implemented a prototype in the field of life sciences to demonstrate the linear-speedups achieved with the in-creasing number of distributed computing nodes. They highlighted two ways to fully utilize distributed comput-ing in image processcomput-ing which are task and data parallel-ism. Zhang et al. [20] achieved 91% time saving by implementing image processing in distributed comput-ing uscomput-ing Hadoop.
Hadoop is a popular open source distributed comput-ing platform under the Apache Software Foundation. It is a framework that allows for the distributed processing of large data sets across clusters of computers using a simple programming model (2014a). MapReduce is the programming model that enables massive scalability across Hadoop clusters. It is a Java based framework which breaks a job into two separate parts: map and reduce. The map function breaks down individual ele-ments into key-value pairs which are then reduced into a single value through the reduce function. MapReduce easily parallelizes the image processing across multiple
computing nodes with the help of another Hadoop mod-ule, Hadoop YARN. It schedules all the jobs and man-ages the Hadoop cluster.
This paper investigates the effect of executing source camera identification in a distributed computing envir-onment by using Hadoop. We aim to evaluate the per-formance of the source camera identification on Hadoop in terms of execution time. This includes image feature extraction and classification using Apache Mahout. We also evaluate the accuracy of Random Forest classifier across different number of mappers in the Hadoop clus-ter. Finally, we analyze the trade-off between the per-formance of the image classification and the distributed computing environment.
The contributions of this paper are summarized as follows:
1. We proposed and developed a source camera identification tool that runs the entire identification process on Hadoop. It is a significant contribution because it addressed the limitation in the study by [4] which did not implement the machine learning phase as a distributed process.
2. The results achieved through the study showed that implementing source camera identification in a distributed computing managed to reduce the overall execution time. It took just 28 min to complete the process involving 6000 images that hold a total size of 20GB on a 19-node Hadoop cluster. As a comparison, a traditional single node computing took 2 h and 42 min to complete the same process.
3. This study scored high classification accuracies even as the number of mappers are varied. We recorded 95% prediction accuracy on a single mapper. On the lower end, we obtained 85% accuracy when the number of mappers are increased to 10. Besides that, our Hadoop cluster reached full utilization during the identification process.
4. We presented a comprehensive evaluation of the conditional probability features for source camera identification.
Finally, Section 5 presents the concluding remarks of the paper.
Related work
Image authenticity is important when images are to be used as evidence in legal cases. Law enforcers are re-quired to prove to the court that the presented images have not being altered in any way. One of the simplest methods to verify image authenticity is through the use of metadata [1]. A metadata is a piece of information that describes other data. For instance, a metadata for a text file may contain the date and time the document was created. Digital images may also contain metadata through the Extended File Information header (EXIF). An EXIF header holds the information about the device that captured the image. It is useful to law enforcers when proving the authenticity of an image in court as they can determine whether the image is modified. However, EXIF headers are less reliable because it can be missing if the image’s file format is changed. The information in the EXIF header is easily editable through software like Exif-Tool [16]. The emergence of image manipulating software like ExifTool forces researchers to find more reliable ap-proaches in verifying image authenticity. One approach is through source camera identification.
Source camera identification is the process to trace the original device which had produced a particular image. Kharazzi et al. [9] highlighted the fact that each image capturing device has its own unique characteristics. These unique features are extracted to classify the recov-ered image according to its source camera. However, a large number of features and collections of image are re-quired to build the classifier. For example, Kharazzi et al. used 34 features which included average pixel value, RGB pairs correlation and wavelet domain statistics. Their image data set had 300 images with 40% of the data set serving as the training set. Similar features were used in [14] but only 150 images were included in their data set, half of the number used in [9]. They achieved 98.94% accuracy, improving 0.21% compared to [9]. A combination of features also presented reasonable result of 92% accuracy in Hu et al. [8] that proposed a combin-ation of five of the most common features used in source camera identification: wavelet features, colour features, image quality matrix (IQM), statistical features of different images and statistical features of prediction errors. The total number of features used was 102 with 300 images in their data set. A new method in source camera identification is proposed in [17] where condi-tional probability features are used to detect the source of an image. An improvement in the size of features is achieved with only 27 features extracted from 400 im-ages. The study managed to achieve 92.5% accuracy. It is clearly observed that the large number of features and
size of data set presents an issue where the processing time taken is high [21]. To address this problem, distrib-uted computing is used to perform the image processing.
Distributed computing is an alternative to improve the performance and processing time of an application. By distributing the workload among multiple connected computers, a process is executed in parallel thus redu-cing the completion time. Han et al. [7] demonstrated that implementing image processing in distributed computing environment reduced the execution time and achieved linear-speedups with increasing number of computing nodes. They focused on two ways to make use of distributed computing: data parallel and task par-allel pipeline streaming. Data parpar-allel pipelining stream-ing applies when the input of a process is not dependent on any other factors, the particular process is able to be distributed into multiple computing resources and executed in parallel. For example, in source camera identification, the feature extraction process is spread to different computing nodes and run in parallel. As a re-sult, it reduces the execution time taken for extracting the features from the images. On the other hand, task parallel pipeline streaming applies when different pairs of nodes are running on a different line in a workflow. As the output of one pair of nodes never reaches the other pairs, these nodes can be implemented in uted computing. A very easy approach to apply distrib-uted computing is by using Hadoop [4, 13].
Few works have been published on large scale source camera identification particularly on distributed computing such as [4, 6]. Miroslav et al. [6] introduced a fast searching algorithm based on ‘fingerprint digests’ to quickly search through a database for a specific fingerprint of a camera which might correspond to the source camera of a given image. They experimented on a database containing over 2000 iPhones with the help of MATLAB software. Al-though the study showed the feasibility of the algorithm, it did not highlight the use of distributed computing to man-age the large dataset. Cattaneo et al. [4] presented a scal-able approach to source camera identification over Hadoop. They used 33 commodity PCs as their Hadoop cluster with 32 of them serving as the slave nodes. They experimented with 20 Nikon D90 digital cameras with 258 JPEG images captured from each camera. Their results re-corded an impressive accuracy of≈99.7% and close to 6 h of execution time.
However, the aforementioned works have similar limita-tion which is that distributed computing is not applied to all the process involved in the identification of the source camera. For instance, in [4], the machine learning phase was not implemented as a distributed process. Instead, they ran their classifier training and testing phase using sequen-tial SVM-based classifier. Therefore, we aim to provide a combination of approaches from the distributed computing perspective, particularly by using Hadoop together with the distributed machine learning algorithms by using WEKA and Mahout to identify the source camera of an image. This study enables source camera identification which is an important branch of image forensics to be done in a more efficient manner and reduce the overall execution time.
Apache mahout
Mahout is an open source machine learning tool developed by Apache. Among the algorithms implemented in Mahout include collaborative filtering, clustering and classification.
Mahout is scalable and it can support massive datasets that are too large to be processed on a single machine. It does not provide any user interface as it is basically a JAVA li-brary. It provides a framework of tools that is to be used or customized by developers. Mahout is an advantage in our work as it is readily developed to run on Hadoop. The clas-sification algorithms are mostly compatible to run on Hadoop’s MapReduce programming framework which en-ables them to be executed as a distributed process.
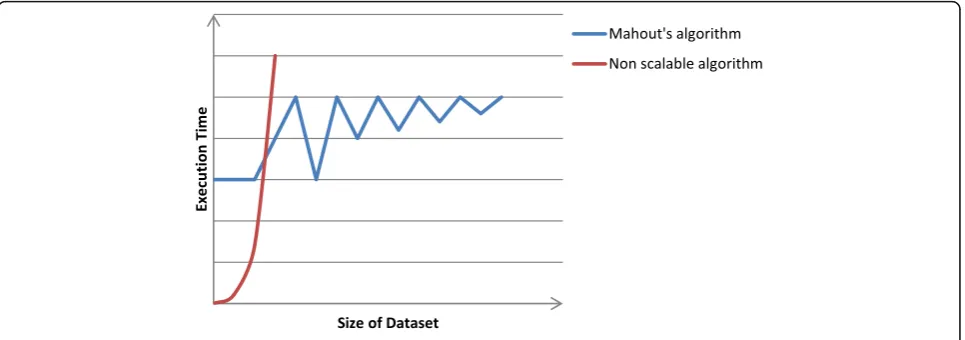
The advantage of Mahout in classifying large datasets starts to show when the size of the training samples gets extremely large [11]. Mahout’s may even perform slower than trad-itional non-Mahout approaches on small datasets because it must overcome overheads for being a distributed approach.
Figure 1 is a conceptual graph which illustrates the ad-vantages that Mahout holds when dealing with large datasets. Based on the graph, when the size of dataset is relatively small, it is sufficient to use traditional or stan-dalone machine learning tool. However, as the size of samples increases, Mahout’s scalable algorithms perform better in terms of execution times [11].
Ericson and Pallickara [5] implemented Mahout’s classifica-tion algorithm in their work to compare the difference in pro-cessing time when executing on Hadoop and Granules. They have used two classifier algorithms in their comparison: Naïve Bayes and Complementary Bayes. Their study showed the re-liability and scalability of Mahout in handling large datasets.
Methodology
To evaluate the performance of the source camera identifi-cation process in distributed environments, Apache Hadoop was used as the distributed computing platform. Hadoop cluster was set up using Amazon Elastic Map Reduce (EMR). EMR is chosen in this study due to resource con-strain. By using EMR, we can easily build a cluster of up to 19 nodes in a few minutes. In order to explain the experi-mental setup in greater detail, the section is divided into
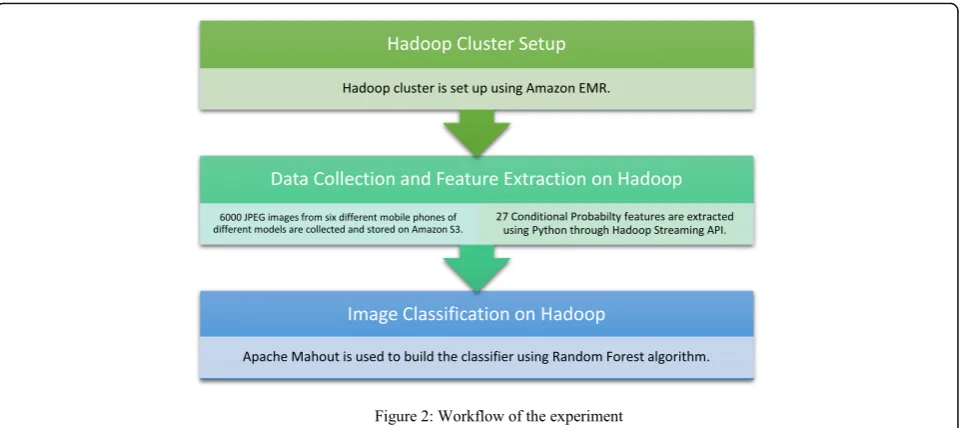
three subsections: Apache Hadoop cluster setup, data collec-tion and image processing and finally the classificacollec-tion. The first subsection discusses the experimental setup of Apache Hadoop cluster in detail. The data collection phase and the implementation of image feature extraction in Hadoop are presented in the second subsection while the final subsec-tion presents the classificasubsec-tion process using Apache Ma-hout. The workflow of the study is depicted in Fig. 2.
Apache Hadoop experimental setup
The HDFS has two main elements which are the NameNode and DataNode. A NameNode is usually assigned to a single machine with the highest capacity resources. It acts as the central point of Hadoop distrib-uted system. It manages the file system and records on which node the file data is stored. The DataNode is re-sponsible for data storage. A Hadoop cluster consists of multiple DataNodes spread among the cluster and data are replicated across them.In this study, Amazon EMR is used to build the Hadoop cluster. It allows us to easily scale the cluster to fit our needs. We started the experi-ment by building a 5-node Hadoop cluster before grad-ually increasing the nodes until we obtained a 19-node
cluster. The Hadoop cluster configurations are shown in the following table: (Tables 1 and 2).
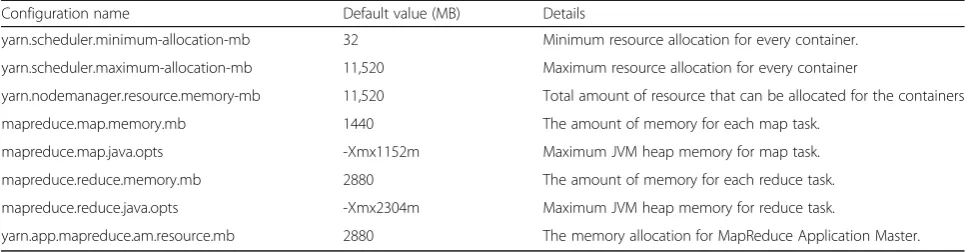
The EMR Hadoop cluster maintained the default mem-ory configurations because the instances used were suffi-ciently large in terms of resources. Table 3 shows the default configuration of the cluster. However, our experi-ments altered the default number of maps and reduces through the following properties: mapreduce.job.maps and mapreduce.job.reduces.
Table 4 shows a more detailed specification of re-sources on different clusters used in this study. It is worth noting that although each node had 15GB of memory, the total memory in a cluster reserved 3.75GB from each node for the operating system.
Data collection and feature extraction in Hadoop
In the data collection phase, a total of 6000 images were collected from six different mobile phone cameras. All of the mobile phones were from different brands and models: iPhone 4S, iPhone 5S, Sony Xperia C, Sony Xperia Z, Samsung Galaxy Note 3 and Samsung Galaxy Note 4.A total of 1000 images are captured from each mobile phone captured. These images are uploaded into Amazon S3 cloud storage. The total size of the images
Fig. 2Workflow of the experiment
Table 1Cluster hardware configurations
Server No. of
nodes
Type of Hadoop Node
Resources per node
Amazon m3.xlarge instance (Master node)
1 a) NameNode a) 15GB RAM
b) 80GB SSD storage c) 8 vCores Amazon m3.xlarge instance
(Core nodes)
5–19 a) DataNode
Table 2Cluster software configurations
Name Version
Amazon Linux AMI 2017.03.0
Java 1.7.0_55
Apache Hadoop 2.6.0
reached 20 GB where the average size of each image was 3.4 MB. A Python script is written to extract the conditional probability features using the MapReduce framework. Although Hadoop is known to accept Java MapReduce codes, it also provides a streaming API that accepts other programming languages such as Python. We carried out multiple rounds of feature extraction each being in a cluster of different number of nodes. We strictly enforced that each image would be assigned a single map process and no reduce process was involved by configuring two Hadoop’s properties as follows: mapreduce.job.maps and mapreduce.jobs.reduces.
Besides that, Python’s Pillow library is used to carry out image processing such as pixel manipulation in this study. Pillow is an actively maintained fork of Python Imaging Library (PIL). It provides various functions to read and manipulate images. All 6000 images are read into their respective 3D RGB pixel array.Then, they are converted into 2D grayscale pixel array to allow 2D DCT to be applied. We discuss conditional probability features in more details in the following subsection.
Conditional probability features
The conditional probability feature set was initially pro-posed in [15] based on JPEG coefficient values for image steganalysis. Wahab and Bateman [17] used CP features to identify the source camera of an image among four different iPhone cameras. They managed to achieve 92.5% accuracy with 27 extracted features. The CP features capture software-related artifacts generated from the absolute values of the three selected block wise DCT coefficients during JPEG compression. Manufacturers
normally configure their devices differently to balance compression and quality to their own tastes and needs. This variation in the JPEG quantization table can be used to identify the source of the image. In spite of that, al-though it is expected that cameras of the same make and model utilize similar quantization table during JPEG compression, in previous studies CP features achieved substantial performance for individual camera device identification. This means the proposed feature extraction method allows to develop intrinsic camera device finger-print with relatively small size as well as small intra-model similarity that is ideal to differentiate among camera de-vices of even the same model. The feasibility of CP fea-tures on individual camera device identification could be explained based on the related study in [2]. The method proposed statistical process control (SPC) as a tool for identifying anomalies in the image acquisition process of the digital camera. In this study, X-Moving Range and Ex-ponentially Weighted Moving Average (EWMA) control charts are used to highlight the variation for a subset of the devices, in order to determine a suitable fingerprint for matching a device to its source. Hence, it is possible to assume that the CP features capture anomalies in the JPEG compression process corresponding to individual camera devices.
The CP features are computed as follows: (i) using the DCT transform, the three DCT coefficients were se-lected from the 4 × 4 left upper sub-block, in view of the fact that the most non-zero coefficients are located in that region; (ii) the method illustrated three possible arrangements (horizontal, vertical and diagonal) of the three selected DCT coefficients in 4 × 4 sub-block. Figure 3 shows the different orientations of the three DCT coefficients; (iii) based on the concept of condi-tional probability, the image features were extracted by evaluating the absolute values of three selected block-wise DCT coefficients p, q and r in horizontal, vertical and diagonal directions; (iv) for every selected p, q and r, three preconditions with respect to event A and three probabilities corresponding to event B were considered as follows,
Table 3Hadoop cluster memory configurations
Configuration name Default value (MB) Details
yarn.scheduler.minimum-allocation-mb 32 Minimum resource allocation for every container.
yarn.scheduler.maximum-allocation-mb 11,520 Maximum resource allocation for every container
yarn.nodemanager.resource.memory-mb 11,520 Total amount of resource that can be allocated for the containers
mapreduce.map.memory.mb 1440 The amount of memory for each map task.
mapreduce.map.java.opts -Xmx1152m Maximum JVM heap memory for map task.
mapreduce.reduce.memory.mb 2880 The amount of memory for each reduce task.
mapreduce.reduce.java.opts -Xmx2304m Maximum JVM heap memory for reduce task.
yarn.app.mapreduce.am.resource.mb 2880 The memory allocation for MapReduce Application Master.
Table 4Cluster resources
No of nodes in cluster
Total memory (GB)
Total vCores
Total containers
5 nodes 56.25 40 40
10 nodes 112.50 80 80
15 nodes 168.75 120 120
A1:p<q;A2:p>q;A3:p¼q ð1Þ
B1:r<q;B2:r>q;B3:r¼q ð2Þ
and, finally (v) the algorithm merged the event A and B corresponding to a total of nine CP features. Thus, a total of 9 × 3 = 27 CP features were computed for three different orientations.
Image classification
We obtained 6000 feature files from the feature extraction process. Then, we ran a Python script to convert and ap-pend all the feature files into a single comma delimited (CSV) file to matchApache Mahout’s input format. We reduced the number of computing nodes to 3 and only varied the number of mappers during the classification process. The classification process implemented Mahout’s Random Forest algorithm used the following default options:
i) Number of trees to be generated,I= 100 ii) Number of attributes to be used in random
selection,K= 15
The number of random features to be selected,K, dur-ing the build process is selected usdur-ing cross validation parameter selection. We have tested a range of numbers and identified 15 as the selection that gave the best re-sults. The performance of the algorithms are evaluated using 10-fold cross validation method.The crossvalida-tion method divides the extracted features into ten equal sets. Each set is further divided into two groups: 90% training set and 10% testing set. Then, it builds classifier models for each set before averaging the performance of all the classifiers. Cross validation produces a more reli-able result as it uses a unique split when evaluating the performance of the classifier. We repeated the classifica-tion process using 1,3,5,7 and 10 mappers to observe the performance of the model.
Results and discussion
In this paper, a distributed computing cluster was built using Amazon EMR Hadoop. Multiple clusters with up to
19 nodes were used to demonstrate the effect of imple-menting source camera identification process in distributed computing. The execution times obtained on different clusters are compared to a single node standard computer having the same technical specifications. Table 5 shows the experimental results.
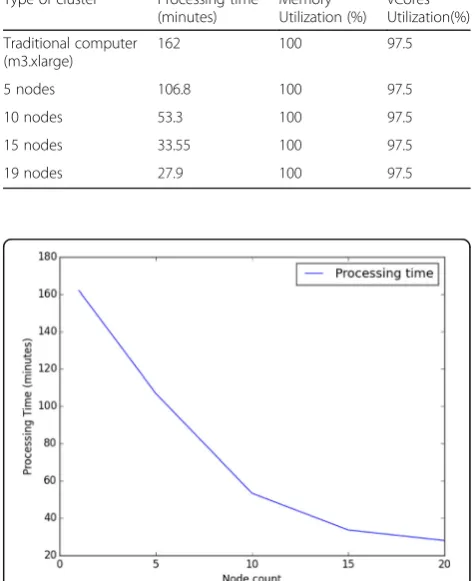
An exponential decrease in processing times are re-corded. A single node computer took nearly 3 h to complete the source camera identification process. The process included feature extraction of 6000 images and classification.When the same process is run on a 5-node cluster, we observed 34% improvement in processing time. A similar pattern followed when 10, 15 and 19 nodes are used. We achieved 83% decrease when Fig. 3Conditional probability orientations: horizontal, vertical and diagonal
Table 5Processing times of each different clusters
Type of cluster Processing time (minutes)
Memory Utilization (%)
vCores Utilization(%)
Traditional computer (m3.xlarge)
162 100 97.5
5 nodes 106.8 100 97.5
10 nodes 53.3 100 97.5
15 nodes 33.55 100 97.5
19 nodes 27.9 100 97.5
running the process in the 19-node cluster. On the other hand, we achieved full memory utilization during the process. Figure 4 shows the graph of processing times against the number of nodes while Fig. 5 shows a screenshot of the 19-node cluster utilization.
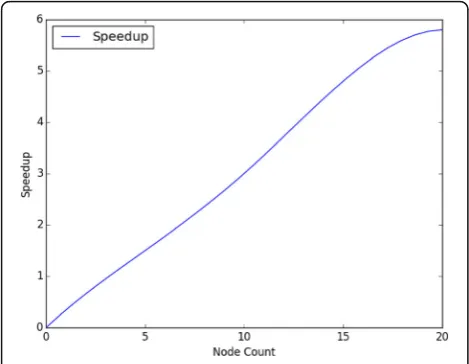
To gauge the performance of the Hadoop cluster fur-ther, the speedup is also chosen as our metric. Speedup is defined as the ratio of the execution time on a single node computer (T1)to the execution time as the num-ber of nodes in the cluster is increased. It is represented by the following equation:
speedup¼T1=Tn ð3Þ
Figure 6 shows the speedup as more computing nodes are added to the cluster. From the graph, it is evident that we obtain an impressive linear speedup. It proves Hadoop’s superiority when dealing with large datasets. We have also noted that even the largest cluster used in this study achieved full utilization. This shows that a larger Hadoop cluster can be used to obtain better per-formance. The claim holds true until the cluster begins to show slower speed up and less utilization. In other words, we would try to increase the size of the cluster until its memory and vCores usage become less than
100%. It indicates that the cluster’s resources have exceeded the demand from the source camera identifica-tion process.
On the other hand, we reduced the cluster’s size dur-ing the classification phase. We used a 3-node cluster to build and test Mahout’s Random Forest classifier on the dataset. As a justification, we have shrunk the cluster to avoid resource wastage as the classification process was less resource intensive. Our findings reveal that the memory and vCores utilization were less than 50% of the total available resource on average. Table 6 shows the resource utilization across different number of mappers.
We achieved good classification accuracies across the cluster. Although we recorded a proportional drop in ac-curacy with every map increase, the precision, recall and F1 score maintained at values close to 1. We present the scores in Table 7 shown below.
The accuracy ranges between 85 to 95% depending on the number of mappers used.
We can observe that we gained 1% in accuracy as we decreased a single mapper. This is due to the fact that as the number of mappers increases, the amount of data processed on each map tasks decreases, leading to smaller trees being produced on each map task, which Fig. 519-node cluster resource utilization
Fig. 6Graph of speedup against number of nodes
Table 6Cluster resource utilization during classification
Number of maps Memory Utilization (%) vCores Utilization (%)
1 12.5 8.3
3 33.3 29
5 41.6 37.5
7 41.6 37.5
10 54 50
Table 7Random Forest classification results
Number of maps Accuracy (%) Precision Recall F1 score
1 95.3 0.954 0.953 0.953
3 92.9 0.932 0.933 0.933
5 90.1 0.906 0.902 0.902
7 87.8 0.885 0.879 0.879
impacted the accuracy of the classifier. However, we also take into consideration the precision, recall and F1 scores of the classifier. Our lowest performing model re-corded 0.862 precision and only a slight drop in recall and F1 score at 0.855 and 0.854 respectively. We con-sider the mas a promising result because they are still in close range to the best score of 1. Figure 7 shows the graph of classifier accuracy against the number of maps.
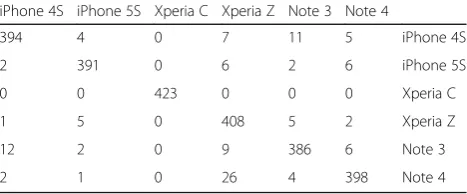
Besides that, it is also important to observe the num-ber of false positives during the classification. This can be done through the confusion matrix. It indicates the performance of the classifier by showing the number of actual and predicted instances. Each column of the matrix corresponds to the predicted class while each row represents the actual class. Confusion matrix pre-sents an easy way for analysis because all correct predic-tions or also known as true positives will lie in the main diagonal of the matrix. Tables 8, 9, 10, 11 and 12 show the confusion matrix for each number of mappers used in this study.
From the confusion matrices above, we can see that Sony Xperia C had the best features because it per-formed very well on all numbers of mappers tested. Among possible reasons would be that the camera for this model was significantly different from all other models in the study. On the other hand, Samsung
Galaxy Note 4 was often misclassified as Sony Xperia Z. In future works, more consideration will be put into re-ducing the number of misclassifications or false positives when classifying in a distributed environment. One pos-sible solution would be fine-tuning Mahout’s hyper pa-rameters so that as the mappers increased, the number of trees grown in each mapper would be well balanced.
Based on the study, we can conclude that the time taken for source camera identification is exponentially reduced when all related processes are implemented in Fig. 7Graph of classifier accuracy against the number of maps
Table 8Confusion matrix for 1 mapper
iPhone 4S iPhone 5S Xperia C Xperia Z Note 3 Note 4
394 4 0 7 11 5 iPhone 4S
2 391 0 6 2 6 iPhone 5S
0 0 423 0 0 0 Xperia C
1 5 0 408 5 2 Xperia Z
12 2 0 9 386 6 Note 3
2 1 0 26 4 398 Note 4
Table 9Confusion matrix for 3 mappers
iPhone 4S iPhone 5S Xperia C Xperia Z Note 3 Note 4
372 13 1 13 14 8 iPhone 4S
3 386 0 8 4 6 iPhone 5S
0 0 423 0 0 0 Xperia C
3 4 0 403 10 1 Xperia Z
10 2 0 18 377 8 Note 3
4 4 0 30 13 380 Note 4
Table 10Confusion matrix for 5 mappers
iPhone 4S iPhone 5S Xperia C Xperia Z Note 3 Note 4
355 17 1 27 12 9 iPhone 4S
3 381 0 15 5 3 iPhone 5S
0 0 418 0 3 2 Xperia C
6 8 0 395 10 2 Xperia Z
11 5 4 17 367 11 Note 3
6 14 0 42 14 355 Note 4
Table 11Confusion matrix for 7 mappers
iPhone 4S iPhone 5S Xperia C Xperia Z Note 3 Note 4
342 22 2 28 18 9 iPhone 4S
6 370 0 19 5 7 iPhone 5S
0 0 421 0 2 0 Xperia C
6 13 4 386 12 0 Xperia Z
9 4 4 29 359 10 Note 3
7 21 0 45 24 334 Note 4
Table 12Confusion matrix for 10 mappers
iPhone 4S iPhone 5S Xperia C Xperia Z Note 3 Note 4
334 29 2 35 12 9 iPhone 4S
9 372 0 15 4 7 iPhone 5S
0 0 419 0 4 0 Xperia C
1 5 0 375 5 2 Xperia Z
11 6 6 38 338 16 Note 3
distributed computing. While proper attention is re-quired to fine-tune the classifier, we showed that the classification accuracies were promising. Besides that, our study also revealed that more resources can be utilized to speed up the processing of datasets having similar size like ours.
Conclusion
As we venture into an era where technology advances at a rapid pace, more attention has to be given in the area of digital security. We have investigated the effect of implementing source camera identification method in a distributed computing environment by using Apache Hadoop. It was done to facilitate a fast and accurate source camera identification process that generally con-sumes a large amount of time. We implemented the process of classifying images based on their source cam-eras on Hadoop to study the difference in execution time as the number of nodeswere increased. A total of 6000 images from sixdifferent mobile phones of different models were collected and undergone the classification process which started with image feature extraction in Hadoop followed by image classification using Apache Mahout’s Random Forest classifier.
In terms of execution times, Hadoop proved to be a reliable distributed computing platform. The execution times recorded in the experiment showed impressive im-provements as the number of nodes increased. We achieved almost a speedup of six when a 19-node cluster was in place compared to a single node computer. In general, we obtained a linear speedup as we added more computing nodes in the cluster. The overall processing times also showed exponential decrease across the clusters. Besides that, all cluster resources were utilized during feature extraction. The results provided a strong evidence that more resources can be put to use to fur-ther shorten the processing times.
In addition, we demonstrated Apache Mahout on Hadoop which is a scalable machine learning tool. We built a predictive model based on Mahout’s Random Forest algorithm. Our results showed high accuracies even as the number of mappers were increased. Al-though it can be argued that a slight loss of accuracy oc-curred in the process, other metrics such as precision, recall and F1 scored showed that the model was reliable. Furthermore, in order to argue that the dependency of the accuracy of the Random Forrest classifier on the number of map processes run was not a result of randomness, a 10-fold cross validation was utilized. Al-though only a single run was provided for each value, yet 10-fold cross validation ran the algorithm for 10 different subsets of the training and testing dataset. As a result, it is plausible to argue that the variation in per-formance of the Random Forrest classifier was due to
the number of map processes run and was not due to randomness.
In the future, we plan to improve in the area of classi-fication accuracies in distributed computing by experi-menting with different types of classifier algorithms. Besides that, we would also like to investigate larger scale resources to observe the capacity of the cluster to handle large datasets. It is also interesting to analyze the model’s performance among mobile phones of the same model. As a conclusion, this study contributes to the advancement in the field of image forensics as image classification is done faster without complicating the accuracy of the classification.
Acknowledgements
This work is funded by the Malaysian Ministry of Education under the University of Malaya High Impact Research Grant UM.C/625/1/HIR/MOE/ FCSIT/17.
Authors’contributions
MF, NBA and AWAW carried out the studies, participated in the sequence alignment and drafted the manuscript. MF, NBA participated in the design of the study, collected the data and performed the statistical analysis. SS and ATC conceived of the study, and participated in its design and coordination and helped to draft the manuscript. All authors read and approved the final manuscript.
Competing interests
The authors declare that they have no competing interests.
Publisher’s Note
Springer Nature remains neutral with regard to jurisdictional claims in published maps and institutional affiliations.
Author details
1Faculty of Computer Science & Information Technology, University of
Malaya, 50603 Kuala Lumpur, Malaysia.2Department for Management of
Science and Technology Development, Ton Duc Thang University, Ho Chi Minh City, Vietnam.3Faculty of Information Technology, Ton Duc Thang University, Ho Chi Minh City, Vietnam.4Department of Computer Science,
University of Texas at San Antonio, San Antonio, TX, USA.5Department of
Computer Science, University of Patras, Patra, Greece.
Received: 6 March 2017 Accepted: 1 August 2017
References
1. Alvarez P (2004) Using extended file information (EXIF) file headers in digital evidence analysis. Int J Digit Evid 2(3):1–5
2. Bateman P, Ho ATS, Woodward A (2010) Accurate detection of out-of-control variations from digital camera devices, Proc. of the IEEE International Symposium on Circuits and Systems, pp 3056–3059
3. Bayram S, Sencar HT, Memon N, Avcibas I (2005) Source camera identification based on CFA interpolation. Proc - Int Conf Image Process ICIP, pp 69–72
4. Cattaneo G, Roscigno G, Petrillo UF (2014) A scalable approach to source camera identification over Hadoop. 2014 IEEE 28th Int Conf Adv Inf Netw Appl :366–373. Available from: http://ieeexplore.ieee.org/lpdocs/epic03/ wrapper.htm?arnumber=6838688
5. Ericson K, Pallickara S (2013) On the performance of high dimensional data clustering and classification algorithms. Futur Gener Comput Syst 29(4): 1024–1034 [cited 2015 Feb 17]. Available from: http://www.sciencedirect. com/science/article/pii/S0167739X12001343
7. Han L, Liew CS, van Hemert J, Atkinson M (2011) A generic parallel processing model for facilitating data mining and integration. Parallel Comput 37(3):157–171 [cited 2015 Mar 3]. Available from: http://www. sciencedirect.com/science/article/pii/S0167819111000202
8. Hu Y, Li C-T, Zhou C (2010) Selecting forensic features for robust source camera identification. Int Comput Symp (ICS) 2010:506–511
9. Kharrazi M, Sencar HT, Memon N (2004) Blind source camera identification. Image process 2004 ICIP‘04 2004 Int conf, pp 709–712
10. McKay C, Swaminathan A, Gou H, Wu M (2008) Image acquisition forensics: forensic analysis to identify imaging source. IEEE Int Conf Acoust Speech Signal Process 2008:1657–1660
11. Owen S, Anil R, Dunning T, Friedman E (2012) Mahout in action. Manning Publications Co., Online Available from: http://www.manning.com/owen/ 12. Piva A (2013) An overview on image forensics. ISRN Signal Process
2013:1–22. Available from: http://dx.doi.org/10.1155/2013/496701 13. Sarade SS, Ghule NB, Disale SP, Sasane SR (2014) Large scale satellite image
processing using Hadoop distributed system. Int J Adv Res Comput Eng Technol 3(3):731–735
14. Tsai M-J, Wu G-H (2006) Using image features to identify camera sources. IEEE Int Conf Acoust Speech Signal Process 2006:297–300
15. Wahab AW, Briffa JA, Schaathun HG, Ho ATS (2009) Conditional probability based Steganalysis for JPEG Steganography, Proc. of the International conference on signal processing systems, pp 205–209
16. Wahab AWA, Ho ATS, Li S. Inter-camera model image source identification with conditional probability features. Proc IIEEJ 3rd image electron Vis Comput work (IEVC 2012). 2012
17. Wahab AWA, Bateman P (2010) Conditional probability based camera identification. Int J Cryptol Res 2(1):63–71.
18. Wen C, Yang K (2006) Image authentication for digital image evidence. Forensic Sci J 5:1–11
19. Yamamoto M, Kaneko K (2012) Parallel image database processing with Mapreduce and performance evaluation in pseudo distributed mode. Int J Electron Commer Stud 3(2):211–228 [cited 2014 Jun 4]. Available from: http://www.academic-journals.org/ojs2/index.php/ijecs/article/view/1092 20. Zhang G, Wu Q, Zhuo Z, Wang X, Lin X (2013) A large-scale images
processing model based on Hadoop platform. ICCC‘13 Proc Second Int Conf Innov Comput Cloud Comput :51–54. Available from: http://dl.acm. org/citation.cfm?id=2556883