DOI 10.1007/s13173-012-0087-1 O R I G I NA L PA P E R
Evaluation of parameters for combining multiple textual sources
of evidence for Web image retrieval using genetic programming
Patrícia Correia Saraiva · João M. B. Cavalcanti · Marcos A. Gonçalves · Katia C. Lage dos Santos · Edleno S. de Moura · Ricardo da S. Torres
Received: 9 January 2012 / Accepted: 16 August 2012 / Published online: 15 September 2012 © The Brazilian Computer Society 2012
Abstract Web image retrieval is a research area that is receiving a lot of attention in the last few years due to the growing availability of images on the Web. Since content-based image retrieval is still considered very difficult and expensive in the Web context, most current large-scale Web image search engines use textual descriptions to represent the content of the Web images. In this paper we present a study about the usage of genetic programming (GP) to address the problem of image retrieval on the World Wide Web by using textual sources of evidence and textual queries. We investi-gate several parameter of choices related to the usage of a framework previously proposed by us. The proposed frame-work uses GP to provide a good solution to combine multiple textual sources of evidence associated with the Web images. Experiments performed using a collection with more than 195,000 images extracted from the Web showed that our
P. C. Saraiva (
B
)·J. M. B. Cavalcanti·E. S. de Moura Institute of Computing, Federal University of Amazonas,Av. Gen. Rodrigo Otávio, 3000, Manaus, AM, CEP 69077-000, Brazil e-mail: [email protected]
J. M. B. Cavalcanti
e-mail: [email protected] E. S. de Moura
e-mail: [email protected] M. A. Gonçalves
Department of Computer Science, Federal University of Minas Gerais, Belo Horizonte, MG, Brazil e-mail: [email protected]
K. C. L. dos Santos
Institute of Engineering of Systems and Information Technology, Federal University of Itajubá, Itajubá, MG, Brazil
e-mail: [email protected] R. da S. Torres
Institute of Computing, Campinas University, Campinas, SP, Brazil e-mail: [email protected]
evolutionary approach outperforms the best baseline we used with gains of 22.36 % in terms of mean average precision.
Keywords Web image retrieval·Genetic programming
1 Introduction
The World Wide Web is undoubtedly the largest public image repository ever created by human society, posing also new challenges and opportunities to the development of new algo-rithms and applications of image search. In addition, the pop-ularization of digital devices such as cameras, cell phones, scanners, and personal computers has also simplified the tasks of producing and publishing images on the Web in the recent years. As a result, the volume of information encoded as images is growing fast, which also raises the importance of Web image retrieval applications. One of the difficulties of image retrieval on the Web comes from the fact that image annotations are inherently noisy and incomplete. Since the Web has granted a low-cost and large-scale accessibility to this material, Web image retrieval became a target of many researchers.
Besides, the process of manually annotating each image in the collection is laborious, time consuming, and expensive.
In CBIR, low-level features (feature vectors) are auto-matically extracted to describe image visual properties like color, texture or shape and used for indexing and searching. For querying, the user provides a query pattern (e.g., a target image or sketch, or a description of image features), which is compared to the feature vectors of the images in the collec-tion. The images are then ranked according to their distance to the user query.
Although both approaches have been applied for image retrieval in general, the choice between TBIR and CBIR must always consider the characteristics of the target application. In the Web scenario for example, the adoption of CBIR tech-niques presents some drawbacks. First, the processing cost of image feature extraction and similarity calculation may affect performance negatively. Second, for an uncontrolled and highly heterogeneous collection such as the Web, it is dif-ficult to decide which image features better represent image visual content, since the usefulness of each feature may vary according to the type of image. Finally, users have to pro-vide a sample image or drawing a sketch that describes their information need, which is not a trivial task.
On the other hand, the text on the Web pages is read-ily available and it can be useful as a source to generate good descriptions of images present on these pages. Further, processing textual terms compared to visual content features is much faster and therefore more suitable for Web applica-tions. As the user query can also be formulated in a textual form to describe the image of interest, it makes this approach a good alternative for Web image retrieval. In fact, current and successful commercial image search engines likeGoogle Image Search1andBing Image2use textual descriptions to represent the images and also use traditional text retrieval techniques to retrieve them. Even when the content-based approach is applied in the Web context, the text of Web pages should not be disregarded, since it often includes some form of human generated descriptions of the images [6].
In this paper, we study the selection of parameters when applying a genetic programming (GP) framework that com-bines multiple textual sources of evidence previously pro-posed by us. We present experiments about the impact of parameters and features in the behavior of the GP-based approach and provide a detailed methodology to apply GP in the context of Web image retrieval. Our framework assumes that text and meta-data present on the Web pages can be used as potential evidence to describe the images on the same pages, and uses the principles of GP to derive good evidence combination functions to improve the effectiveness of Web image retrieval systems.
1http://images.google.com/(as of 10/06/2011). 2http://br.bing.com/(as of 10/06/2011).
In sum, the main contributions of this paper are: (1) a comprehensive discussion about which textual sources of evidence associated with Web images are more important to represent the image content; (2) the use of different textual features as GP terminals, other than simple statistical infor-mation on documents and collection as exploited in previous work [6,15,21]; (3) an study about the impact of GP parame-ters in the results obtained by the evolutionary approach; and (4) a thorough experimental evaluation of the proposed tech-nique in a very large image collection extracted from the Web. This paper is organized as follows. In Sect.2, we discuss some related work. Section3presents a brief overview of GP. Section4 describes our GP-based approach that combines multiple textual sources of evidence to generate good rank-ing functions for Web image retrieval. Sections5and6 dis-cuss the experimental methodology and the results obtained by our evolutionary approach confronted with some base-lines. Finally, Sect.7presents final remarks with directions to future work.
2 Related work
Image retrieval has been extensively studied in the last years with a lot of papers being published in the literature. For instance, Kherfi et al. [13] provide a comprehensive survey on Web image retrieval systems, giving details on the main issues that have to be addressed during their implementation (e.g., how to perform data gathering, visual feature extrac-tion, indexing, retrieving, and performance evaluation).
In [6], some textual sources of evidence related to the images are considered. The authors proposed a novel model based on Bayesian belief networks for Web image retrieval. Experiments were conducted with a reference collection composed of 54,000 images gathered from Web. The results showed that the combination of information derived from text passages with information derived from HTML tags leads to improved retrieval when compared to the results obtained by the use of each source of evidence in isolation. We use this work as one of our baselines.
In [5], is described the architecture of a Web image retrieval system with automatic image annotation techniques. The authors proposed four methodologies to generate auto-matically the annotation for every image, by analyzing the structural blocks, collecting anchor text of link structures, and gathering shared annotation with other images with the same visual signature.
better similarity functions than the ones obtained from the individual descriptors.
Three learning algorithms, CBIR-SVM, CBIR-GP and CBIR-AR, were used in [11] for CBIR to effectively combine multiple image content descriptors in order to improve rank-ing performance. The experiments showed that CBIR-GP and CBIR-AR have similar performance, and both outper-formed CBIR-SVM generating a better image ranking func-tion.
Li and Ma [15] present a novel ranking model named WIRank based on GP to automatically generate an effective ranking function by combining different types of evidence for Web image retrieval. Their GP approach includes textual metadata, visual features, and link structure analysis. Tem-poral information was also used as a new feature to represent the Web images in order to meet the demand by users for the most recent information. Our research work has been devel-oped in the past years in parallel to the one proposed by Li and Ma [15] and presents an extension of a preliminary paper published in [21]. While we also study the usage of GP for image search, in this new article we are particularly inter-ested in studying the application of various different textual features for image search using GP. We present several exper-iments with users that provide further insights and knowledge about this topic.
An experimental search engine3 was presented in [25], which allows multimedia and multilingual queries in a sin-gle search and makes use of the total available information in a multimodal collection. The results from each modality was fused by score normalization (MinMax andZscore, and the non-linear KIACDF) and combination (summation, multipli-cation, and maximum). The experiments showed that fusion methods using multiplication or summation seem to favor (in this order) initial precision at an expense of recall. Besides, combination with max seems to favor recall, while two-stage retrieval seems to work best overall.
When compared to our preliminary work [21], we extend it with several new contributions: (1) we present a detailed study about the GP parameters to produce more accurate con-clusions. The experimental design in this extended version of the article adopts a two-level full factorial design [12] to better investigate the effect of GP parameter choices in the evolving process; (2) we study issues about the size of text passages around the image and the inclusion of new tex-tual features not exploited in our preliminary work; (3) we include new queries extracted from a query log of a real Web image search system; (4) and finally, we assess the impact of the possible combinations of such features, thus presenting a more comprehensive and more conclusive study about the usage of textual features and GP to develop image search systems on the Web.
3http://mmretrieval.nonrelevant.net(as of 05/04/2012).
When compared with other research articles related to this topic, our paper differs from previous proposals in the fol-lowing directions. First, we consider each part of the HTML document containing the images (e.g., page title, author, description and keywords meta tags, text passages) as an individual source of evidence. Second, we use many more features extracted from the textual evidence as terminals in the GP framework, not only term frequency (tf) and inverse document frequency (idf) values as used in previous work. Third, we use queries extracted from logs of a real image search engine and also performed effectiveness evaluation using real users, which is a reliable way to test our sys-tem. Fourth, we achieve high precision results through the exclusive use of textual information, without requiring the use of costly image processing algorithms. Fifth, we provide a comprehensive discussion about which textual sources of evidence associated with the images are more important to represent the image contents.
3 Fundamentals of genetic programming
In this section we present a brief overview of GP, to provide the necessary background for the description of our proposed method.
Genetic programming is an evolutionary methodology introduced by Koza [14] as an extension to GAs. It is a problem-solving technique based on the principles of biolog-ical inheritance and evolution of individuals in a population. The search space of a problem, i.e., the space of all possible solutions to the problem, is investigated by applying a set of optimization techniques that imitate the theory of evolution, combining natural selection and genetic operations, to create more diverse and better performing individuals in subsequent generations to provide a way to find near-optimal solutions for a given task.
In essence, GP evolves a number of candidate solutions, called individuals, represented in memory as binary tree structures. Every internal node of the tree is a function and every leaf node, known as terminal, represents either a vari-able or a constant. The maximum number of availvari-able nodes of an individual is determined by the depth of the tree, which is defined before the evolution process begins. An example of an individual represented by a tree structure is provided in Fig.1.
Fig. 1 Example of an individual represented as a tree in GP
best solution for a given problem) and it is used to eliminate from the populations allunfitindividuals, selecting only those that are closest to the desired goal or those that achieve higher scores. The individuals will evolve generation by generation through genetic operations such asreproduction,crossover, andmutation.
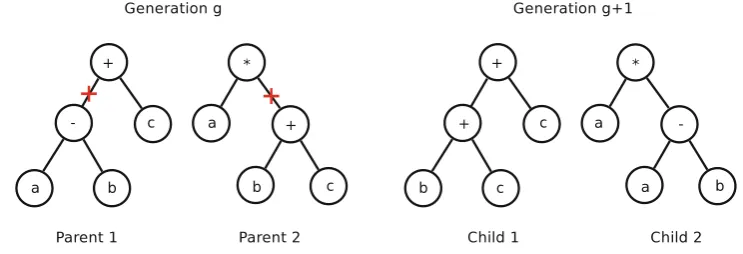
Reproduction is the process that copies the individuals that will participate in the crossover and selection processes, with-out modifying them. The crossover operator allows genetic content exchange between two other individuals, the parents. In a GP process, two parent trees are selected according to a matching selection policy. Next, a random sub-tree is selected from each parent. The children trees result from the swap of the selected sub-trees between the parents. The crossover operation is illustrated in Fig.2.
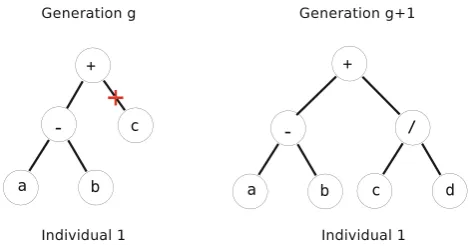
Finally, the mutation operator has the role of keeping a minimum diversity level of individuals in a population. In the mutation operation, a random node in a tree is selected and then replaced by a new randomly created sub-tree. The mutation operation is illustrated in Fig.3.
Thus, at the end of an evolutionary process, guided by the application of the genetic operations, a new population is cre-ated to replace the current one. The fitness value is measured for each new individual, and the process is repeated over many generations until the termination criterion has been satisfied. This criterion can be a pre-established maximum number of generations or some additional problem-specific success predicate to be reached (e.g., an intended value of fitness for a specific individual).
The size of a computer program in GP is often referred to as the program’s complexity. There are various measures of complexity or size in the GP literature. One of the most natural and commonly used is simply the number of nodes in a tree-based GP system. Other definitions of complexity that have been used are the number of bits needed to express a program in linear form, or the number of instructions, for example, in machine code [3].
4 Web image retrieval based on genetic programming
In recent years, the highly adaptive nature of GP has moti-vated numerous researchers to apply it in many fields of infor-mation retrieval (IR) [1,7–10,17,22]. Inspired by the success of GP in previous work, we propose a GP-based framework to handle the task of ranking for Web image retrieval. Our proposed framework operates from a combination of multi-ple textual evidence and uses the princimulti-ples of GP to derive good evidence combination functions to improve the effec-tiveness of Web image retrieval systems.
4.1 GP-based Web image retrieval framework
The GP framework is basically an evolving process separated in two phases:trainingandvalidation. Each phase selects a set of queries and documents from the collection, called the training setand thevalidation set.
The framework starts with the creation of an initial random population of individuals that evolves generation by genera-tion using genetic operagenera-tions. The evolugenera-tionary process con-tinues until a stopping criterion is met. In the training phase, each time a new generation is created, a user-defined fitness function is applied to each new individual, to select only the fittest. Since each individual represents a similarity function, applying this fitness function corresponds to ranking the set of training documents according to the set of training queries, using the similarity function defined by one individual. The obtained fitness value is simply a quality assessment of the generated ranking.
Fig. 3 Example of a mutation operation in GP
During the training phase, the GP system is trained with a labeled dataset (e.g., with information about relevance for each pair (image, query)) in order to learn which are the features that better define an individual as a good solution, i.e, a solution with a suitable fitness value, which is computed by using the fitness function. At the validation phase, the best individuals in the previous phase are evaluated using a second dataset. The idea here is to avoid theoverfitting problemin which individuals that work well in the training set do not generalize for different unseen queries/documents because of an overspecialization for the characteristics of the training set.
After the last generation is finished, we also evaluate the fitness function of the best individuals in the training set using now the validation set of queries and documents. Only the individuals that perform the best in both, the training and validation sets, are selected as the final solutions. Currently, the selection method is based on a simple sum of the fitness values of the individuals in both sets minus the standard devi-ation of these values, as suggested in [1]. The GP process is described in Algorithm 1.
We implemented our GP-based image retrieval system using lil-gp (v1.1),4 a well-known and efficient C GP tool for developing GP-based applications.
4.2 Textual sources of evidence
Web documents usually include a diversity of textual data that can be used for image retrieval. However, due to the uncontrolled nature of the Web, the textual contents of a page does not necessarily contain a proper description of the images included in that page. Sometimes, text surrounding the images are only for navigational purposes, like “next” or “click here” messages. Also, image file names might have been automatically generated, like “image01.jpg”, which does not bring any information related to the image con-tents. Because of these problems, it is not possible to choose only one textual source of evidence in the page to describe the images. A possible solution to address these problems is to consider each part of the HTML as an individual source of evidence. Our proposal is to combine the sources of evidence we have extracted from the Web pages using the GP frame-work to improve the quality of the set of images retrieved. We consider some textual source of evidence contained in Web pages, namely:
1. Full text: the full plain text on the Web page. It provides a richer set of words for describing the document topic, and possibly, for describing the image content.
2. Text passages: text surrounding the images on the Web pages. We use the set of words located close to the images to be related to their content. For example, a 10-term passage is one in which the reference to the image appears in the middle point in the passage, with at most five terms before the image and at most five terms after the image. 3. Anchor text: the set of words found between the anchor
tagsAand/A.
4. Image file name: the file name of the image found in the SRC attribute of the IMG tag.
5. Alternate text: the text entry extracted from the ALT attribute of the IMG tag.
6. Page title: the HTML title of the Web page. Here, it is assumed that the title might provide some information about the content of the images inside the Web page. 7. Author: the text extracted from the AUTHOR attribute in
META of the HTML document.
8. Keywords: the text found in the KEYWORDS attribute in META of the HTML document.
9. Description: the text found in the DESCRIPTION attribute in META of the HTML document.
In [6], sets of evidence extracted from anchor text, image file name and alternate text were concatenated to compose a single textual evidence nameddescription tags. In the same way, sources of evidence extracted from page title, author, description, and keywords tags were also concatenated to build a single evidence namedmeta tags. In our GP frame-work, but differently from [6], we decided to work with all textual evidence separately to analyze their contributions in isolation.
4.3 Terminals
The values of the terminals reflect some statistics directly derived from the collection, such as tf or idf, or some kind of information previously known to be effective, like a ranking score or parts of it, such as BM25 [19] score or average doc-ument length (avgdl), allowing a more effectively oriented exploration of the search space.
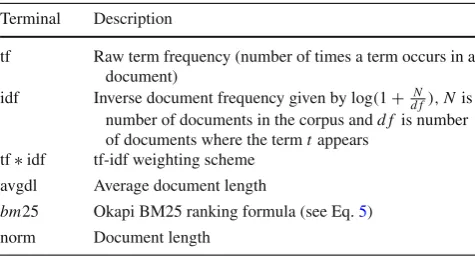
A description of all terminals we used in our evolutionary process is presented in Table1. For each textual evidence, presented in the latest section, we apply these features as the GP terminals.
4.4 Functions
As functions, we used addition (+), subtraction (−), multi-plication (*), division (/), natural logarithm (log), base-10 logarithm (log10), exponential (exp) and square root (sqrt) to combine terminals and subtrees of an individual. Besides these, we also use constant values in the range [0. . .100].
4.5 The individuals
Each individual is represented by terminals and functions, in the form of tree structure, as shown in Fig.1. As an example, a candidate solution or individual produced by our approach
Table 1 Terminals used by our GP-based image retrieval framework Terminal Description
tf Raw term frequency (number of times a term occurs in a document)
idf Inverse document frequency given by log(1+d fN),Nis number of documents in the corpus andd f is number of documents where the termtappears
tf∗idf tf-idf weighting scheme avgdl Average document length
bm25 Okapi BM25 ranking formula (see Eq.5) norm Document length
is presented in Eq.1.
(t f_40t er m∗bm25_40t er m)
+(nor m_T ag Alt+bm25_ti tle) (1)
where t f_40t er m is the frequency of a term (word) in the 40-term passage,bm25_40t er mthe BM25 score of 40-term passage, nor m_T ag Alt the length of the textual evidence Tag ALT (in words), andbm25_ti tleis the BM25 score of the page title.
Individuals are used to compute ranking of images for each query submitted to the image search system. For each query term, the individual formula is used to compute a score for each image in the collection. Then, to compute the final score of an image in regard to the query, we sum the scores obtained for each query term. The final ranking is obtained sorting the images in decreasing order by their respective scores.
More details about the textual sources of evidence, func-tions and terminals used in this work can be found in Sects.4.2–4.4.
4.6 Genetic operations
Based on [14], our GP framework uses the genetic opera-tors of reproduction, crossover, and mutation as detailed in Sect. 3. Table2 presents the methods and rates associated with genetic operators. The values were the same used in [21].
4.7 Fitness function
The fitness function adopted in the evolving process should be able to select the best ranking function among the popula-tion of funcpopula-tions generated. Such selecpopula-tion should consider the results obtained by the training and validation phases as stated before.
In our GP framework, we have adopted the mean average precision (MAP) [2] measure to evaluate the quality of a ranking for a set of queries. MAP, showed in Eq. 7, is a popular metric used in IR to express the quality of a ranking in a single measure across the recall levels. To evaluate each individual, we take each training query, compute a ranking of images using the formula represented by the individual,
Table 2 Genetic operations used by our GP-based image retrieval framework
Operation Method Rate
Crossover One point, tournament selection 0.9
Reproduction The best individual 0.05
and then compute the MAP results obtained in such ranking. The final fitness score of the individual is the average MAP value obtained when processing all the training queries.
5 Experimental setup
In this section, we provide details about the experiments per-formed, describing the parameters adopted for the GP frame-work, the baselines, the dataset, and some evaluation metrics used in the experiments.
5.1 GP setup
A modern GP system has a large number of parameters that must be set in order to start the evolving process. This ini-tial setup creates a combinatorial explosion in the complete parameter space and makes the search for an optimal or near optimal parameter setting a difficult task for the user. To over-come the combinatorial explosion in the number of parame-ter combinations that need to be considered in the GP setup, we use an experimental design technique for evaluating the effect of some GP parameters and their interactions to deter-mine their quantitative effects on the final results. Feldt and Nordin [12] were the first to introduce experimental design as a solid and systematic methodology to study the effect of GP parameters. This technique can be used to increase the performance of a GP system, by guiding the user in choosing good parameter combinations. Finally, this analysis can also help in investigating the impact on using high values for some parameters such as population size and maximum number of generations, which, if kept high, could impact negatively the training time. If a parameter does not impact much the results in terms of effectiveness, we could reduce its levels to gain in efficiency.
Based on the results obtained in [12] we performed a two-level full factorial design [4] to investigate the impact of three parameters: the population size, the number of generations, and the maximum depth of an individual in the GP system. The two first parameters were selected because they were those with higher impact on the GP experiments performed in [12]. The last parameter was added into the factorial design to investigate if the size of tree depth (the GP individual) presents significant influence in the final response.
In a full two-level factorial design, each parameter being investigated is called as a factor and has two discrete levels, a low level (−) and a high level (+). The output is called the response variable. The experimental design is performed varying the levels of each factor, resulting in 2kdifferent runs, wherekis the number of factors. The three factors and their respective values at low and high levels used in the experi-ments are described below. The levels of the parameters were
chosen to represent qualitatively distinct levels based on our previous experience with the GP system in use.
A. pop_size: the numbers of individuals in the population. At the low level it was set to 50 and at the high level to 300. Previously, experiments have shown that an even larger population does not bring benefits in terms of the GP effectiveness.
B. max_gen: the maximum number of generations to evolve the individuals in the GP framework. At the low level it was set to 5 and at the high level to 30.
C. max_depth: the maximum depth of individual in the pop-ulation. At the low level it was set to 4 and at the high level to 12.
In our paper, we have used the MAP as the response vari-able. As we have three factors (A,B, andC) and two lev-els for each factor (a1,a2,b1,b2,c1,andc2), our factorial
design resulted in eight (23) different experiments as shown in Table3. For each of the eight experiments, three replica-tions were carried out allowing us to assess the experimental error, resulting in 24 runs. In our experimental design, each replication is a repeated experiment with a new random seed in the GP framework to generate a new initial population of individuals. The effects of each factor are calculated by subtracting the average response of all experimental runs for which the factor was at its low level from the average response of all experimental runs for which the factor was at its high level. For more detailed information on factorial designs see [4].
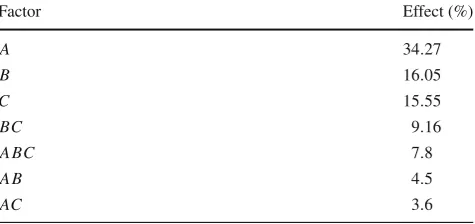
The standard error calculated from these 24 runs was 0.33 giving a 90 % confidence interval of 0.59. All the effects were statistically significant at this confidence level. The effects of each factor and their interactions are showed in Table4 (in order of decreasing effect):
We can observe that population size (factor A) has the largest effect as it explains 34.27 % of the variation in the response. Factor A was about 113 % larger than the effect of factor B and was about 120 % larger than the effect of factorC. This result indicates that setting a large population is important to get good results with GP in the experimen-tal scenario. Experimenexperimen-tal errors or non-observed parameters are responsible for about 9 % of the variation in the response. Although this experiment is not the main focus of our paper, the factorial design was helpful to guide us on the GP para-meter settings.
Table 3 Full two-level factorial
design configuration Factors Runs
a1b1c1 a2b1c1 a1b2c1 a2b2c1 a1b1c2 a2b1c2 a1b2c2 a2b2c2
FactorA − + − + − + − +
FactorB − − + + − − + +
FactorC − − − − + + + +
InteractionA B + − − + + − − +
InteractionAC + − + − − + − +
InteractionBC + + − − − − + +
InteractionA BC − + + − + − − +
Table 4 Factors and their effects for our GP framework
Factor Effect (%)
A 34.27
B 16.05
C 15.55
BC 9.16
A BC 7.8
A B 4.5
AC 3.6
For genetic operations we used rates of 90, 5, and 5 % for crossover, reproduction, and mutation, respectively. At the end of each generation, the validation phase was run for the top 20 best individuals returned by the training phase of that generation. The maximum depth of the generated trees was set to 7, which is large enough to contain all the text features used in this work. The terminals used were those described in our image retrieval framework in Table1.
5.2 Baselines
This section presents the ranking strategies used as baselines in our work.
5.2.1 Bayesian belief network
To evaluate the performance of our GP framework we com-pare it with the work done by Coelho et al. [6]. In that work the author presented an image ranking strategy based on Bayesian belief networks. They analyzed the combination of several textual evidence present in the Web pages in order to compound a ranking formula to retrieve images available on the World Wide Web.
Coelho et al. [6] explored the same textual evidence described in Sect.4.2. The difference is that in [6], the sources of evidence 3–5 are grouped together to compound one evi-dence which they called description tags. Also in [6], the
sources of evidence 6–9 are grouped together to compound the textual evidence which they called meta tags. While [6] only analyzed three passage sizes (10 terms, 20 terms, and 40 terms), our work investigates more three different sizes of text passages.
From the Bayesian model presented in [6], seven ranking strategies were derived and used in their experiments. These ranking formulas can be summarized in Table5where each formula defines an expressionP(ij|q)for ranking an image
ijwith regard to a queryqand the textual evidence extracted
from the Web pages containing the images in the database. R Dj,q,R Mj,q, and R Pj,q are the probabilities of textual
evidence being observed, with regard to queryq, given by description tags, meta tags, and text passages, respectively. ηis a normalizing constant [18], introduced to make the sum of all probabilities equal to 1.
According to [6], the probability of each source of evi-denceej being observed, givenk, can be estimated by the
similarity function provided by the vector space model [16], thus being computed as follows:
P(ej|k)=
t
i=1wi,j×wi,q
t
i=1wi2,j ×
t
i=1wi2,q
(2)
wherekis the state (1 if termi ∈q, 0 otherwise) for each termi. Thewi,j is the weight of the termi in the respective
source of evidence being considered and associated with the imageIj, wi,qis the weight of the termi in the user query.
As in [24], we define these weights as:
wi,j =(1+ln(fi,j))×
ln
1+ N
ni
(3)
wi,q =(1+ln(fi,q))×
ln
1+ N
ni
(4)
The fi,j is the raw frequency of the termiin the document
containing the imageIj,fi,qis the raw frequency of the term
i in the user query q,N is the total number of images in the collection, ni is the number of textual evidence, being
Table 5 Ranking strategies modeled in the belief network model
Ranking approach P(ij|q)
Description tags η×R Dj,q
Meta tags η×R Mj,q
Passage/full text η×R Pj,q
Description + meta tags η× [1−(1−R Dj,q)×(1−R Mj,q)]
Description + passage/full text η× [1−(1−R Dj,q)×(1−R Pj,q)] Passage/full text + meta tags η× [1−(1−R Pj,q)×(1−R Mj,q)]
Description + meta tags + passage/full text η× [1−(1−R Dj,q)×(1−R Mj,q)×(1−R Pj,q)]
image ranking using the Bayesian model can be found in [6]. To provide a fair comparison, we use the same ranking formulas proposed in [6] as baselines in our work.
5.2.2 Okapi BM25
We also compared our GP-based image retrieval framework with the ranking strategy Okapi BM25, as described in [19]. Okapi BM25 is designed based on the 2-Poisson model and has consistently performed very well in TREC competi-tions. More formally, given a queryQcontaining keywords q1, . . . ,qn, the BM25 score of a document Dis defined by
Eq.5.
n
i=1
(k1+1)×
tf+k1×
(1−b)+b×avgdl|D|
×logN−d f+0.5 d f+0.5 (5)
where tf is the frequency of a term (word) in the document text,Nthe total number of documents in the collection,d f the number of documents in the collection in which the term under consideration is present,|D| the length of the docu-ment (in words), avgdl the average docudocu-ment length in the collection (in words),k1 andb are the parameters used to
fine-tune the search performance. We use the same value as in [19] fork1andb:k1=2 andb=0.75.
5.3 Dataset
In order to evaluate our approach, we have performed several experiments using a collection of Web pages5crawled from Yahoo6directory. All the Web pages collected were stored with their respective images to extract the textual evidence depicted in Sect.4.2. Table6presents some statistics about the collection used in the experiments. The image database is very heterogeneous, with no categorization or subdivision in classes, and the images were stored in the same way they were collected, with no post-processing or dimension reduc-tion. We considered as distinct images those that present
5Image dataset can be made available upon request. 6http://www.yahoo.com(as of 10/06/2011).
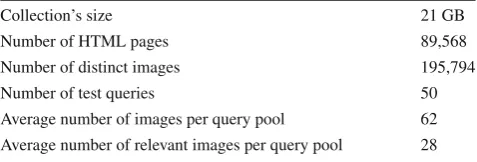
Table 6 Statistics of the data set used in our experiments
Collection’s size 21 GB
Number of HTML pages 89,568
Number of distinct images 195,794
Number of test queries 50
Average number of images per query pool 62 Average number of relevant images per query pool 28
distinct absolute URLs. Therefore, images that appeared in distinct pages, were considered distinct images. Our experi-ments were conducted using 50 keyword-based queries in Portuguese extracted from a log of a real image search engine.7The queries used in our experiments were: Rio de Janeiro beach, sunset, Fernando de Noronha, map of Brazil, church, football ball, Serra da Canastra, Jesus, carnival pho-tos, flower pot, Mônica’s gang, Gloria Hotel, mangalarga horse, Marisa Monte, shark, Linux, Skol beer, coke, Car-refour, Corcovado, basset, Pirenópolis, Machado de Assis, Brazil empire, ranch, military dictatorship, missing children, marijuana, Backstreet Boys, Pokemon, indians, Corinthians, Barbie, roses, palm, landscape, fruits, Halloween, gradua-tion, global warming, beaches, Christmas, dog, baby, color-ing, Flamengo, Santa Claus, animals, newspaper, and virus. We adopted TREC-style pooling of the retrieved images with a pool depth of 30. For each query, we ran the base-line methods and assembled the 30 top ranked images retrieved by each ranking strategy. For the Bayesian model, all seven strategies presented in Table 5 were considered. These images were pooled into a unique set of candidate images for each query. Thus, in this way, it was not possible to tell which ranking strategy retrieved which image. Each pool was then evaluated by a group of volunteers as relevant or non-relevant with regard to its respective test query. At the end of the evaluation, we have a set of images for each image query, labeled as relevant or non-relevant, indepen-dently of how they were retrieved. This set of images formed a pool with 62 images on average per query (relevant and
non-relevant). Considering only the relevant images there were 28 images on average per query pool, as presented in Table6. This pooling method was the same method used in [6,23]. It avoids the need to evaluate the whole collection. Further, it guarantees that the user will not have any informa-tion about the ranking strategy adopted to retrieve the images, thus providing an unbiased evaluation.
5.4 Evaluation metrics
To evaluate the performance of our approach against the base-lines, we used Precision@N and MAP measures over all rele-vant documents. We also plot all retrieval results in precision-recall curves. These metrics are detailed as follows.
• Precision at N Position (P@N) [2] for a given query, its precision for the topNresults of the ranking list is defined as Eq.6, where|relN|is the number of relevant images
in topN results.
P@N= |relN|
N (6)
• MAP [2] is a popular metric used in IR that provides a single-figure measure of quality across all recall levels. It is defined as the mean of average precisions over a set of queries and computed by Eq.7, wherekis the total number of queries andPqis the average precision for the
queryq.
MAP=1
k
k
q=1
Pq (7)
Pqis defined by Eq.8, wheremis the number of retrieved
documents for the queryq,n is the number of relevant documents for the queryq andrqi is a binary function indicating whether theith document is relevant or not for the queryq.
Pq=
1 n
⎛ ⎝m
i=1
rqi × 1 i
i
j=1
rqj ⎞
⎠ (8)
• Precision/recall are defined in terms of a set of retrieved documents by a given approach and a set of relevant documents for a certain topic. Precision is the fraction of retrieved documents which is relevant and recall is the fraction of the relevant documents which has been retrieved.
Precision=|Relevant documents∩Retrieved documents| |Retrieved documents| (9) Recall=|Relevant documents∩Retrieved documents|
|Relevant documents| (10)
6 Experimental results
In order to validate our GP-based image retrieval approach, we performed a 5-fold cross-validation using the whole set of evaluated queries adopted in our experiments.
6.1 Experiments with Bayesian belief network model
In this section we present the results obtained with the Bayesian belief network model presented in [6].
6.1.1 Full text versus text passages
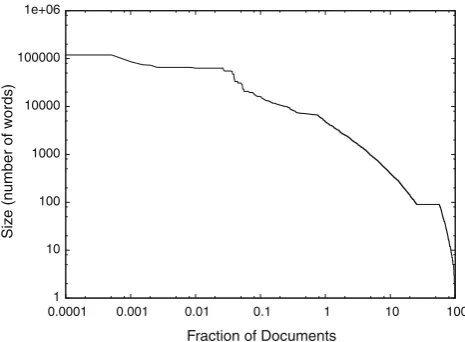
Our first experiment was performed to determine the best size for the passages surrounding the images. Initially, we decided to investigate the size of documents, that is the full text without HTML tags, in order to choose good sizes for the passages to be used in our experiments. Figure4shows the document size distribution, in logarithmic scale, in which the documents were plotted in descending order according to their sizes. The document size is expressed in number of terms, meaning that the first document plotted in the distri-bution is the document that has the largest number of terms, the second document is the one that has the second largest number of terms, and so on. We observed that this distribu-tion is heavy tailed, where a small fracdistribu-tion of documents has a large number of terms, and a large fraction of documents, about 76 % of documents, has<100 terms. Table7shows some statistics about the document size distribution.
1 10 100 1000 10000 100000 1e+06
0.0001 0.001 0.01 0.1 1 10 100
Siz
e (n
umber of w
ords)
Fraction of Documents
Fig. 4 Document size distribution
Table 7 Statistics of the document size distribution
Average size of documents 288
Median size of documents 90
Size of largest document 126,712
The average size of documents is higher than the median which means this distribution is skewed. Further, there is a large variability in the size of documents in the collection. Based on these observations, we decided to experiment sev-eral passage sizes in order to determine the best size for the passages to be used in our experiments, namely: 10-term, 20-term, 40-term, 60-term, 80-term, and 100-term passages. Table8shows the MAP results for each passage size, for our 50 test queries, considering the set of relevant images. Passages of 60 terms produced the highest MAP values, while shorter passages, 10-term and 20-term led to lower values. We can conclude that a passage of text surrounding the image can be much more informative about the image contents than the full text in the page. One reason is that the whole text in a Web document is often very ambiguous, dealing with several topics frequently not related to the contents of the images in the document. On the other hand, text passages with very few terms may be insufficient to provide good descriptions.
Figure5shows the 11-point average precision curve for all passage sizes. We can observe that 10-term and 20-term pas-sages performed worst at almost all recall levels and full text only surpasses the other approaches at recall levels superior than 50 %. We can also observe that 60-term, 80-term, and 100-term text passages had similar performance followed by 40-term approach. In order to assess whether the text
pas-Table 8 Mean average precision for text passages surrounding the images
Passage sizes MAP
Full text 24.86
10-term 21.54
20-term 19.98
40-term 26.79
60-term 28.34
80-term 27.94
100-term 25.43
0 10 20 30 40 50 60 70
0 20 40 60 80 100
Inter
polated Precision (%)
Recall (%)
Full Text 10-term 20-term 40-term 60-term 80-term 100-term
Fig. 5 11-Point average precision obtained for all passage sizes
sages we tested are statistically different from each other, we applied a Wilcoxon-test on the results to guide our choice for the best approach. Although the 60-term approach has led to the best result in terms of MAP, it was statistically equiva-lent to 40-term, 80-term, 100-term and full text approaches according to the Wilcoxon-test. Due to the good compro-mise between retrieval performance and low computational resources achieved by the 40-term text passage, we consider only passages of 40 terms in comparison with other sources of evidence in isolation, since it represented the best cost-benefit in the collection we used.
6.1.2 Single sources of evidence
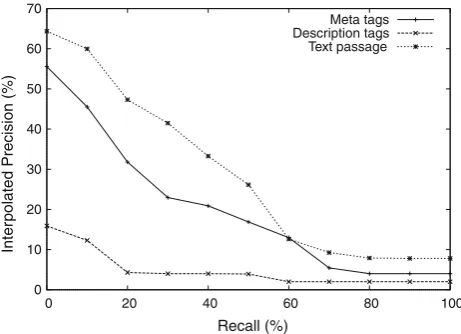
To further investigate how passages of 40 terms contribute to the relevance of the images, we confronted them with meta and description tags to evaluate each of them separately. Fig-ure6 shows the 11-point average precision for these three sources of evidence. We observe that text passages are much better than meta tags and description tags to describe the Web images in the dataset we used. The description tags were the least informative source of relevance evidence among the ones considered.
Table9presents the MAP obtained for three sources of evidence in isolation. We observed that text passages give more contribution in image retrieval, followed by meta tags. Description tags give the worst result in the dataset we used. We have applied a Wilcoxon-test to the results and all the
0 10 20 30 40 50 60 70
0 20 40 60 80 100
Inter
polated Precision (%)
Recall (%)
Meta tags Description tags Text passage
Fig. 6 11-Point average precision obtained using each source of evi-dence in isolation
Table 9 Mean average precision for sources of evidence in isolation
Sources of evidence MAP
Meta tags 18.17
Description tags 9.13
differences between text passage and other two approaches are statistically significant with a confidence level higher than 95 %.
6.1.3 Multiple sources of evidence
We now compare the results obtained when we combine mul-tiple sources of evidence. Figure7presents the results for the four combination formulas presented in [6]: description + passage, description + metatags, metatags + passage, and description + metatags + passage.
We can observe that description + metatags and descrip-tion + passage combinadescrip-tions performed the worst due to the poor performance of the description tags approach. The metatags + passage and metatags + description + passage approaches performed similarly although the metatags + pas-sage approach presented higher precision values at recall lev-els up to 60 %. For recall levlev-els above 60 %, the metatag + description + passage approach presented a slightly better retrieval performance. However, it is important to say that for a real Web image search engine high precision is most important at low recall levels.
Table10 shows the MAP results obtained for multiple sources of evidence. We have applied a Wilcoxon-test to the results and metatags + passage was significantly superior to description + metatags with 99 % of confidence level and resulted in higher MAP values when compared to description + passage, although with only 90 % of confidence level.
0 10 20 30 40 50 60 70
0 20 40 60 80 100
Inter
polated Precision (%)
Recall (%)
Description+Meta tags Description+Passage Meta tags+Passage Meta tags+Description+Passage
Fig. 7 11-Point average precision obtained using multiple sources of evidence
Table 10 Mean average precision for multiple sources of evidence
Multiple sources of evidence MAP
Description + metatags 19.37
Description + passage 24.69
Metatags + passage 29.27
Description + metatags + passage 27.40
Due to the good results obtained with the use of metatags + passage, this approach will be used in comparison with our GP framework.
6.2 Experiments with GP framework
In this section we present the results of our experiments with the GP framework and comparison with the baselines described in Sect.5.2.
Figure8shows the evolutionary process of our GP frame-work at training, validation and test phases during the 30 generations. For each generation, we plotted the best 20 indi-viduals sorted according to their performance, achieved with the fitness function. Despite the fact that training, validation, and test phases present different fitness values, validation and test curves tend to follow the training behavior.
Figure9shows the precision-recall curves obtained by our GP framework, the best result obtained in Bayesian frame-work (metatags + passage), and the BM25 ranking obtained
15 20 25 30 35 40 45 50 55
0 5 10 15 20 25 30
MAP (%)
Best individuals per generation
Training Validation Test
Fig. 8 Evolutionary process for the best individuals in 30 generations
0 10 20 30 40 50 60 70 80
0 20 40 60 80 100
Inter
p
olated Precision (%)
Recall (%)
GP Bayesian (Meta+Passage) BM25 (full text)
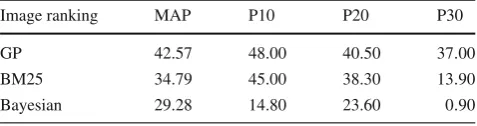
Table 11 Mean average precision and P@N measures for GP framework and the baselines
Image ranking MAP P10 P20 P30
GP 42.57 48.00 40.50 37.00
BM25 34.79 45.00 38.30 13.90
Bayesian 29.28 14.80 23.60 0.90
over the full text. We observe that our GP approach yields better precision values than BM25 and Bayesian ranking throughout all recall levels.
Table11depicts the MAP and P@N results obtained by our method and the baselines BM25 and Bayesian combina-tion (metatags + passage). Surprisingly, the results obtained with the Bayesian method was not superior to the ones achieved with BM25 using full text. On the other hand, the GP framework was able to improve the results of BM25 from 34.79 to 42.57 in MAP, a gain of 22.36 %. According to Wilcoxon test, the results obtained with our GP framework were statistically significant with a confidence level of 99 % in relation to Bayesian model and 98 % in relation to BM25.
((((avgdl_10t er m∗avgdl_20t er m)+(t f_40t er m∗bm25_40t er m))
+((nor m_T ag Alt+bm25_ti tle)+((avgdl_10t er m∗avgdl_20t er m)+(t f_40t er m∗bm25_40t er m)))) +(((bm25_ti tle+((avgdl_10t er m∗avgdl_20t er m)+(bm25_text+bm25_ti tle)))
∗(avgdl_10t er m∗avgdl_20t er m))+(bm25_text+(avgdl_10t er m∗avgdl_20t er m)))) (11)
Further analysis in the final ranking functions generated by our GP framework showed that the BM25 scores of page title and full text, and the avgdl of 10-term passage were the textual evidence that most appear in the final ranking functions. An example of a ranking formula generated by our GP approach is presented in Eq.11.
7 Conclusions and future work
This paper presented a GP-based approach for adopting sev-eral different textual sources of evidence for ranking in Web image search systems. The sources of textual evidence con-sidered in this work are the page title, content of HTML src and alt tags, the metatags author, keywords and description, text passages around the image, the anchor text and the full text. For each textual evidence several statistical sources of information, including tf, idf and norm were used, as well as the BM25 score produced by each single evidence used in isolation.
Among these sources of evidence, the ones with higher impact in the quality of the search results are the BM25 scores of page title and full text, and the avgdl of 10-term passage.
According to our experiments, the adopted approach pre-sented significant gains over the baseline methods. Our GP approach presented a gain of 22.36 % over the second best result, which was achieved when using BM25 over the full text of the pages that contain the searched image. When comparedto the method proposed previously in [6], the gain was roughly 43 %, which is surprisingly even higher than the gain over BM25 applied to the full text.
Another contribution of this article is the study about how to set the GP parameters, which was performed by using the factorial design technique. The usage of such technique has proved to be useful for reducing the cost of adjusting GP parameters, allowing us to achieve higher performance when using the GP framework, when compared to our previous study.
As future work, we plan to introduce evidence related to the image content in the GP framework, so that we will be able to combine both image and textual sources of evi-dence in a single ranking function, as done in [15]. Another future direction is to study the possibility of deriving distinct GP functions for specific query types, such as tourism and arts and science. The idea is to check whether such specific
functions can outperform the results obtained by the generic function studied here. Finally, another possible future direc-tion is to assert the impact of GP in specific query types, studying its performance in query groups such as tourism, arts and science.
Acknowledgments This work is partially supported by CAPES, CNPq, FAPEMIG, FAPEAM, FAPESP and by project INWeb (MCT/CNPq Grant 57.3871/2008-6).
References
1. de Almeida HM, Gonçalves MA, Cristo M, Calado PP (2007) A combined component approach for finding collection-adapted ranking functions based on genetic programming. In: ACM SIGIR, pp 399–406
2. Baeza-Yates RA, Ribeiro-Neto BA (2011) Modern information retrieval—the concepts and technology behind search, 2nd edn. Pearson Education, Harlow
3. Banzhaf W, Nordin P, Keller RE, Francone FD (1998) Genetic programming: an introduction. Morgan Kaufmann, San Francisco
5. Chang HT (2008) Web image retrieval systems with automatic web image annotating techniques. WSEAS 5(8):1313–1322
6. Coelho TAS, Calado P, Souza LV, Ribeiro-Neto BA, Muntz RR (2004) Image retrieval using multiple evidence ranking. IEEE TKDE 16(4):408–417
7. Fan W, Gordon MD, Pathak P (2000) Personalization of search engine services for effective retrieval and knowledge management. In: ICIS, pp 20–34
8. Fan W, Gordon MD, Pathak P (2004) Discovery of context-specific ranking functions for effective information retrieval using genetic programming. IEEE TKDE 16(4):523–527
9. Fan W, Gordon MD, Pathak P (2005) Genetic programming-based discovery of ranking functions for effective web search. J Manag Inf Syst 21(4):37–56
10. Fan W, Pathak P, Zhou M (2009) Genetic-based approaches in rank-ing function discovery and optimization in information retrieval—a framework. Decis Support Syst 47(4):398–407
11. Faria FF, Veloso A, Almeida HM, Valle E, da S Torres R, Gonçalves MA, Meira W (2010) Learning to rank for content-based image retrieval. In: ACM MIR, pp 285–294
12. Feldt R, Nordin P (2000) Using factorial experiments to evaluate the effect of genetic programming parameters. In: Genetic pro-gramming, Proceedings of EuroGP, pp 271–282
13. Kherfi ML, Ziou D, Bernardi A (2004) Image retrieval from the world wide web: issues, techniques, and systems. ACM Comput Surv 36:35–67
14. Koza JR (1992) Genetic programming: on the programming of computers by means of natural selection. MIT Press, Cambridge
15. Li P, Ma J (2009) Learning to rank for web image retrieval based on genetic programming. In: IEEE IC-BNMT, pp 137–142 16. McGill M, Salton G (1983) Introduction to modern information
retrieval. McGraw-Hill, NY
17. Oren N (2002) Reexamining tf.idf based information retrieval with genetic programming. In: SAICSIT, pp 224–234
18. Pearl J (1988) Probabilistic reasoning in intelligent systems: net-works of plausible inference. Morgan Kaufmann, San Francisco 19. Robertson S, Walker S, Beaulieu M, Gatford M, Payne A (1996)
Okapi at trec-4. In: TREC-4, pp 73–96
20. da S Torres R, Falcão AX, Gonçalves MA, Papa JP, Zhang B, Fan W, Fox EA, (2009) A genetic programming framework for content-based image retrieval. Pattern Recognit 42:283–292
21. Santos KCL, Almeida HM, Goncalves MA, da S Torres R (2009) Recuperação de imagens da web utilizando múltiplas evidências textuais e programação genética. In: SBBD, pp 91–105
22. Trotman A (2005) Learning to rank. Inf Retr 8(3):359–381 23. Voorhees EM, Harman D (1999) Overview of the eighth text
retrieval conference (trec-8). In: TREC-8
24. Witten IH, Moffat A, Bell TC (1999) Managing gigabytes: com-pressing and indexing documents and images, 2nd edn. Morgan Kaufmann, San Francisco