© 2017 IJSRST | Volume 3 | Issue 6 | Print ISSN: 2395-6011 | Online ISSN: 2395-602X Themed Section: Science and Technology
Determination of Education Scholarship Recipients Using
Preference Selection Index
Mesran
1, Kennedi Tampubolon
2, Ronda Deli Sianturi
3, Fince Tinus Waruwu
4,
Andysah Putera Utama Siahaan
51,2,3,4
Department of Computer Engineering, STMIK Budi Darma, Medan, Indonesia 5Faculty of Computer Science, Universitas Pembanguan Panca Budi, Medan, Indonesia
5Student of Universiti Malaysia Perlis, Kangar, Malaysia
ABSTRACT
The decision taken in the selection of scholarship recipients for students is one of the responsibilities held by the stakeholders at the high school leadership level. The decision-making stage consists of compliance with the terms or criteria set by the government as the scholarship provider. Implementation of decision support methods for selection of scholarship recipients is required. This can help the leadership to make the selection better. Many methods in decision support systems can solve and make decisions better, including preference selection index. The use of preference selection index applied in the decision support system will result in a more effective decision.
Keywords: PSI, Decision Support Systems, Scholarship
I.
INTRODUCTION
The scholarship is a program owned by institutions, companies, governments engaged in the private sector and the country to be given to learners. The scholarship program can help learners and relieve the burden of parents on the cost of education to follow the process of education of their children. The existence of distributed scholarships can also motivate the learners to improve their ability in learning. In obtaining the scholarship is of course through rules that have been established procedures. The importance of education now has been felt by the wider community, but with the weakening economy, making people more pessimistic whether they will be able to finance and send their sons to a higher education level.
Of course with the existence of scholarships in educational programs that exist in an institution will be able to ease the burden of the responsibility of parents. There are two types of scholarships in this case given to students, Student Learning Assistance Academic Achievement Improvement funded by the government. The authors use the first scholarship as the object of research; the benchmark assessment is seen from the value of GPA, income and dependents parent, student activeness organize.
The process of determining students eligible for a scholarship can be supported by the use of multi-criteria decision-making methods. As has been done in previous research, the selection of the best computer lecturers applies the ELECTRE method [1], the decision support system can also determine the amount of tuition reduction by applying Fuzzy Tsukamoto [2]. The selection of laser cutting process conditions using the preference selection index method leads to the conclusion that the Preference Selection Index method can provide an objective approach in determining the criteria weighting in process selection [3]. R Attri has used a preference selection index in decision making during the design phase of the production system life cycle [4].
II.
METHODS AND MATERIAL
2.1 Scholarships
2.2 Preference Selection Index (PSI)
The Preference Selection Index (PSI) method was developed by Maniya and Bhatt (2010) to solve multi-decision multi-decision criteria (MCDM). In the proposed method it is not necessary to establish the relative importance of the attributes [5]. This method is useful when there is conflict in determining the relative importance of attributes. In the stages the weighted PSI method is determined by the information contained in the decision matrix, with the standard deviation or entropy method can identify the objective criteria weight [6].
Several steps to develop the PSI method: 1. Identify the problem.
Determine alternatives along with related attributes in decision making.
2. Identify the decision matrix.
m in the Xij matrix is the number of alternatives for
selection and n is the number of attributes. While Xij
is the decision matrix of i-th alternative with j-th criterion.
Xij=[
]... (1)
3. Normalize the decision matrix.
The normalized decision matrix is constructed using equations (2) and (3). For equation (2) is an advantage attribute.
...(2)
If the smaller value is better than the other value then use the cost attribute, as in equation (3).
... (3)
4. Determination of the mean value of the normalized matrix
∑ ………...(4)
5. Calculates the value of preference variation
In this step, the value of preference variation (∅j) or each attribute is determined using the following equation:
∅ ∑
... (5)
6. Determine the deviation of preference value
∅ ... (6)
7. Determine the criteria weight =
∑ ... (7)
8. Determination the preference selection index
∑ ... (8)
The alternative that has the largest preference selection index is the best alternative.
III.
RESULTS AND DISCUSSION
In this section, there are six alternatives and five criteria. There can be seen in Table I and IV.
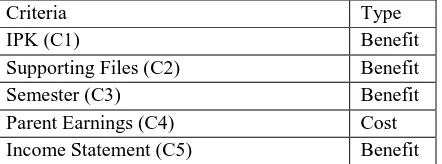
TABLE I
The Criteria and Type of Criteria
Criteria Type
IPK (C1) Benefit
Supporting Files (C2) Benefit
Semester (C3) Benefit
Parent Earnings (C4) Cost
Income Statement (C5) Benefit
Table II and III are the range of values for Supporting File Criteria (C2) and Income Statement (C5)
TABLE II. Files Supporting (C2)
Information Value
Complete 100
Less Complete 70
Incomplete 35
TABLE III. Income Statement (C5)
Information Value
Available 100
Table IV, a list of alternatives will be selected.
TABLE IV. The Alternative
Alternative Criteria
C1 C2 C3 C4 C5
A1 3.80 Complete 5 2,350,000 Available
A2 3.80 Less
Complete
5 2,100,000 Available
A3 3.75 Complete 3 1,950,000 Available
A4 3.90 Complete 5 2,250,000 Not
Available A5 3.50 Complete 3 2,150,000 Available
A6 3.60 Complete 5 2,050,000 Available
Based on the table V and the range of values on each criterion, the results obtained from each alternative as follows:
TABLE V
Alternative Match Rating Table and Criteria
Alternative Criteria
C1 C2 C3 C4 C5
A1 3.80 100 5 2,350,000 100
A2 3.80 70 5 2,100,000 100
A3 3.75 100 3 1,950,000 100
A4 3.90 100 5 2,250,000 50
A5 3.50 100 3 2,150,000 100
A6 3.60 100 5 2,050,000 100
After defining alternatives and criteria, then make the Xij
decision matrix as below.
100 2,050,000 5 100 3.6 100 2,150,000 3 100 3.5 50 2,250,000 5 100 3.9 100 1,950,000 3 100 3.75 100 2,100,000 5 70 3.8 100 2,350,000 5 100 3.8 Xij
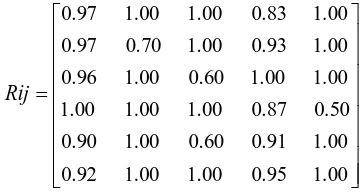
Based on equation 1 above, make the matrix normalized.
= [3.8, 3.8, 3.75, 3.9, 3.5, 3.6]
= 3.9
This step is done up to j = 6 and generated the normalized matrix (Rij) below.
1.00 0.95 1.00 1.00 0.92 1.00 0.91 0.60 1.00 0.90 0.50 0.87 1.00 1.00 1.00 1.00 1.00 0.60 1.00 0.96 1.00 0.93 1.00 0.70 0.97 1.00 0.83 1.00 1.00 0.97 Rij
The next step is to find the mean values of the normalized matrix
Nj1= 0.97 + 0.97 + 0.96 + 1.00 + 0.90 + 0.92 = 5.73 Nj2= 1.00 + 0.70 + 1.00 + 1.00 + 1.00 + 1.00 = 5.70 Nj3= 1.00 + 1.00 + 0.60 + 1.00 + 0.60 + 1.00 = 5.20 Nj4= 0.83 + 0.93 + 1.00 + 0.87 + 0.91 + 0.95 = 5.48 Nj5= 1.00 + 1.00 + 1.00 + 0.50 + 1.00 + 1.00 = 5.50
The value of
N = ∑ . 5.73 = 0.9551
N = ∑ . 5.70 = 0.9500
N = ∑ . 5.20 = 0.8667
N = ∑ . 5.48 = 0.9139
N = ∑ . 5.50 = 0.9167
The next step calculates the value of preference variation.
∅ = = 0.0004 ∅ = = 0.0004 ∅ = = 0.0000 ∅ = = 0.0020 ∅ = = 0.0033 ∅ = = 0.0010
0.0069 0.0014
0.0178 0.0025
0.0010
0.0069 0.0000
0.0711 0.0025
0.0033
0.1736 0.0022
0.0178 0.0025
0.0020
0.0069 0.0074
0.0711 0.0025
0.0000
0.0069 0.0002
0.0178 0.0625
0.0004
0.0069 0.0071
0.0178 0.0025
0.0004
φij
Then summing the rank results to the matrix ∅ ∑ ∅ ∅ ∅ ∅ ∅ ∅
= 0.0004+0.0004+0+0.0020+0.0033+0.0010 = 0.0071
∑ ∅ ∅ ∅ ∅ ∅ ∅
= 0.0025+0.0625+0.0025+0.0025+0.0025+0.0025 = 0.0750
∑ ∅ ∅ ∅ ∅ ∅ ∅
= 0.0178+0.0178+0.0711+0.0178+0.0711+0.0178 = 0.2133
∑ ∅ ∅ ∅ ∅ ∅ ∅
= 0.0071+0.0002+0.0074+0.0022+0+0.0014 = 0.0184
∑ ∅ ∅ ∅ ∅ ∅ ∅
= 0.0069+0.0069+0.0069+0.1736+0.0069+0.0069 = 0.2083
∅
The next step determines the deviation in the preference value.
= 1 – 0.0071 = 0.9929
= 1 – 0.0750 = 0.9250
= 1 – 0.2133 = 0.7867
= 1 – 0.0184 = 0.9816
= 1 – 0.2083 = 0.7917
Then calculate the total overall value on deviation
∑ = 0.9929+0.9250+0.7867+0.9816+0.7917= 4.4778
After the total deviation value is known, then look for the weight of each criterion.
=
= 0.2217
=
= 0.2066
=
= 0.1757
=
= 0.2192
=
= 0.1768
The last step then calculates the selection index
Ө1= 0.21604+0.20657+0.17568+0.18191+0.17680 = 0.95700
Ө2= 0.21604+0.14460+0.17568+0.20356+0.17680 = 0.91668
Ө3= 0.21320+0.20657+0.10541+0.21922+0.17680 = 0.92120
Ө4= 0.22173+0.20657+0.17568+0.18999+0.08840 = 0.88237
Ө5= 0.19899+0.20657+0.10541+0.19883+0.17680 = 0.88659
Ө6= 0.20467+0.20657+0.17568+0.20853+0.17680 = 0.97225
The final result of the calculation can be seen in the following table VI.
TABLE VI Result
Alternative Value of PSI Rank A1 0.95700 2
A2 0.91668 4
A3 0.92120 3
A4 0.88237 6
A5 0.88659 5
A6 0.97225 1
From the calculations, it is clear that A6 > A1 > A3 > A2 >
A5 > A4 and Alternative A6 are the best alternative of all
available alternatives.
IV.CONCLUSION
The use of the Preference Selection Index method can provide the selection to the scholarship students more selectively. The ease with which the PSI method provides convenience to the decision maker without assigning a weighted value to each criterion to avoid the relative importance of each criterion.
V.
REFERENCES
[1]. Mesran, G. Ginting, Suginam, and R. Rahim, "Implementation of Elimination and Choice Expressing Reality ( ELECTRE ) Method in Selecting the Best Lecturer ( Case Study STMIK BUDI DARMA )," Int. J. Eng. Res. Technol. (IJERT, vol. 6, no. 2, pp. 141-144, 2017.
[3]. M. Madic, J. Antucheviciene, M. Radovanovic, and D. Petkovic, "Determination of laser cutting process conditions using the preference selection index method," Opt. Laser Technol., vol. 89, no. October 2016, pp. 214-220, 2017.
[4]. R. Attri and S. Grover, "Application of preference selection index method for decision making over the design stage of production system life cycle," J. King Saud Univ. - Eng. Sci., vol. 27, no. 2, pp. 207-216, 2015.
[5]. K. Maniya and M.G.Bhatt, "A selection of material using a novel type decision-making method: Preference selection index method," Mater. Des., vol. 31, no. 4, pp. 1785-1789, 2010. [6]. B. Vahdani, S. M. Mousavi, and S. Ebrahimnejad,
"Soft computing-based preference selection index method for human resource management," J. Intell. Fuzzy Syst., vol. 26, no. 1, pp. 393-403, 2014.
[7]. R. Rahim, Mesran, A. P. U. Siahaan, and S. Aryza, "Composite Performance Index for Student Admission," Int. J. Res. Sci. Eng., vol. 3, no. 3, 2017.
[8]. R. Khorshidi and A. Hassani, "Comparative analysis between TOPSIS and PSI methods of materials selection to achieve a desirable combination of strength and workability in Al/SiC composite," Mater. Des., vol. 52, no. June, pp. 999-1010, 2013.