Themed Section: Science and Technology
Development and Validation of Stability Indicating Ultra Performance Liquid
Chromatography method for simultaneous Quantification of
Thiophante-methyl, Fipronil and Pyraclostrobin in Pesticide Formulation
Dilip K. Patel*, Babu Lal Swami, T.L. Rajawat
School of Basic and Applied Science, Raffles University, Neemrana-Alwar, Rajasthan, India
ABSTRACT
A novel stability-indicating ultra-performance liquid chromatography (UPLC) method has been developed and validated for quantification of Thiophanate-methyl, Fipronil and Pyraclostrobin in pesticide formulation (FS), using Poroshell 120 EC-C18 (100 mm × 4.6 mm, 2.7µm) column. Mixture of 0.1% ortho-phosphoric acid: acetonitrile (40:60 v/v) was used as mobile phase. The flow rate was kept 0.75 ml/min and detection was carried out at 275 nm. The limit of detection was 0.00017 mg/ml, 0.0010 mg/ml and 0.00022 mg/ml for Thiophanate-methyl, Fipronil and Pyraclostrobin respectively. The limit of quantitation values was 0.00035mg/ml, 0.0020mg/ml and 0.00035mg/ml for Thiophanate-methyl, Fipronil and Pyraclostrobin respectively. The linearity of proposed method was investigated in the range of 0.00038-0.661mg/ml (r2=0.9993), 0.00202-0.743mg/ml (r2=0.9997) and 0.0004-0.091mg/ml (r2=0.9996) for Thiophanate-methyl, Fipronil and Pyraclostrobin respectively. The percentage recovery found to be in range from 98.4-100.0 %, 98.4-99.1% and 98.5-99.3% for Thiophanate-methyl, Fipronil and Pyraclostrobin respectively. The % RSD values for intraday precision study and inter-day precision study were <1.65, <1.68 and <2.33 for Thiophanate-methyl, Fipronil and Pyraclostrobin respectively as per modified Horwitz equation as requirements by CIPAC. The developed method was found to be specific, linear, precise, accurate and robust. This method is also useful for quantification of Thiophanate-methyl, Fipronil and Pyraclostrobin in their single or combination formulated products, environmental samples (soil, water), and agricultural products for pesticide residue analysis.
Keywords: Thiophante-methyl; Fipronil; Pyraclostrobin; Stability indicating; Validation; Horwitz equation; FS-Flow-able concentrate for Seed treatment, CIPAC - Collaborative International PesticidesAnalytical council, Uncertainty in measurements.
I.
INTRODUCTION
Thiophanete-methyl, is dimethyl 4,4′-(o-phenylene)bis(3-thioallophanate). Thiophanate-methyl is Systemic Fungicide with protective and curative action. Absorbed by the leaves and roots, effective against a wide range of fungal pathogens including eyespot and other disease of cereals. Also used additionally as a wound protectant for pruning cuts of trees. Fipronil, is (±)-5-amino-1-(2,6-dichloro-α,α,α-trifluoro-p-tolyl)-4
trifluoromethylsulfinylpyrazole-3-carbonitrile.
Figure 1.Structure of Thiophanate-methyl
Figure 2.Structure of Fipronil
Figure 3 Structure of Pyraclostrobin
Various publications are available regarding determination method of Thiophanate-methyl, Fipronil and Pyraclostrobin but most of the methods are applicable either to Thiophante-methyl or Fipronil or Pyraclostrobin in various pesticide formulations or in foods or water samples. UPLC MS/MS method was reported for quantification of Thiophanate-methyl [2] also spectrophotometric method using iodine-azide reaction was reported for determination of Thiophanate-methyl [3]. Gas chromatographic (GC-FPD/ GC-NPD) methods for Fipronil residues in agricultural products [4] .GC-ECD method for Fipronil residue in honey and pollen plasma and also in surface water [5, 6]. GC-MS method for Fipronil residues in foods, water samples and agricultural products [7, 8, 9], ELISA methods for fipronil residues in humanserum and urine matrices [10], HPLC
method for fipronil in bovine plasma and parakill
[11,12] and Fipronil in its technical
[13].UPLC-MS method for Pyraclostrobin residues in food
and also in drinking water [14, 15] also HPLC
methods are reported for the determination of
Pyraclostrobin in its technical and residues in
grapes and tomatoes [16, 17, 18]. Simultaneous
determination
of
Thiophanate-methyl
and
Fipronil residues in herbal teas by UPLC-MS-MS
[19] and simultaneous determination of Fipronil
and Pyraclostrobin in food sample by
UPLC-MS-MS [20] were reported.
To the best of our knowledge, there is no reported UPLC method for simultaneous quantification of Thiophanate-methyl, Fipronil and Pyraclostrobin in pesticide formulations. Thus, efforts were made to develop fast, selective and sensitive stability indicating method for simultaneous quantification of Thiophanate-methyl, Fipronil and Pyraclostrobin in their combined pesticide formulation using ultra performance liquid chromatographic method. In the current work developed a simple, reliable and reproducible, stability indicating UPLC method which was duly validated by statistical parameters precision, accuracy-recovery, linearity, robustness, solution stability. Uncertainty in measurements were also calculated for each active ingredients. The method has been applied to the simultaneous estimation of Thiophanate-methyl, Fipronil and Pyraclostrobin in technical and pesticide formulations.
II.
EXPERIMENTAL
Pyraclostrobin - 99.0%. These standards used for further analysis. Sample of Pesticide formulation for seed treatment (FS) containing Thiophante-methyl 225 g/l, fipronil 250g/l and Pyraclostrobin 50g/l was prepared in laboratory. HPLC grade acetonitrile was purchased from Fischer Scientific, Mumbai (India). Mili-Q (Millipore India Pvt. Ltd) system used to obtain HPLC grade water. Analytical grade Ortho-phosphoric acid (88%), Hydrochloric acid (35%), Sodium Hydroxide pellets and 30% v/v Hydrogen Peroxide solution were obtained from SD Fine Chemicals Ltd, Mumbai (India).
2.2 Instrumentation: The UPLC system used to perform development and validation of this quantification method is of WATERS Acquity UPLC comprised of a binary solvent pump, Photo Diode array detector and auto sampler with Empower 2 software.
2.3 Mobile phase preparation: The mobile phase consist of Mobile phase A - 0.1 % Ortho-phosphoric acid and Mobile phase B – Acetonitrile in 40:60 (v/v) ratio. Mobile phase- A was prepared by adding 1.0 ml of Ortho-phosphoric acid in 1000 ml HPLC grade water and filtered through a 0.45 µm nylon membrane (Millipore Pvt. Ltd, Bengaluru, India) and degassed in an ultrasonic bath.
2.4 Diluent preparation:Mobile phase used as diluent.
2.5 Standard Preparation: The Standard stock solution prepared in 50 ml volumetric
flask by dissolving 225.54 mg of Thiophante-methyl (98.3%), 255.74 mg of Fipronil (98.6%) and 27.90 mg
of Pyraclostrobin (99%) standard in 10 ml of diluent. This solution then sonicated for 10 minutes and diluted to volume with diluent. Further 5 ml of this solution is taken in 50 ml volumetric flask and made up to mark with the diluent. This standard solution contains 0.443 mg/ml of Thiophante-methyl, 0.504 mg/ml of Fipronil and 0.0552mg/ml of Pyraclostrobin. 2.6 Sample Preparation:Sample solution was prepared by taking about 100 mg of sample in 50 ml volumetric flask and about 10 ml of diluent was added and sonicated for 10 minutes with intermittent shaking. The content was brought back to ambient temperature and diluted to volume with diluent. The sample was filtered through 0.45µm nylon syringe filter.
2.7 Chromatographic condition: Method involves use of Poroshell 120 EC-C18 (Agilent Tech) column with length of100 mm, internal diameter 4.6 mm and 2.7 µm particle size of stationary phase.The column oven temperature maintained at 30°C throughout the analysis.Different compositions of mobile phase tried in isocratic mode. Mobile Phase-A: Mobile Phase-B 0.1 % OPA: Acetonitrile (40:60 v/v) was selected which gave good resolution. The flow rate was maintained at 0.75 ml/min and detection at 275 nm was carried out with injection volume of 1µl.
2.8 Initial analysis of sample: Sample was analyzedin accordance with section 2.5-2.7 and results were tabulated in table 1.
Table 1.
Results of initial analysis
Sr.
No
Ingredients
Active Ingredient content (A.I)
Specific Gravity (Sp.Gr.)
g/L
% m/v
1
Thiophanate-methyl
232.8
23.28
1.223
2
Fipronil
245.8
24.58
2.9
Calculation:
Active content (%m/v) for Thiophante-methyl/ Fipronil / Pyraclostrobin
III.
RESULTS AND DISCUSSION
3.1
Development and optimization of UPLC
Method:
In the present work, an analytical method
based on UPLC using PDA detector has been
developed and validated for the quantification of
Thiophanate-methyl, Fipronil and Pyraclostrobin in
pesticide formulation. The analytical condition
were selected, keeping in mind the different
chemical nature of Thiophanate-methyl, Fipronil
and Pyraclostrobin [21]. The development trials
were taken by using the degraded sample of each
component was done, by keeping them in various
extreme conditions.
The column selection has been done on the basis of
back pressure, resolution, peak shape and day to
day reproducibility of retention time. After
evaluating all these factors, Agilent make Poroshell
120 EC C18 (100 mm x 4.6 mm, 2.7 µm particle
size) column was found to be giving satisfactory
results. The selection of mobile phase is based on
the chemical structure of three actives. The acidic
pH range was found suitable for solubility,
resolution, stability and peak shape of three
components. Considerably good results were
obtained with 0.1 % Ortho-phosphoric acid
solutions as mobile phase-A. For the selection of
organic constituents of mobile phase-B, acetonitrile
was chosen to reduce the longer retention time and
to attain good peak shape. Finally the mobile phase
composition consisting of in Mobile phase-A (0.1%
OPA): Mobile phase-B (Acetonitrile) in 40:60 v/v
ratio. Optimized proportion of mobile phase has
shown good resolution between
Thiophanate-methyl, Fipronil and Pyraclostrobin and also the
degradation product which generated during forced
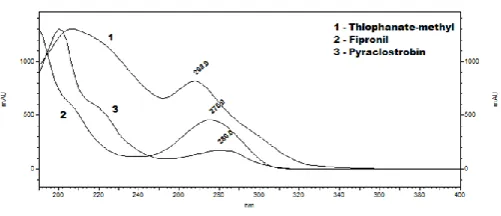
degradation study. Wavelength selection and PDA
scan graph are given in figure 4.
Figure 4.
Wavelength scan overlay of standard
preparation
4. Forced degradation study (Stress Study) and stability indicating test
In order to determine the stability indicating power of analytical method for quantification of Thiophanate-methyl, Fipronil and Pyraclostrobin, the various stressed conditions to be conducted for forced degradation studies as per ICH guidelines [22, 23]. The used forced degradation conditions, stress agent concentration and times of stress, were found to affect degradation, preferably 1% to 20% and not complete degradation of active materials. The discovery such conditions was based on trial and error. Refer Table 2 for % degradation (%m/v) in each stress conditions. 4.1 Acidic condition: Acidic degradation study was performed by taking about 100 mg of sample in 50 volumetric flask and added 5 ml of 0.1N HCl and kept for 2 hours at room temperature. After 2 hours sample was neutralized with 0.1N NaOH, diluted with diluent and filtered through 0.45µ nylon syringe filter and injected.
NaOH and kept for 2hours at room temperature. After 2 hours sample was neutralized with 0.1N HCl, diluted with diluent and filtered through 0.45µ nylon syringe filter and injected.
4.3 Oxidative condition: Oxidative degradation study was performed by taking about 100 mg of sample in 50 volumetric flask and added 5 ml of 5% H2O2 and kept for 15 minutes at room temperature. After 15 minutes sample was diluted with diluent and filtered through 0.45µ nylon syringe filter and injected. 4.4 Thermal condition: Thermal degradation was performed by exposing formulation sample at 54°C for
14 days, also known as Accelerated Heat Study (AHS). About 100 mg of sample taken in 50 volumetric flask diluted with diluent, sonicate and filtered through 0.45µ nylon syringe filter and injected.
4.5 Photolytic condition: Photolytic degradation study was performed by exposing formulation sample to sunlight for 14 days. About 100 mg of sample taken in 50 volumetric flasks diluted with diluent, sonicate and filtered through 0.45µ nylon syringe filter and injected.
Table 2:
Results of Forced degradation study
Active Ingredient Content (A.I) (% m/v)
Condition
Thiophanate-methyl
Fipronil
Pyraclostrobin
Degradation
Degradation
Degradation
Initial
23.28
---
24.58
---
2.61
---
Acidic
21.23
2.05
22.00
2.58
2.34
0.27
Alkaline
14.58
8.70
21.86
2.72
2.33
0.28
Oxidative 20.49
2.79
22.92
1.66
2.45
0.16
Thermal
23.25
0.03
24.59
-0.01
2.67
-0.06
Photolytic 23.42
-0.14
24.45
0.13
2.13
0.48
5.
Method validation
The method validation was carried out as per
ICH guidelines [24] and SANCO guidelines [25].
Various method validation parameters were
performed [26].
5.1
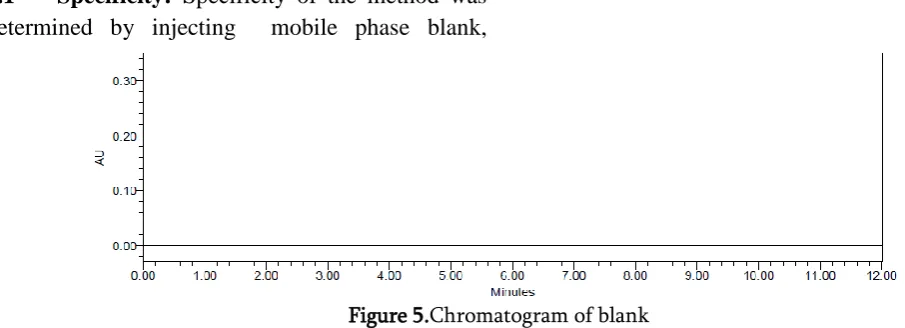
Specificity:
Specificity of the method was
determined by injecting mobile phase blank,
formulation blank, Thiophanate-methyl standard,
Fipronil standard, Pyraclostrobin standardand
sample solution. Since there was no interference
between the peaks of active ingredients in standard,
sample as well as in mobile phase blank and
formulation blank (placebo). Also peak purity was
found satisfactory. Refer figure 5-8.
Figure 6.Chromatogram of placebo
Figure 7.Chromatogram of standard preparation
Figure 8.Chromatogram of sample preparation
5.2 System Suitability: System suitability is integral part of method validation. % RSD of retention times and peak area of six replicate injections of standard solution were less than 1.0 %.( Refer Table 3).
Table 3.System Suitability of standard solution
Parameters Results Limits
Thiophanate-methyl Fipronil Pyraclostrobin
% RSD of retention time 0.27 0.18 0.23 < 1.0
% RSD of peak area 0.28 0.26 0.31 < 1.0
× 0.67
Table 4.Acceptable % RSD values calculated by modified Horwitz Equation
Sr. no. Compound % Analyte(m/v) Analyte Ratio (C) % RSD (calc.)
1 Thiophanate-methyl 25 0.25 1.65
2 Fipronil 22.5 0.225 1.68
3 Pyraclostrobin 2.5 0.025 2.33
The results of precision study was expressed as % RSD and was tabulated in Table 5.
Table 5.Results of Precision studies
Thiophanate-methyl Fipronil Pyraclostrobin Intraday Inter-day Intraday Inter-day Intraday Inter-day Mean (% m/v) 23.35 23.44 24.96 24.97 2.64 2.69
% RSD 0.70 0.43 0.90 0.42 0.83 0.86
5.4 Limit of Detection (LOD) and Limit of Quantitation (LOQ):The limit of detection and limit of quantitation were evaluated by serial dilutions of Thiophanate methyl, Fipronil and Pyraclostrobin from standard stock solution. The solution was injected 6 times and % RSD calculated. If % RSD was less than 10%, then this level termed LOQ. If % RSD exceeds 10%, then this level termed LOD. Table 5 showing LOD and LOQ values. Refer Table 6.
Table 6.Limit of Detection and Limit of Quantitation study Thiophanate-methyl
(mg/ml)
Fipronil (mg/ml)
Pyraclostrobin (mg/ml)
Limit of Detection 0.00017 0.00101 0.00022
Limit of Quantitation 0.00035 0.00202 0.00035
5.5 Linearity: The linearity was evaluated by measuring 6 different concentration levels from LOQ, 50%, 80%, 100%, 120 % and 150% of standard solution of Thiophanate-methyl, Fipronil and Pyraclostrobin. The linearity curve plotted concentration of standard (mg/ml) against mean peak areas and the correlation coefficient value was computed. The summary of the parameters shown in Table 7.
Table 7.Linearity study
Thiophanate-methyl Fipronil Pyraclostrobin
Linearity Range (mg/ml) 0.00038-0.661 0.00202-0.743 0.0004-0.091 Correlation Coefficient (R2) 0.9993 0.9997 0.9996
Slope (m) 3821287.33 1280229.84 5024705.09
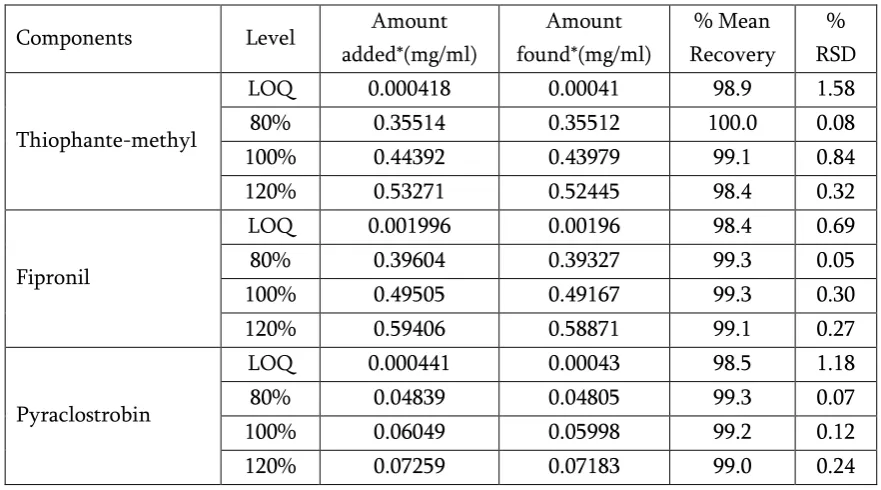
5.6 Accuracy and recovery:Accuracy (% Recovery) of analytical method was determined at four concentration levels by spiking known amount of pure actives in placebo i.e. LOQ, 80%, 100% and 120%. The accuracy was calculated as % of recovery. The mean recovery results were tabulated in Table 8.
Table 8.Results of accuracy study
Components Level Amount
added*(mg/ml)
Amount found*(mg/ml)
% Mean Recovery
% RSD
Thiophante-methyl
LOQ 0.000418 0.00041 98.9 1.58
80% 0.35514 0.35512 100.0 0.08
100% 0.44392 0.43979 99.1 0.84
120% 0.53271 0.52445 98.4 0.32
Fipronil
LOQ 0.001996 0.00196 98.4 0.69
80% 0.39604 0.39327 99.3 0.05
100% 0.49505 0.49167 99.3 0.30
120% 0.59406 0.58871 99.1 0.27
Pyraclostrobin
LOQ 0.000441 0.00043 98.5 1.18
80% 0.04839 0.04805 99.3 0.07
100% 0.06049 0.05998 99.2 0.12
120% 0.07259 0.07183 99.0 0.24
* Each value corresponds to the mean of three determinations.
5.7 Stability of solutions: The stability of standard solution and sample solution was test for an intervals 24 h, 48 h and 72 h. at ambient temperature. There were no any significant changes observed in peak areas and assay values. It was concluded that the standard and test preparation was found stable up to 72 hours at ambient temperature.
5.8 Robustness:The robustness of the method was studied by determining effects of small variation of flow rate (0.75 ± 0.05 ml/min),mobile phase composition 0.1% OPA: Acetonitrile (40±5: 60 ±5) and column temperature (30°C ± 5°C) were performed. It was found that % m/v values were unaffected after these small variations.
6 Uncertainty in measurement (U): Uncertainty of method was measured through the data of uncertainty due to Repeatability, Calibration uncertainty of equipment or glassware, Readability of equipment, CRM purity of concentration, Linearity of calibration curve and Recovery of the analyte. The Combined Relative Uncertainty (Uc) and Expanded Uncertainty (U) were calculated [27]. Refer Table 9
Table 9.Calculated Combined and Expanded Uncertainty
Components Mean Value (% m/v) (n=20)
Combined Relative Uncertainty (Uc)
Expanded Uncertainty (U) (% m/v)
Thiophanate-methyl 23.37 0.006604 ± 0.30
Fipronil 24.84 0.007669 ± 0.37
IV.
CONCLUSION
A simple, specific and reliable UPLC method has been developed for quantification of Thiophanate-methyl, Fipronil and Pyraclostrobin in their pesticide formulation. Stress study showed that all degradation products were well separated from Thiophnate-methyl, Fipronil and Pyraclostrobin peaks confirming its stability indicating power. Method validation study showed that the method is specific, linear, accurate, robust and easily reproducible. This method is also useful for quantification of Thiophanate-methyl, Fipronil and Pyraclostrobin in their single or combination formulated products with different strengths and different formulation types. This method can also useful for analysis of environmental samples (soil, water), agricultural products for pesticide residue analysis of same actives but required additional extraction procedure. Hence developed method can be adopted to regular quality control analysis of production samples and stability samples, environmental samples.
V.
ACKNOWLEDGMENT
The authors are thankful to School of Basic and Applied Science, Raffles University, Rajasthan, India for encouragement and permission for publication.
VI.
REFERENCES
[1]. Tomlin,C. D. S. The Pesticide Manual (15 ed.),
BCPC.
[2]. Hangping Chen, Xin Liu, Chunapi Wang,
Quinghua Wang, Ying Jiang, Peng Yin and LI Zhu.
(2014). Simultaneous Determination of
Thiophanate-Methyl and its Metabolite
Carbendazim in Tea using Isotope Dilution Ultra Performance Liquid Chromatography-Tandem Mass Spectrometry. Journal of Chromatographic Science, 52, 1157-1164.
[3]. Monika Skowron, Witold Ciesielski. (2008).
Determination of Thiophate Methyl using Iodine Azide Reaction. Chem. Anal.(Warsaw),53,133.
[4]. Yoshichika Hirahara, Mika Kimura, Tomoko
Inoue, Seiji Otani, Asami Haganuma, Nobuyuki Matsumoto, Asumin Hirata, Shiho Maruyama, Tomomi Lizuka, Masaho Ukyo, Mitsue Ota, Hideaki Hirose, Soauke Suzuki, and Yukinori Uchida (2005). Validation of Multiresidue Screening Methods for the Determination of 186 Pesticides in 11 Agricultural products using Gas Chromatography (GC).Journal of Health Science 51(5), 617-627
[5]. C.Sanchez-Brunete, E. Miguel, B. Albero and J.L.
Tadeo. (2008). DeterminationOf Fipronil residues in Honeyand Pollen by Gas Chromatography. Spanish Journal of Agriculture Research, 6(Special issue),7-14
[6]. Marcia H. S. Kurz, Samile Marte, Fabio F,
Gonçalves, Osmar D. Prestes, Manoel L. Martins, Renato Zanella, Martha B. Adaim. (2013). Development of a fast method for the determination of the insecticide fipronil and its metabolites in environmental waters by SPE and GC-ECD. Journal of Brazilian Chemical Society, 24 (4)
[7]. Satoshi Takatori, Mashiro Okihasi, Yoko Kitagawa,
Naoki Fukui, You Kakimoto-Okamoto and Hirotaka Obana. (2011, Jan 21). Rapid and Easy
Multiresidue Method forDetermination of
Pesticide Residues in Foods Using Gas or Liquid
Chromatography-Tandem MassSpectrometry.
Retrieved from http://intechopen.com
[8]. Abir Kouzayha, Abdul Rahman Rabba, Mohamad
[9]. Fillion, J. (2000). Analytical Methods for Residual
Compositional Substances of Agricultural
Chemicals, Feed Additives and Veternary Drugs in Food. Journal of AOAC Int., 83, 698-713
[10]. Nataliya Vasylieva, Ki Chang Ahn, Bogdan
Barnych, Shirley J.Gee and Bruce D. Hammock (2015). Development of Immunoassay for the Detection of the Phenyl Pyrazole Insecticide Fipronil. Environmental Science Technology, 49, 10038-10047.
[11]. Yara P. Cid, Thais P. Ferreira, Deborah M. V. C. Medeiros, Rodrigo M. Oliveira, Nathalia, C.C. Silva, Vivane S. Magalhaes, Fabio B. Scott. (2012). Quimica Nova, 35(10). Sau Paulo.
[12]. Elena Gabriela Oltean, A. Nico.(2011).
Development and Validation of a RP-HPLC method for the quantitation studies of Fipronil in parakill suspensions. Veternary Drugs, 5(2).
[13]. CIPAC (2001), Fipronil method-581, J, 60-65.
[14]. Michael S. Young, Kim Van Tran, Jeremy C. Shia
(2015, August). Multiresidue Analysis in Tea: Optimized Cleanup after QuEChERS Extraction for UPLC-MS/MS and GC-MS/MS Analysis.
Retrieved from Waters Corporation
http://www.waters.com/Application
Note-70004819
[15]. Pual Silcock, Gareth Booth, James Morphet,
Eleanor Riches and Peter Hsncock. Waters Application Note 720003465EN. Manchester, UK.
[16]. CIPAC (2009), Pyraclostrobin method-657, M,
171-173.
[17]. Ragubabu K. Tentu Nageswara Rao, T. B. Patrudu
and D. Sreenivasulu. (2012). Determination of Fungicide Residues in grapes using
high-performance liquid chromatography with
ultraviolet detection. Int. J. Cur.Tr.Res. 1(2), 59-64
[18]. T. Nageshwar Rao, A. Ramesh, T. Parvathamma
and G. Suresh. (2012). Development and Validation of HPLC-UV method for simultaneous determination of Strobilurin Fungicide residues in tomato fruit followed by Matrix-Solid Phase Dispersion (MSPD). Indian J. Sc. Res, 3(1), 113-118
[19]. Derick Lucas (2013, December). Optimizing
Residues in Herbal Tea. Retrieved from Agilent
Technologies Inc.
http://www.agilent.com/chem/Application Note-5991-3728EN.
[20]. David R. Backer, Chris Titman, Alan J. Barns, Neil
J. Loftus, Alexander Mastoroudes, Simon Hird (2013). Multiresidue Analysis of 210 Pesticides in food samples by Triple Quadrupole UHPLC-MS/MS. Retrieved from Shimadzu Corporation, Technical report. http://www.shimadzu.com/an/
[21]. Lloyed R. Snyder, Joseph J. Kirkland, John W.
Dolan (2010). Introduction to Modern Liquid Chromatography (3ed.), John Wiley & Sons.
[22]. ICH," Stability of New Drug Substances and
Products," International Conference on
Harmonization Guidance Documents, 2005, Q1A.
[23]. ICH," Photo-stability Testing of New Drugs
Substances and Products,’ International
Conference on Harmonization Guidance
Documents, 2005, Q1B.
[24]. ICH," Validation of Analytical Procedures: Text and Methodology," International Conference on Harmonization Guidance Documents, 2005, Q2 (R1).
[25]. SANCO/3030/99 guidelines (2004). “Guidelines for
validation of analytical methods for non-agricultural pesticide active ingredients and products".
[26]. Joachin Ermer, John H. McB. Miller (2005).
Method Validation in Pharmaceutical Analysis. Wiley-VCH
[27]. National Accreditation Board for Testing and
Calibration Laboratories (NABL) “Guidelines for Estimation and Expression of Uncertainty in
Measurement". NABL 141 (2016).