Student Learning Styles And Performance
In An Introductory Finance Class
Daniel Alan Seiver, San Diego State University, USA Kamal Haddad, San Diego State University, USA
Andrew Do, San Diego State University, USA
ABSTRACT
Many academic disciplines have examined the role that variation in Jungian personality types plays in the academic performance of college students. Different personality types tend to have different learning styles, which in turn influence student performance in a variety of college courses. To measure the impact of learning styles on student performance in the introductory finance course, we administered an online Myers-Briggs Type Indicator (MBTI) test to students and then used regression analysis to measure the effects of different learning styles on course performance. We found several significant effects, which have implications for the teaching of introductory finance.
Keywords: Myers-Briggs; MBTI; Learning Styles; Introductory Finance
INTRODUCTION
arl Jung’s 1921 Theory of Personality (DeLaszlo, 1959) described how individuals interpret and interact with the world, using three dichotomous “temperament” dimensions: Introversion/Extraversion,1 Intuition/Sensation, and Thinking/Feeling. Myers and Briggs (Myers, 1995, 1998) added a fourth dimension, Judging/Perceiving, and quantified all four with a personality test now commonly known as a Myers-Briggs Type Indicator (MBTI). While other categorizations of learning styles exist, including the Gregorc (Gentry & Helgesen, 1999) and Kolb’s LSI (Fox & Bartholomae, 1999), many hundreds of papers have been published applying MBTI to almost every facet of modern life, including performance in various subjects in college. To familiarize the reader with the Myers-Briggs approach to personality, a compact description of each dichotomous MBTI dimension appears in Table 1, which is reproduced from Table 1 of Filbeck, Hatfield, and Horvath (2005). Each personality dimension can be observed with any of the others, so that 16 (2x2x2x2) possible combinations of MBTI learning styles are possible. These combinations are normally referred to by the letters in Table 1: as an example, a Myers-Briggs ENTJ is an extraverted, intuitive, thinking, judger. In many cases, students’ learning styles, as measured by the four dimensions of the MBTI, have been shown to have significant effects on academic performance in a variety of courses. For example, a recent study by Ashraf et al. (2013) of finance majors showed that S students earned lower grades in a valuation of financial assets course than N students. Russo et al. (2013) also showed that N students outperformed S students in a managerial accounting course. In non-business disciplines, O’Brien et al. (1998) concluded that N types outperformed S types in an engineering course. Cano (1999) reported higher academic performance for T compared to F students in agricultural science. Tharp (1992) concluded that in a human physiology class, I students received higher grades than E students, and that S students earned the highest grades. Felder and Brent (2005) documented superior performance in chemical engineering for J students over Ps, as did Dirienzo et al. (2010) for Business majors. In this paper, we will demonstrate the significant effects that MBTI learning styles have on student performance in an introductory finance class at a large state university.
Table 1: Personality Dimensions Measured by the Myers-Briggs Type Indicator Extraversion (E) --- Individuals focus attention on the outer
world of people and things. They draw energy from interacting and being engaged and so learn most effectively when they are engaged in activity.
Introversion (I) --- Individuals focus attention on their inner world. They draw energy from internal reflection, and so learn best through reflecting and understanding the context of a problem before being engaged.
Sensing (S) --- Individuals focus on the concrete aspects of a situation and value what can be seen, touched, felt, smelled, or heard. They tend to be practical minded, concerned with details and facts, and have greater acceptance of what is given.
Intuition (N) --- Individuals focus on the abstract, and value relationships not immediately recognizable to the physical senses. They strive to understand the “big picture” and are interested in change and future possibilities.
Thinking (T) --- Individuals focus on objective decision-making based on a desire for fairness. They seek logic in their analysis of situations, desire to achieve objectivity, and prefer to work to discover what may be wrong in situations that arise.
Feeling (F) --- Individuals focus on subjective decision-making based on a desire for harmony. They consider impacts on people in their analysis of a situation, prefer to affirm what is right with situations, and are more likely to offer appreciation and sympathy.
Judging (J) --- Individuals focus on leading a life that is organized and orderly, seek closure, prefer control over their lives, and plan accordingly.
Perceiving (P) --- Individuals focus on leading a life that is flexible and spontaneous, seek to keep decisions open, and prefer to adapt to situations rather than control them.
Source: Filbeck, Hatfield, and Horvath (2005)
Which learning styles might be advantageous in mastering the basic material of an introductory finance class? A typical catalog course description for Introduction to Finance reads like this: “Objectives of financial management. Financing the business enterprise. Internal financial management. Introduction to the cost of capital, valuation, dividend policy, leverage, international finance, and the techniques of present value and its applications. Sources of capital.” These topics have a highly theoretical bent, which we hypothesize should favor Intuitors (N), who take a more abstract and theoretical approach, compared to Sensing (S) individuals, who tend to be more practical and “hands on.” This expected advantage of N over S would be consistent with the studies of Ashraf (2013), Russo (2013), and O’Brien (1998) noted above. We also hypothesize that Thinkers (T), who look for logic, should be favored over Feelers (F), who are more subjective and “people-oriented.” This hypothesis is consistent with Cano (1999). We also hypothesize that those who are scored as Judging (J), with an emphasis on organization and planning, should have an advantage over Perceivers (P), who are more flexible and spontaneous, consistent with Felder and Brent’s (2005) review study, and DiRienzo et al.’s (2010) results for Business majors. (There is no obvious relation between E and I and finance, although some studies of students in other fields, like Tharp (1992), have shown significant effects.) In the following section, we review the finance-related literature on MBTI and student performance in detail. We discuss our data set in Section III, and test our hypotheses in Section IV. In Section V, we discuss some implications of our findings for the teaching of the introductory finance class.
RELEVANT LITERATURE
students outperformed N students on multiple choice quantitative test questions. They also found, at the 10% level of significance, that P students outperformed J students on multiple choice theory questions, and that I’s outperformed E’s on multiple choice theory and open-ended quantitative questions. While there is other published research on the academic performance of finance students, including in the introductory course, none of it considers learning style as a possible explanation (for example, see Didia & Hasnat, 1998; Johnson et al., 2002; Rich, 2006; Wilson, 2002). Ardalan (2006) does refer to MBTI learning styles in introductory finance, but does not present any statistical results. Much more academic research on learning style and academic performance has focused on economics, the parent discipline of finance, and engineering, which is even more quantitative. The most thorough study of economics students has been undertaken by Ziegert (2000). Using several measures of student learning, one of Ziegert’s strongest findings was that T students outperformed F students in microeconomics. Swope et al. (2006) using a large data longitudinal dataset for economics majors at the United States Naval Academy, found that J economics majors significantly outperformed P economics majors over the entire curriculum. In engineering, a review of studies by Felder and Brent (2005) noted that in a longitudinal study of students in chemical engineering courses at North Carolina State University, Thinkers (T) outperformed Feelers (F) by a large margin in the engineering curriculum and Judgers (J) consistently outperformed Perceivers (P). We should also note that Briggs (1995) herself suggested that NT students would thrive in several academic areas, including “the higher levels of finance,” which she considered to be more theoretical than practical.
OUR DATA
In order to test the above hypotheses on students in the introductory finance class, we collected data on 99 students in three sections of Finance 323, Introduction to Finance, at a large California state university, in the spring semester of 2012. All sections were taught by the same professor to control for the confounding effects of textbook, teaching style, and testing and grading philosophy. Each student took a 72-question online version of the MBTI (www.Humanmetrics.com) near the end of the semester and transmitted the results to us.2 Table 2 shows the frequency distribution by MBTI categories of our sample compared to the overall population. The overall population averages are drawn from the Center for Applications of Psychological Type (2012), using the midpoints of their estimates.
It is clear that these introductory finance classes do not look like the MBTI averages. The most striking difference is that J types vastly outnumber P types. The most common groupings in our sample are ENFJ, ENTJ, ESFJ, INTJ, and ESTJ. These five types account for well over 50% of our entire sample, compared to 31% in the US. In addition, there are only 6 FPs (6%) in our sample, as opposed to 25% in the US population. If the descriptions of types in Table 1 are at all accurate, this skewed result no doubt reflects strong self-selection by students. Other investigators have reported similar results. Myers (1980) reports this kind of skewedness in her data, Booth and Winzar (1993) reported similar data for accounting majors and Ziegert’s (2000) economics sample also had over 50% of her observations in the same five types reported above. Ashraf et al. (2013) also report a dearth of P’s in their sample. While Dirienzo et al. (2010) do not report such skewed type distribution, their “Business” category includes only the majors business administration, economics, and accounting. Even with our skewed sample, we can still test the hypotheses that N, T, and J students outperform S, F, and P students. There are many S types in our sample, and it may be that the small number of P types have unmeasured skills that enable them to compete in finance with the J’s.
2 The students were offered a small amount of extra credit for taking the MBTI and submitting it to us via email. Thus our sample is
Table 2: Sample Frequencies of Types and Estimated Frequencies of MBTI Types in the United States Population ISTJ 7.1% 12.5% ISFJ 7.1% 11.5% INFJ 2.0% 2.0% INTJ 12.1% 3,0% ISTP 0.0% 5% ISFP 1.0% 7% INFP 1.0% 4.5% INTP 1.0% 4.0% ESTP 1.0% 4.5% ESFP 1.0% 6.5% ENFP 3.0% 7.0% ENTP 3.0% 3.5% ESTJ 8.1% 10.0% ESFJ 13.1% 11.0% ENFJ 23.2% 3.5% ENTJ 16.2% 3.5%
Source: CAPT (2012). Note: Sample frequencies in bold, and US frequencies in italics.
OUR RESULTS
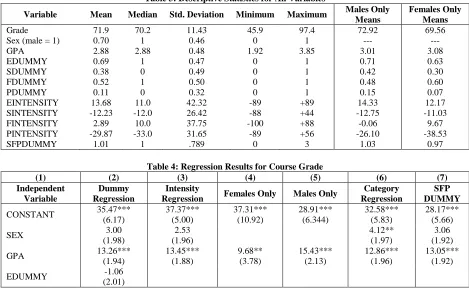
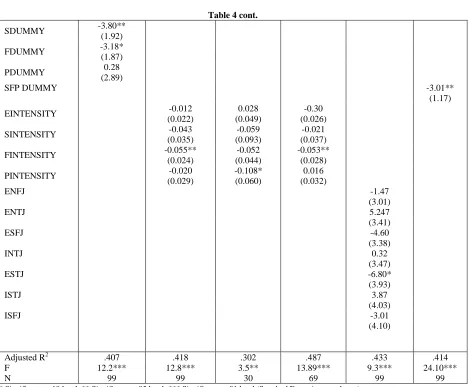
The simplest test of the predictive value of the MBTI categories is a regression of student numerical course grade on each of these four dichotomous categories, with each represented as a 0/1 dummy. For example, EDUMMY is equal to 1 if the student is coded as E, SDUMMY is coded as 1 if the student is coded as S, and so on for FDUMMY and PDUMMY. We have added controls for sex (male = 1) and GPA, since both have been shown to have significant impacts on performance in finance (Didia & Hasnat, 1998), as well as many other fields. Also, as Ziegert (2000) and others have pointed out, population percentages of the T/F dichotomy are sharply skewed by sex, with approximately 70% of females classified as F, while 60% of males are classified as T (CAPT, 2012). In our sample, however, females are 60% F (40% T), while males are 52% T (48% F). It thus appears that some F women (and perhaps T men) have also self-selected out of the introductory finance class. We perform separate regressions for each sex to measure gender differences. Descriptive statistics for all the variables in our data set appear in Table 3. The results of the simple dummy regressions appear in column (2) of Table 4.
Table 3: Descriptive Statistics for All Variables
Variable Mean Median Std. Deviation Minimum Maximum Males Only
Means
Females Only Means
Grade 71.9 70.2 11.43 45.9 97.4 72.92 69.56
Sex (male = 1) 0.70 1 0.46 0 1 --- ---
GPA 2.88 2.88 0.48 1.92 3.85 3.01 3.08
EDUMMY 0.69 1 0.47 0 1 0.71 0.63
SDUMMY 0.38 0 0.49 0 1 0.42 0.30
FDUMMY 0.52 1 0.50 0 1 0.48 0.60
PDUMMY 0.11 0 0.32 0 1 0.15 0.07
EINTENSITY 13.68 11.0 42.32 -89 +89 14.33 12.17
SINTENSITY -12.23 -12.0 26.42 -88 +44 -12.75 -11.03
FINTENSITY 2.89 10.0 37.75 -100 +88 -0.06 9.67
PINTENSITY -29.87 -33.0 31.65 -89 +56 -26.10 -38.53
SFPDUMMY 1.01 1 .789 0 3 1.03 0.97
Table 4: Regression Results for Course Grade
(1) (2) (3) (4) (5) (6) (7)
Independent Variable
Dummy Regression
Intensity
Regression Females Only Males Only
Category Regression
SFP DUMMY
CONSTANT 35.47***
(6.17) 37.37*** (5.00) 37.31*** (10.92) 28.91*** (6.344) 32.58*** (5.83) 28.17*** (5.66)
SEX 3.00
(1.98) 2.53 (1.96) 4.12** (1.97) 3.06 (1.92)
GPA 13.26***
(1.94) 13.45*** (1.88) 9.68** (3.78) 15.43*** (2.13) 12.86*** (1.96) 13.05*** (1.92)
EDUMMY -1.06
Table 4 cont.
SDUMMY -3.80**
(1.92)
FDUMMY -3.18*
(1.87)
PDUMMY 0.28
(2.89)
SFP DUMMY -3.01**
(1.17)
EINTENSITY -0.012
(0.022)
0.028 (0.049)
-0.30 (0.026)
SINTENSITY -0.043
(0.035)
-0.059 (0.093)
-0.021 (0.037)
FINTENSITY -0.055**
(0.024)
-0.052 (0.044)
-0.053** (0.028)
PINTENSITY -0.020
(0.029)
-0.108* (0.060)
0.016 (0.032) ENFJ
ENTJ
-1.47 (3.01) 5.247 (3.41) ESFJ
INTJ
ESTJ
ISTJ
-4.60 (3.38)
0.32 (3.47) -6.80* (3.93) 3.87 (4.03)
ISFJ -3.01
(4.10)
Adjusted R2 .407 .418 .302 .487 .433 .414
F 12.2*** 12.8*** 3.5** 13.89*** 9.3*** 24.10***
N 99 99 30 69 99 99
* Significant at .10 level; ** Significant at .05 level; *** Significant at .01 level (Standard Errors in parentheses)
GPA is a highly significant determinant of course grade. Males have a modest but not statistically significant advantage in introductory finance, independent of personality type (cf. Ziegert, 2000), and better students, as measured by GPA, perform better in finance. A 1-point increase in GPA raises the finance grade by approximately a whole letter grade. Yet even controlling for sex and GPA, S types are at a significant disadvantage relative to N types, and F types are at a significant disadvantage relative to T types, with each earning about a 1/3 of a letter grade lower after controlling for gender and GPA. Intuition trumps Sensing, and Thinking appears to trump Feeling in finance. NTs tend to be much more analytical, which we show is indeed an advantage in finance. In the simple dummy regression, neither the E/I dichotomy nor the P/J dichotomy seems to matter. P/J insignificance may simply reflect the overall scarcity of P’s in the introductory course.
scores ranging from 1 to 100, with 100 the maximum intensity for a trait. Humanmetrics calculates this intensity simply by comparing the number of answers which code as each subcategory. For example, with about 18 E vs. I questions, 18 E answers would generate an E intensity of 100%, while 10 E and 8 I answers would generate E intensity of about 20%, and 18 I answers would generate I intensity of 100%. We have recoded these scores on a continuum from -100 to +100 for each MBTI pairing of E/I, S/N, F/T, and P/J. Thus a student tested as an extreme introvert would be coded as -100 on the E/I intensity scale, while a student tested as extreme extravert would be coded as +100, and every other intermediate intensity would fall on this continuum. We then reran our regressions with these intensity variables substituted for the dichotomous dummies. The results of these regressions are reported in column (3) of Table 4.
Not surprisingly, GPA remains highly significant, with gender again positive but insignificant. FINTENSITY is highly significant, which mirrors the dummy variable regression, but SINTENSITY now has no explanatory power. These results provide little support for Pittenger’s claim, suggesting that there is very little information thrown away in the simple dichotomies, which is the argument made by many proponents of Myers-Briggs testing. There is more support for Pittenger’s claim in the regression results by gender, reported below.
We divided the sample into males and females and reran the intensity regression.3 These results appear in columns (4) and (5) of Table 4. What is striking is that the T/F dichotomy only affects males, while the J/P dichotomy, previously insignificant, now is significant, but affects only females. This result suggests that female P’s and male F’s are at a disadvantage in finance. Overall, the results support our original hypothesizing that S, F, and P-types are at a disadvantage in finance classes, with N, T, and J-types, already heavily represented in finance, at an advantage.
Since many MBTI researchers concentrate on the detailed 16 categories of learning styles, we have also regressed course grade on the seven largest categories in our sample: ENFJ, ENTJ, ESFJ, INTJ, ESTJ, ISTJ, and ISFJ. The results appear in column (6) of Table 4.4 Although gender is now significant in addition to GPA, the individual categories are almost uniformly statistically insignificant, with the exception of ESTJ. While ESTJ is negative, we also note that ENTJ is almost significantly positive, suggesting that all we have found here is the disadvantage accruing to S versus N types.
Column (7) reports a final test of the combined hypothesis of the disadvantage of S, F, and P for finance students. Here we have created a dummy variable which is the sum of the dummy variables for the underperforming categories of S, F, and P. The dummy ranges in value from 0 (which is a NTJ student) to 3 (which is the rare SFP student). The SFP dummy is highly significant at the 2% level, and the adjusted R2 of the regression is about the same as the dummy variable and intensity regressions in columns (1) and (2). In course grade terms, having all three characteristics (S, F, and P) costs about a full letter grade in the course. Can finance faculty modify pedagogy to help these students?
IMPLICATIONS FOR FINANCE PEDAGOGY
Finance faculty, particularly in the introductory course, may be accustomed to teaching TJ’s and especially NTJ’s, who are well organized, deal easily with abstract theory, and work well on their own (Myers, 1998). Our findings confirm previous studies such as Ashraf (2013) and Russo (2013) that N students do indeed have an advantage in finance compared to S students. Our result that T’s outperform F’s is consistent with Cano’s (1999) agricultural science results, and Ashraf et al.’s (2013) learning level results in finance. Our sample suggests that P’s, who are outnumbered by J’s 89% to 11%, have mostly self-selected out of finance. Those few P’s who do take finance are disadvantaged if female. Yet the F’s, which are common in the introductory course, and the S’s, have learning styles which are not conducive to finance. Can faculty (who are likely to be NTJ’s, based on Ziegert’s (2000) admittedly small economics sample) modify standard pedagogy to help the disadvantaged groups? For the F’s, perhaps team projects, where their skills can complement the NTJ’s, may be helpful. It would not be surprising if teams formed by student choice resulted in NT’s teaming with NT’s, so faculty intervention to create teams with
divergent learning styles might be helpful. An additional benefit of mixing F’s and T’s in team projects could be cross-fertilization of learning style, so that, for example, an F learns a bit about how a T thinks, and could conceivably learn how to use T-style problem solving. The reverse may also be true. The F’s may also benefit to the extent that finance can be shown to have a human side. For example, a full discussion of the Madoff catastrophe and the subsequent suffering may engage the F’s in a way that “cost of capital” may not. Financial statements may come to life for F’s when they are related to the human costs of accounting debacles like Enron. Sensing (S) types, who also have a disadvantage, may benefit from hands-on experiments, and the concreteness of a Finance Lab, where these S’s can see financial markets in action in real time. In the absence of such a lab, a online semester-long stock-picking contest, which all students would enjoy, may be particularly attractive to the S-types in the class, since they can see the concrete results of debt/equity ratios, dividend policy, etc. Current events discussions during class time may also benefit the S’s desire for concreteness. For example, a discussion of a recent lottery winner’s choice between a lump-sum payment now and a series of payments over time could help drive home the principle of discounting for the “hands-on” S types. A variety of testing options (multiple choice and essay, rather than strictly problems) may also benefit the less-favored types. In general, professors may want to consider how to adjust their teaching, given that finance students learn in a variety of styles. It may also be true that the teaching style of the professor may help the performance of students with the same learning style. In any case, we recommend that faculty test themselves on the MBTI so they can determine their own learning style, and then come to grips with the variety of learning styles present in their classrooms. However, given the relative paucity of MBTI research in finance, we recommend that studies like this one be replicated at other universities.
AUTHOR INFORMATION
Daniel Seiver is a Lecturer in Finance at San Diego State University, where he teaches investments, international business finance, and financial literacy. He was a Professor of Economics at Miami University (Ohio) from 1978-2005. He has published more than 20 papers in finance, economics, education, and demography, and books on regional economic development (MIT Press) and investment strategy (Probus/Irwin). He was the recipient of the Most Influential Finance Faculty Member Teaching Award in 2007, and the Most Influential International Business Faculty Member Teaching Award in 2012. He received his PhD in Economics from Yale University. E-mail: [email protected] (Corresponding author)
Kamal Haddad is a Professor of Finance at San Diego State University, where he teaches corporate finance. He has over 50 published articles in finance, accounting, international business, and education. He was the recipient of the Most Influential Finance Faculty Member Teaching Award in 2002 and 2013, an Outstanding Faculty Contribution Award in 1999, the 1997 Lybrand Silver Medal Award, The International Federation of Accountants Award for Distinguished Contribution to Management Accounting in 1998, as well as several best paper awards. He received his PhD in finance from University of Nebraska-Lincoln.
Andrew Do is Professor of Finance and Director of Real Estate and Land Use Institute at San Diego State University. His research has been published in The Journal of Money, Credit and Banking, National Tax Journal, Real Estate Economics, The Journal of Real Estate Finance and Economics, The Journal of Real Estate Research, Journal of Economics and Business, and International Journal of Intelligent Systems in Accounting, Finance and Management. He has received the Most Influential Finance Faculty Member Teaching Award and an outstanding faculty contribution in research award. He has a PhD in Finance and an MBA.
REFERENCES
1. Ardalan, K. (2006). Learning styles and the use of the Wall Street Journal in the introductory finance course. Academy of Educational Leadership Journal, 10(2).
2. Ashraf, R., Fendler, R., & Shrikande, M. (2013). Impact of Personality types and learning styles on performance of finance majors. Journal of Financial Education, 39, 47-68.
3. Booth, P., & Winzar, H. (1993). Personality biases of accounting students: some implications for learning style preferences. Accounting & Finance, 33(2), 109-120.
5. Didia, D., & Hasnat, B. (1998). The determinants of performance in the university. Financial Practice and Education, 8(1), 102-107.
6. DiRienzo, C., Das, J., Synn, W., Kitts, J., & McGrath, K. (2010). The relationship between MBTI and academic performance: A study across academic disciplines. Journal of Psychological Type, 70(5), 53-67. 7. Felder, R. M., & Brent, R. (2005). Understanding student differences. Journal of Engineering Education,
94(1), 57-72.
8. Filbeck, G., & Smith, L. L. (1996). Learning styles, teaching strategies, and predictors of success for students in corporate finance. Financial Practice and Education, 6(1), 74-85.
9. Filbeck, G., Hatfield, P., & Horvath, P. (2005). Risk aversion and personality type. The Journal of Behavioral Finance, 6(4), 170-180.
10. Fox, J., & Bartholomae, S. (1999). Student learning style and educational outcomes: Evidence from a family financial management course. Financial Services Review, 8(4), 235-251.
11. Gentry, J., & Helgesen, M. M. (1998). Using learning style information to improve the core financial management course. (Working Paper). Bureau of Economics & Business Research. (98-110).
12. Hokanson, S. G. (2000). Individual cognitive styles of university students and acquisition of Spanish as a foreign language. Hispania, 511-520.
13. Johnson, D., Joyce, B., & Sen, S. (2002). An analysis of student effort and performance in the finance principles course. Journal of Applied Finance, 12(2).
14. Jung, C. G., & De Laszlo, V. S. (1959). The basic writings of CG Jung (Modern Library). New York. 15. Myers, I. B. (1998). Introduction to type: A guide to understanding your results on the Myers-Briggs Type
Indicator. Mountain View, CA: CPP, Inc.
16. Myers, I. B., & Myers, P. B. (1995). Gifts differing: Understanding personality type. Mountain View, CA: CPP, Inc.
17. O'Brien, T. P., Bernold, L. E., & Akroyd, D. (1998). Myers-Briggs type indicator and academic
achievement in engineering education. International Journal of Engineering Education, 14(5), 311-315. 18. Pittenger, D. J. (2005). Cautionary comments regarding the Myers-Briggs Type Indicator. Consulting
Psychology Journal: Practice and Research, 57(3), 210.
19. Rich, S. P. (2006). Student performance: Does effort matter? Journal of Applied Finance, 16(2), 120. 20. Russo, C. J., Mertins, L., & Ray, M. (2013). Psychological type and academic performance in the
managerial accounting course. Journal of Education for Business, 88(4), 210-215.
21. Swope, K. J., & Schmitt, P. M. (2006). The performance of economics graduates over the entire curriculum: The determinants of success. The Journal of Economic Education, 37(4), 387-394. 22. Tharp, G. D. (1992). Relationship between personality type and achievement in an undergraduate
physiology course. The American Journal of Physiology, 262(6), S1.
23. Wilson, A. (2002). Exogenous determinants of student performance in first finance classes. Financial Decisions, 14(1), 1-15.