324
Ecological Niche Modeling For Spatial-Temporal
Quantification Of The Changing Dynamics Of Malaria
Vector Distribution In Kenya Under Climate Change
Forcing
Jacinta S. Kimuyu, Nzioka J. Muthama, Sammy M. Musyoka
Abstract: A new study in Kenya has spatially quantified the paradigm shift in the current and future malaria vectors ecology by use of BIOCLIM True or False model with IPCC HADCM3 projected future climate under A2a scenario. The study was designed to correlate the effect of climate change as an explanatory variable, among other factors, on malaria vectors distribution in Kenya. There has been reported malaria cases in new Counties that were never malaria endemic zones, thus the study seeks to research on ecological changes that can be as a result of changing environmental factors to support malaria vectors to thrive in new areas. Predictive modeling was done to investigate the spatial-temporal vector distribution under different IPCC future climate projections. The period from 1950 – 2000 was treated as the current climate scenario to explain where malaria vectors are existing as per vector spatial presence data and the prediction of the ecological niches where the vectors would also be found to thrive. Ecological Niche Modeling demonstrated significant alteration in suitability of malaria vector habitats in Kenya from the current ecological zones by the years 2020, 2050 and 2080. Most of the current malaria ecological niches were found to remain suitable while others turned out to be unsuitable after projection although new malaria hotspots were found to emerge. Prediction by the year 2050 demonstrated an alarming expansion of suitable malaria ecologies. By 2080 the predictions showed that the suitable ecologies will start to revert similar to the earlier suitability as in the current climate. Therefore, climate change in Kenya will adversely affect the environment at an alarming rate by 2050, but beyond that there will be a level of stabilization, where further change will trigger reversal to the past climate. This change in unsuitable to suitable malaria habitats can negatively affect the national effort to fight malaria under the ongoing towards zero campaign if strategic planning overlooks the possible effect of climate change among other factors on future dynamics of malaria distribution in Kenya.
——————————————————
1 Introduction
The study was conducted in Kenya to investigate whether climate change to may create conducive environment for the transmission of malaria vectors to new geographical regions. The ecology of some disease vectors in Africa are likely to be altered by climate change, hence consequently affecting the spatial and temporal transmission of such vector borne diseases. Climatic factors have been reported to greatly influence the pattern and level of malaria transmission globally. Malaria is a killer disease mainly caused by five distinct species of plasmodium parasite, namely;
Plasmodium falciparum, Plasmodium vivax, Plasmodium malariae, Plasmodium ovale and Plasmodium knowlesi. The disease is transmitted from one affected individual to another by
Anopheline mosquitoes. An estimated 216 million episodes of malaria were reported in 2010 worldwide, mostly amongst children under 5 years in the African Region (WHO, 2010). The number of global malaria deaths was estimated to be 1,238,000 in 2010 (Murray et al., 2012). In Kenya for instance, analysis of environmental factors associated with the malaria vectors Anopheles gambiae and Anopheles funestus found that abundance, distribution, and disease transmission are affected in different ways by precipitation and temperature (Kelly-Hope et al., 2009). Although the incidence of malaria has reduced over much of East Africa (Stern et al., 2011), increased variability in disease rates has been observed in some high altitude areas (Chaves et al., 2012). Climate change could accelerate the rise in temperature and rainfall hence the spread of malaria in high altitude areas. The vectors‘ survival which is generally known to be above 180C would be enhanced, thereby increasing the possibility of malaria transmission. Temperature, rainfall and humidity are the most important climatic factors that directly affect malaria transmission. The ranges of minimum and maximum temperature greatly affect the development of the malaria parasite and its mosquito vector, which determines malaria transmission. Temperatures are higher around the equator where Kenya is located and are known to vary minimally throughout the year. Temperatures decrease progressively as
A2a, B2a has a lower rate of population growth, a smaller increase in GDP but more diverse technological changes and slower land-use changes. A2a storyline was used to describe the projected climate change in Kenya. The A2a storyline seemed more appropriate since demographic data has portrayed an upward trend for population growth rate in Kenya, hence adoption of the A2a storyline to model the future climate change impact on the malaria vector ecology (Kimuyu, J.S., 2015 pp 74-77). The method used in this research assumes that malaria vector presence is restricted to locations equally or more suitable than those at which the species has been observed. Therefore, the approach identifies the minimum areas in which malaria vectors occurs whilst ensuring that no localities at which the vectors have been observed are omitted (i.e. omission rate = 0 and sensitivity = 1). BIOCLIM True/False model is appropriate for presence-only data type. The obtained results from the model predictions showed that malaria vector distribution will spread to new areas that are continuous from the current suitable habitats with some isolated hotpots. Hence, malaria prevalence has been projected to threaten people in Kenya in areas which are not currently affected in Kenya.
1.1 Statement of the Problem
The National Malaria Strategy (2009–2017), launched by Kenya's Ministry of Public Health and Sanitation, identifies epidemic preparedness and response as a key approach to the containment of epidemics in Kenya. The National Malaria Strategy was developed in line with the Government‘s first Medium-Term Plan of Kenya Vision 2030 together with the Millenium Development Goals. Also, the strategy was drawn in partnership with Roll Back Malaria partnership goals and targets for malaria control. One of the drawn key strategic objectives and targets of the National Malaria Strategy was: to ensure that all malaria epidemic prone districts have the capacity to detect and the preparedness to respond to malaria epidemics annually by 2010 through capacity strengthening for epidemic preparedness and response. The WHO's Roll Back Malaria initiative notes that forecasting and early warning can reinforce local preparedness and allow authorities and communities to use cost-effective and timely control options to prevent excessive deaths. However, despite the known causal links between climate and malaria transmission dynamics, there is still much uncertainty about the potential impact of climate change on malaria at local and global scales (IPCC, 2007). This is because of several factors, namely; the paucity of concurrent detailed historical observations of climate and malaria, the complexity of malaria disease dynamics, and the importance of non-climatic factors in determining infection and infection outcomes. Given the large populations living in highland areas of East Africa, the limitations of the analyses conducted, and the significant health risks of epidemic malaria, further research is warranted. There has been an attempt to model the prevalence and distribution of malaria epidemic in Kenya, (Okara et al., 2010; Githeko et al., 2014). These studies did not investigate on Ecological Niche Modeling to project the future impact of climate change on malaria vector distribution. There
has been no attempt to correlate the vector presence data with the underlying environmental factors, and further investigate the impact of climate change on the vector ecology. Alongside weather monitoring and seasonal climate forecasts, other epidemiological and environmental factors are not incorporated into algorithms for malaria modeling to predict and project the future dynamics of malaria prevalence with climate change. Moreover, with the predicted change in climate, research on prediction models that integrates climate data and spatial-temporal changes is at its infancy. Therefore, this study seeks to address the existing gap in spatial-temporal modeling of malaria vectors by correlating the spatial distribution of main malaria vectors in Kenya with the underlying ecological conditions with respect to climate change. There is urgent need to spatially integrate timely environmental data, biological data and the IPCC projected climate change scenarios to quantify the prevalence and distribution of malaria. The main objective of the study was to investigate spatial-temporal effect of climate change on the distribution of main malaria vectors in Kenya. The specific objectives were; to model the spatial-temporal distribution of the main malaria vectors in Kenya, to determine through investigation the relationship between vector distribution and climate change and finally to project the future ecological niches for malaria vector occurrence in Kenya. The research questions that guided the study were structured as follows:
• Is climate change a contributory factor to changing dynamics of malaria vector distribution in Kenya?
• What parameters determine the most appropriate spatial model for malaria distribution and prediction analysis? • How does climate projection model and scenario change
affect the predicted distribution of malaria vectors?
2.
STUDY AREA
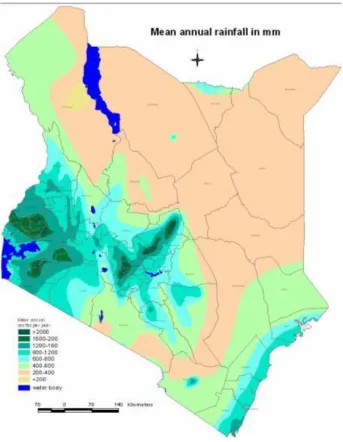
326 Figure 1: A map of Kenya showing the County boundaries and mean annual rainfall in mm
Source: http://www.infonet-biovision.org/res/res/files/3147.800x700.jpeg
3.
METHODS
3.1 Study Design
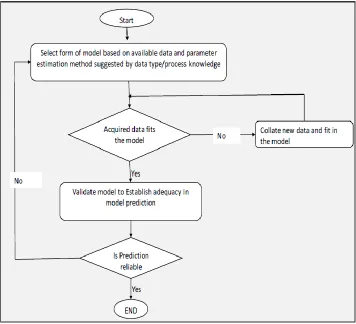
In order to model the spatial-temporal distribution of malaria vectors in Kenya, the model-building process entailed model selection, model fitting, and model validation. These three basic steps were applied iteratively until an appropriate model for the data to be analyzed was adopted. In the model selection step, plots of the data, process knowledge and assumptions about the process were used to determine the form of the model that was fit for the available data. Further to model selection, using the selected model and information about the data, an appropriate model-fitting method was used to estimate the unknown parameters in the model. When the parameter estimates were made, the model was then carefully assessed. The underlying assumptions of the analysis were qualitatively quantified for
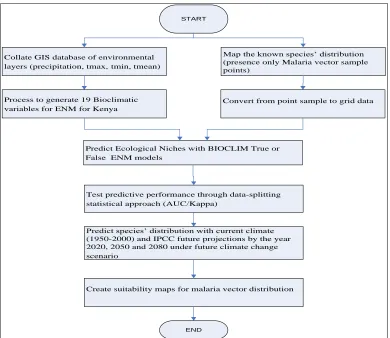
Figure 2: Flow diagram for the steps used in building species distribution model.
3.2 Data
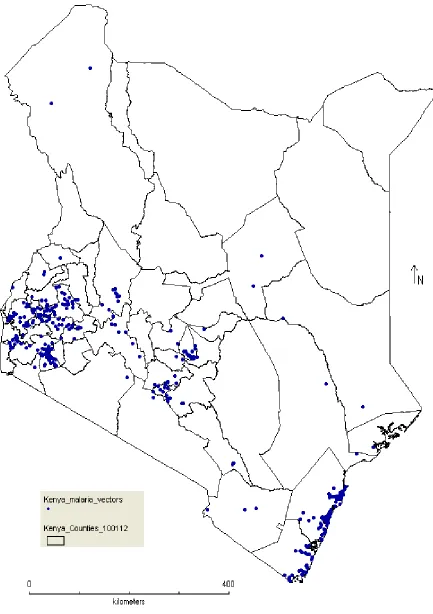
The adopted correlative species distribution model requires two types of data input: Biological data – describing the known species distribution and Environmental data – describing the landscape in which the species is found. For the biological data, the malaria vectors data acquired, as amassed by Okara et al., 2010 was primary empirical data from published and unpublished sources. From the obtained geo-located data for the period from 1990 to 2009, a total of 498 spatially unique descriptions of Anopheles vectors species across Kenya were identified. The malaria vectors included Anopheles arabiensis and Anopheles funestus which were the most widely reported at 244 and 265 spatially unique sites respectively with the former showing the most ubiquitous distribution nationally. Anopheles gambiae, Anopheles arabiensis, Anopheles funestus and Anopheles pharoensis were reported at sites located in all the transmission intensity classes with more reports of Anopheles gambiae in the highest transmission intensity areas than the very low transmission areas. The map in Figure 3 shows the distribution of the acquired data on malaria vectors presence in Kenya. Although the data was for different malaria vectors, they were modeled as one organism due to the limitation that the secondary published data from Okara et al., 2010 had not categorized the vectors into
their different species. Environmental data was acquired from the IPCC Third Assessment Report data for future climate projections calibrated and statistically downscaled using the WorldClim data for 'current' conditions taken as the period from 1950-2000. The obtained data was adopted as developed by Hijmans, et al., 2005 and comprised the interpolated climate surfaces for global land areas, at a spatial resolution of 30 arc seconds (often referred to as 1-km spatial resolution).Kenya Counties map was used as a mask to extract climate data from acquired ESRI grid format. Further processing of the data using ArcMap 10.1 and Diva GIS software was done to generate the 19 bioclimatic variables that were used for ecological niche modeling (Kimuyu, J.S., 2015). These bioclimatic variables represent:
annual trends (e.g., mean annual temperature, annual precipitation);
seasonality (e.g., annual range in temperature and precipitation); and
extreme or limiting environmental factors (e.g., temperature of the coldest and warmest month, and precipitation of the wet and dry quarters).
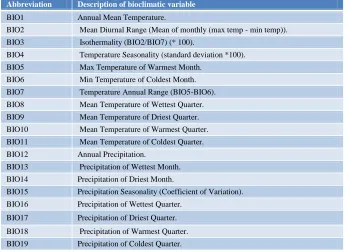
Table 1: Coding of bioclimatic variable
Abbreviation Description of bioclimatic variable
BIO1 Annual Mean Temperature.
BIO2 Mean Diurnal Range (Mean of monthly (max temp - min temp)). BIO3 Isothermality (BIO2/BIO7) (* 100).
BIO4 Temperature Seasonality (standard deviation *100). BIO5 Max Temperature of Warmest Month.
BIO6 Min Temperature of Coldest Month. BIO7 Temperature Annual Range (BIO5-BIO6). BIO8 Mean Temperature of Wettest Quarter. BIO9 Mean Temperature of Driest Quarter. BIO10 Mean Temperature of Warmest Quarter. BIO11 Mean Temperature of Coldest Quarter. BIO12 Annual Precipitation.
BIO13 Precipitation of Wettest Month. BIO14 Precipitation of Driest Month.
BIO15 Precipitation Seasonality (Coefficient of Variation). BIO16 Precipitation of Wettest Quarter.
BIO17 Precipitation of Driest Quarter. BIO18 Precipitation of Warmest Quarter. BIO19 Precipitation of Coldest Quarter.
3.3 Ecological Niche Modeling (ENM)
In this study, BIOCLIM true/false model was used because the data on presence of malaria vector distribution was available, which is the required input data for the chosen model. The modeling and prediction was done using Diva GIS software which is freeware. Climate data surfaces were extracted using Arcmap 10.1 software licensed by ESRI. The steps followed in data preparation for modeling and prediction can be summarized as follows:
1.) Future climate data was downloaded from WorldClim website (http://www.worldclim.org/futdown.htm)
2.) Using ArcMap 10.1, the downloaded global surface climate data (.BIL format) was converted to ESRI GRID format using conversion tools from raster to grid format.
3.) The next step was to extract the Kenya climate surface from the global ESRI GRID. This was done using ArcMap Spatial Analyst Tools to extract by mask the climate data for Kenya using the county boundaries map as the mask. The extracted climate surfaces were for minimum temperature, maximum temperature and precipitation.
4.) The extracted surfaces were exported to ASCII (.asc) format using ArcMap conversion tools. The data was ready for further processing using DIVA-GIS software to generate the 19 bioclimatic variables.
5.) Using DIVA-GIS software, the ASCII data was imported into multiple grid files (.grd format). A total of 36 grid files were imported.
6.) DIVA-GIS software was used to create climate data (.clm) which formed the climate data for Kenya.
7.) Using DIVA-GIS tools, the climate data was used to generate the 19 bioclimatic variables used for BIOCLIM true/false prediction. The extracted climate data was used to predict new suitable ecologies where a species is likely to occur, or would survive if it was brought there. BIOCLIM true/falsemakes use of binary numbers mapped as ―true‖ (1) and all other areas are mapped as ―false‖ (0). In the results
produced in this study, the red color represents ―true‖ while the gray color represents ―false‖.
Subsequently, Ecological Niche Modeling was done using BIOCLIM True/False prediction model to create climate envelope for malaria vectors in Kenya. All areas that fell within the envelope described by malaria presence sample points were categorized by user defined percentile classes and mapped using binary classification as ―true‖ (1) and ―false‖ (0) representing suitable and unsuitable malaria vector habitat respectively. All the areas found to be suitable for malaria vectors to thrive were denoted with red color while those areas with no potential to sustain malaria vectors were shown in gray. The generated maps had two ecological zones with gray color denoting all the unsuitable areas and red color denoting the areas of excellent ecologies for malaria vectors to thrive. Ecological suitability prediction was based on the assumptions that:
malaria vector presence is restricted to locations equally or more suitable than those at which the species has been observed; and
most environmental variables are continuous.
330 in order to build and validate a correlative species‘ distribution model for malaria vectors in Kenya are outlined in Figure 4.
END START
Collate GIS database of environmental layers (precipitation, tmax, tmin, tmean)
Map the known species‘ distribution (presence only Malaria vector sample points)
Process to generate 19 Bioclimatic variables for ENM for Kenya
Convert from point sample to grid data
Predict Ecological Niches with BIOCLIM True or False ENM models
Test predictive performance through data-splitting statistical approach (AUC/Kappa)
Predict species‘ distribution with current climate (1950-2000) and IPCC future projections by the year 2020, 2050 and 2080 under future climate change scenario
Create suitability maps for malaria vector distribution
Figure 4: Flow diagram for correlative malaria vector distribution modeling.
4. VALIDATION OF MODEL PREDICTION
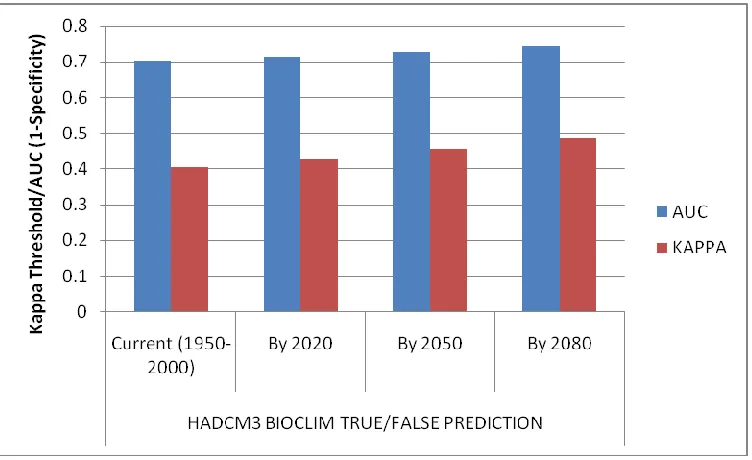
The BIOCLIM True/False prediction model was validated to assess the accuracy of models‘ performance with DIVA GIS software. The malaria vector presence data was randomly divided into training and testing subsets, with 75% of the records used in model training while 25% of the records were used to test the model. Random absence data was included from the mask since the validation requires an input of presence-absence records. The prediction model performance was validated using the kappa statistics and Receiver Operator Characteristics (ROC) area under curve (AUC). Interpretation of the acquired model performance values was done for kappa statistics and AUC values (Kimuyu, J.S., 2015). The validation outcome showed that the model predictions were acceptable as they all met the set acceptable thresholds for kappa (0.5 – 1.0) and AUC statistics (0.7-1.0) for all the predictions (Moran, 1948; Geary, 1954). Table 2and 3 below shows the interpretation of AUC and Kappa strength of agreement.AUC Value Interpretation
0.90 – 1 excellent (A) 0.80 - 0.90 good (B) 0.70 - 0.80 good (B) 0.60 - 0.70 poor (D) 0.50 - 0.60 fail (F)
Table 2: Interpretation of AUC values
Value of K Strength of agreement
< 0.20 Poor 0.21 - 0.40 Fair 0.41 - 0.60 Moderate 0.61 - 0.80 Good 0.81 - 1.00 Very good
Table 3: Evaluation of Kappa strength of agreement
The confusion matrix was used to summarize the predictive performance of the model. Binary model predictions of suitable and unsuitable habitat are required in order to complete the confusion matrix. The confusion matrix records the frequencies of each of the four types of predictions from analysis of test data as follows:
(a) True positive - model predicts presence of an event and test data confirms;
(b) False positive - model predicts presence of an event but test data show absence;
(c) False negative - model predicts absence of an event and test data show presence;
(d) True negative - model predicts and test data show absence of an event.
found but the model predicted as suitable environment; c, number of cells for which the habitat was found to be suitable but the model predicted unsuitable; and d, number of cells for which non-suitable malaria vector environment was correctly predicted by the model. The columns are reference data, or known classifications as the sites were evaluated on the ground while the rows are model predictions. One simple measure of accuracy that can be derived from the confusion matrix is the proportion of correctly predicted sites, the overall accuracy. Model performance is a measure of how well a model explains an independent dataset. Measures of predictive accuracy were calculated from the 2 × 2 error matrix. Overall accuracy gave the rate of correctly classified cells. Sensitivity is the probability that the model will correctly classify a presence. Specificity is the probability that the model will correctly classify an absence. The kappa (k) statistic normalizes the overall accuracy by the accuracy that might have
occurred by chance alone. The kappa statistic is a chance corrected measure of agreement between two sets of categorized data. Kappa result ranges from 0 to 1 and the higher the value of Kappa, the stronger the agreement. If k = 1, then there is perfect agreement and if k = 0, then there is no agreement. Therefore, Kappa was used as a measure of the agreement between model predictions and existing reality. Omission error was the proportion of actual suitable habitats that were not predicted properly while commission error is a measure of all absences placed where the malaria vectors cannot survive. Correct Classification Rate (CCR) is usually a measure of how many of our test points were correctly predicted versus not. Comparisons for the resulting Kappa and AUC from the model performance accuracy results of the BIOCLIM T/F correlative model are summarized in Figure 5. Appendix 1 shows details of the curves showing AUC and Kappa values for each model prediction.
Figure 5: Kappa and AUC statistics for BIOCLIM True/False model performance.
5.
RESULTS
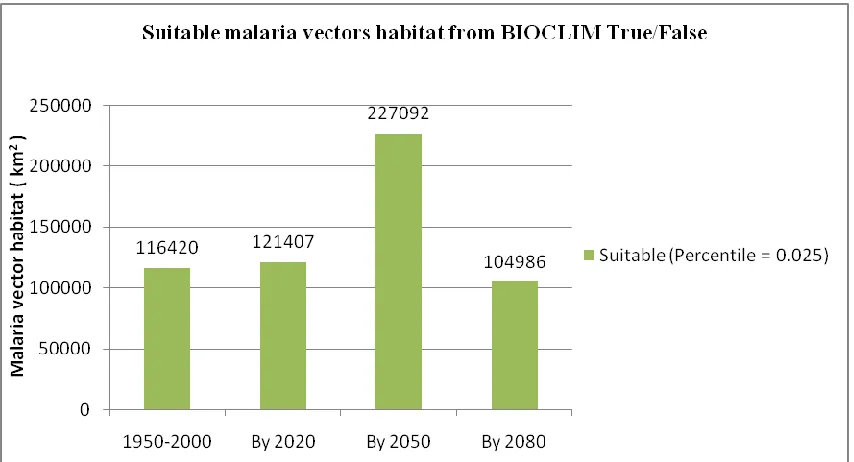
This research was set to correlate the relationship between climate change and the distribution of the main malaria vectors in Kenya. Ecological Niche Modeling was applied to spatially establish the effect of climate as an explanatory variable in main malaria vector distribution, hence malaria prevalence in new hotspots. Predictive modeling was done to investigate the spatial-temporal vector distribution under different IPCC future climate projections. The period from 1950 – 2000 was treated as the current climate scenario to explain where malaria vectors are existing as per vector spatial presence data. Prediction results using HADCM3 future projections by the year 2020, 2050 and 2080 showed the ecological niches where malaria vectors would also be found to thrive in the future under climate change. Ecological Niche Modeling using BIOCLIM True/False model resulted into two classes of either suitable or non-suitable malaria vector habitat as shown compared in Figure 6. The highest suitable environment for malaria vectors‘ habitat was 227 092
Figure 6: BIOCLIM True or False prediction of Malaria distribution in Kenya under the (a) current climate (1950 -2000) and IPCC HADCM3 future projected climate by the year 2020 (b), 2050 (c) and 2080 (d).
Figure 7: Predicted Ecological Niche areas in km2 for BIOCLIM True/False model prediction with 1950-2000 current climate and HADCM3 future projection by 2020, 2050 and 2080.
6. DISCUSSIONS
The predictions showed that by the year 2020, the suitability areas for malaria vectors in Kenya may take different dynamics from the current ecological suitability. Most areas where the malaria vectors are thriving currently may still remain suitable ecologies. New suitability zones may emerge in most counties ranging from low to very high suitability as shown by the predictions. By the year 2050, areas of suitability may expand by doubling extend as compared to the current climate condition. The year 2080 has
334 Spatial-temporal analysis has quantified the changing dynamics
of malaria vector distribution, hence malaria prevalence. This gives an explanation to the reported uncertainty about the potential impact of climate change on malaria at local and global scales (IPCC, 2007). The predictions in this study form a baseline for future hotspots where malaria can spread under the influence of climate change especially in high altitude areas as was reported by Chaves et al. (2012). Policy makers in Kenya should be well advised to come up with strategies to prevent the expansion of malaria endemic zones in the country as combating malaria in the current hotspots still remains a national challenge. Important to note is the fact that prediction models are tools that guide planning for disaster preparedness to enhance the adaptive capacity and build resilience among vulnerable communities thus should not be taken as warnings of reality.
7. CONCLUSIONS
This study employed Ecological Niche Modeling to spatially quantify the alteration of malaria vector ecologies in Kenya under current and IPCC future projected climate. The environmental factors among others play a role in the alteration of suitable malaria habitats in new areas in Kenya. The following conclusions were drawn from the Ecological Niche Modeling done using BIOCLIM True or False prediction model: There is correlation between climate change as an explanatory variable and the distribution of main malaria vectors in Kenya. The spatial-temporal distribution of the main malaria vectors in Kenya varies under HADCM3 IPCC future climate projections by the year 2020, 2050 and 2080. The future ecological niches for malaria vector occurrence in Kenya may extend from the current niches in most endemic areas, new hotspots may emerge and some suitable ecology could become unsuitable, resulting in varying areas from current climate predictions to projections by the year 2020, 2050 and 2080 under IPCC A2a scenario. Intervention strategies such as indoor or outdoor residual spraying, distribution of insecticide-treated mosquito nets (ITNs) and long-lasting insecticide-treated nets (LLINs) should be diversified in new emerging areas for disaster risk reduction and increase adaptive capacity and resilience among local communities. Therefore, this research made a breakthrough in establishing the relationship between climate change and the occurrence of main malaria vectors in Kenya. Suitable Climate Envelope Models (CEMs) that use the current geographic distribution of species to infer its environmental requirements and to predict malaria vector species‘ geographic distribution for the current, or for future climates were investigated and validated. Thus, Ecological Niche Modeling (ENM) has been applied to correlate climate change and the emerging hotspots of malaria vector geographical distribution in Kenya. Predictive modeling showed that the future climate projections under different scenarios will impact malaria vector distribution negatively, thus the prevalence of malaria in areas which are not currently threatened by the epidemic.
7.1 Recommendations
The accuracy of predicted malaria vector ecological niches, hence malaria prevalence is dependent on the accuracy of projected climate data. Therefore, the author of this research would recommend that local climate data should be collected at finer resolution, so as to localize the trend of malaria vector distribution. The results should be validated with laboratory tested actual county malaria incidence data for a period not less than thirty years. Such data is not currently available as the recorded
hospital data on malaria cases in the past categorized most fever incidences as malaria, before the recent undertaking by the health sector to perform clinical laboratory test for any suspected malaria patient. The predictions in this research employed correlative Ecological Niche Modeling rather than mechanistic approach. The author recommends further research that can adopt mechanistic approach to model the suitable ecologies for malaria vector distribution. The physiologically limiting mechanisms in malaria vectors‘ tolerance to environmental conditions should be incorporated in mechanistic models to predict the future geographic space. Results from the two different methods can be compared.
7.2 Areas for Further Research
Further to the research findings elaborated in this study, there is need to carry on the following investigations:
If climate change dictates the distribution of malaria vectors in Kenya, then surveillance studies should be done to investigate the climate change impacts at county level. Analyses techniques that can provide differencing to extract models showing the new hotspots should be explored. This would be important as the boundary of ecological niches does not follow any stipulated county boundaries.
From the generated 19 bioclimatic variables used in Ecological Niche Modeling, what combination would impact the distribution most significantly? This will assist in determining the climatic variables that can be most attributed to affect the distribution of malaria vectors in Kenya. Modeling should be done with the results of Representative
Concentration Pathways (RCP) from the Fifth Assessment Report of the IPCC with an aim to review the findings in this research.
ACKNOWLEDGEMENT
The research was accomplished through financial assistance from the postgraduate PhD Research Grant offered by the National Council for Science and Technology, Ministry of Higher Education Science and Technology, Kenya.
REFERENCES
[1]. Chaves, L.F., Satake, A., Hashizume, M. and Minakawa, N., 2012. Indian Ocean Dipole and Rainfall Drive a Moran Effect in East Africa Malaria Transmission. Journal of Infectious Diseases, 205(12), 1885-1891.
[2]. Geary, R.C., 1954. The contiguity ratio and statistical mapping. Incorporated Statistician, 5, 115-141.
[3]. Githeko, A.K., Lindsay, S.W., Confalonieri, U.E. and Patz, J.A., 2000. Climate change and vector-borne diseases: a regional analysis. Bull World Health Organ, 78(9), pp.1136-1147.
[4]. Githeko, A.K. and Ndegwa, W., 2001. Predicting malaria epidemics in the Kenyan Highlands using climate data: a tool for decision makers. Global Change Human Health, (2), pp.54 - 63.
[6]. Hamann, A. and Wang, T., 2006. Potential Effects of Climate Change on Ecosystem and Tree Species Distribution in British Columbia. Ecology, (87), pp.2773-2786.
[7]. Hijmans et al., 2005. Very high resolution interpolated climate surfaces for global land areas. Published online in Wiley InterScience (www.interscience.wiley.com). DOI: 10.1002/joc.1276. Int. J. Climatol. 25: 1965–1978.
[8]. Hughes, L., Cawsey, E. M. and Westoby, M., 1996. Climatic Range Sizes of Eucalyptus Species in Relation to Future Climate Change. Global Ecology and Biogeography Letters (5), pp. 23-29. doi: 10.2307/2997467.
[9]. IPCC, 2001: Climate Change 2001: The Scientific Basis. Contribution of Working Group I to the Third Assessment Report of the Intergovernmental Panel on Climate Change [Houghton, J.T., et al. (eds.)]. Cambridge University Press, Cambridge, United Kingdom and New York, NY, USA, 881 pp.
[10]. IPCC, 2007: Climate Change 2007: The Physical Science Basis. Contribution of Working Group I to the Fourth Assessment Report of the Intergovernmental Panel on Climate Change [Solomon, S., D. Qin, M. Manning, Z. Chen, M. Marquis, K.B. Averyt, M. Tignor and H.L. Miller (eds.)]. Cambridge University Press, Cambridge, United Kingdom and New York, NY, USA, 996 pp.
[11]. IPCC, 2007: Climate Change 2007: Impacts, Adaptation and Vulnerability. Contribution of Working Group II to the Fourth Assessment Report of the Intergovernmental Panel on Climate Change, M.L. Parry, O.F. Canziani, J.P. Palutikof, P.J. van der Linden and C.E. Hanson, Eds., Cambridge University Press, Cambridge, UK, 976pp.
[12]. Iverson, L. R., and Prasad, A. M., 2001. Potential Changes in Tree Species Richness and Forest Community Types Following Climate Change. Ecosystems, (4), pp. 186-199. Retrieved May 23, 2011.
[13]. Kelly-Hope, L.A., Hemingway, J. and McKenzie, F.E., 2009. Environmental factors associated with the malaria vectors Anopheles gambiae and Anopheles funestus in Kenya. Malar J, 8(268), pp. 1-8.
[14]. Kenya National Bureau of Statistics (KNBS), 2010. 2009 Kenya Population and Housing Census, Vol. 1A & 1C. Nairobi: KNBS.
[15]. Kimuyu, J.S., 2015. Ecological Niche Modeling Of Malaria Vector Distribution For Climate Change Adaptation In Kenya (Doctoral dissertation, University
of Nairobi).
http://erepository.uonbi.ac.ke/bitstream/handle/11295/9 0873/Kimuyu,%20Jacinta%20S_%20%20Ecological%2 0niche%20modeling%20of%20malaria%20vector%20di
stribution%20for%20climate%20change%20adaptation %20in%20kenya.pdf?sequence=4&isAllowed=y
[16]. Kovats, R.S., Campbell-Lendrum, D.H., McMichael, A.J. Woodward A. and Cox, J.S., 2001. Early effects of climate change: do they include changges in vector-borne disease? Philos. T. Roy. Soc. B, (356), pp.1057 - 1068.
[17]. McClean, C. J., Lovett, J. C., Küper, W., Hannah, L., Sommer, J. H., Barthlott, W., Termansen, M., Smith, G. F., Tokumine, S. and Taplin, J. R. D., 2005. African Plant Diversity and Climate Change. Annals of the Missouri Botanical Garden, (92), pp. 139-152. Retrieved May 23, 2011.
[18]. Moran, P.A.P., 1948. The interpretation of statistical maps. Journal of the Royal Statistical Society, Series B (10), pp. 243-251.
[19]. Murray, C.J.L., Rosenfeld, L.C., Lim, S.S., Andrews, K.G., Foreman, K.J., Haring, D., Fullman, N., Naghavi, M., Lozano, R. and Lopez, A.D., 2012. Global malaria mortality between 1980 and 2010: a systematic analysis. The Lancet (379), pp. 413-431.
[20]. Okara, et al., 2010. Distribution of main malaria vectors in Kenya. Malaria Journal, (9)69, doi:10.1186/1475-2875-9-69.
[21]. Omumbo, J., Lyon, B., Waweru, S., Connor, S. and Thomson, M., 2011. Raised temperatures over the Kericho tea estates: revisiting the climate in the East African highlands malaria debate. Malaria Journal, 10(12).
[22]. Parmesan, C. and Yohe, G., 2003. A globally coherent fingerprint of climate change impacts across natural systems. Nature, (421), pp. 37–42.
[23]. Pascual, M., Ahumada, J.A., Chaves, L.F., Rodo, X. and Bouma, M., 2006. Malaria resurgence in the East African highlands: Temperature trends revisited. Pnas, 103(15), pp. 5829-5834.
[24]. Patz, J.A., Graczyk, T.K. and Geller, N. and Vittor A.Y., 2000. Effects of environmental change on emerging parasitic diseases. Int J Parasitol, (30), pp.395-405.
[25]. Pearson, R. G. and Dawson, T.P., 2003. Predicting the Impacts of Climate Change on the Distribution of Species: Are Bioclimate Envelope Models Useful? Global Ecology and Biogeography, (12), pp.361-371.
[26]. Root, T., Price, J.T., Hall, K.R., Schneider, S.H., Rosenzweig, C. and Pounds, J.A., 2003. Fingerprints of global warming on wild animals and plants. Nature (421), pp. 57–60.
336 R.W. and Hay, S.I., 2011. Temperature and malaria
trends in highland East Africa. PLoS One, 6(9), e24524.
[28]. Webster R. and Oliver M.A., 2007. Geostatistics for Environmental Scientists. John Wiley and Sons Ltd, Second Edition.
[29]. World Health Organization, 2003. Climate Change and Human Health: Risks and Responses,Summary. 20 Avenue Appia, 1211 Geneva, 27 Switzerland: Publications of the World Health Organization.
[30]. World Health Organization, 2010. World Malaria Report 2010. World Health Organization, Geneva, pp. 1-93.
APPENDIX I: BIOCLIM True/False Model Evaluation Results
ROC Evaluation for 1950-2000 climate BIOCLIM True/False Model
prediction (AUC=0.703) KAPPA Evaluation for 1950-2000 climate BIOCLIM True/False Model prediction (k = 0.406)
ROC Evaluation for HADCM3_ 2020_A2a climate BIOCLIM True/False Model prediction (AUC = 0.714)
KAPPA Evaluation for HADCM3_ 2020_A2a climate BIOCLIM True/False Model prediction (k = 0.427)
ROC Evaluation for HADCM3_ 2050_A2a climate BIOCLIM True/False Model prediction (AUC = 0.728)
ROC Evaluation for HADCM3_ 2080_A2a climate BIOCLIM True/False Model prediction (AUC = 0.743)
KAPPA Evaluation for HADCM3_ 2080_A2a climate BIOCLIM True/False Model prediction (k = 0.486)