790
Method To Characterize Soil Contamination By
Mining Through Image Processing
Miryan Cosme, Wilver Auccahuasi, Luzmila Pró Concepción, Martha Avilés, Verónica TelloAbstract: Problems in the soil are caused during the work done by the mining industry. There are claims from different communities because their crops, livestock, aquaculture and housing are threatened, impacting the health and economy of citizens. By analyzing the behavior of the soil through satellite images, it allowed analyzing the colors of the images to determine the characterization of the soil. An analysis of the wavelength associated with each band of the satellite missions was also carried out, resulting in, in places closer to the tailings, there is a greater presence of yellowish and roasted brown colors, representing uncovered soil, little or no vegetation . The geographical observation points were selected for the causes related to the characteristics of the investigation and because there is a technical report of contamination presented by the Municipality of Espinar. This research opens a new field to environmental monitoring and surveillance to assess the characterizations of soil behavior by applying the method consisting of 6 steps of band combination and a practical contribution that provides information on the mapping of vegetation for decision making. Environmental management.
Index Terms: Image processing, soil characterization, contaminated by mining, color, wavelength.
—————————— ——————————
1.
INTRODUCTION
Soil pollution in the world is increasingly alarming because it negatively influences the various activities that involve the use of soils such as agriculture, livestock, aquaculture and housing, and impacts health and the economy. This type of pollution is the third most important in Europe and Eurasia, fourth in North Africa, fifth in Asia, seventh in the Pacific Northwest, eighth in North America and ninth in sub-Saharan Africa and Latin America [7]. The presence of pollutants causes nutrient imbalances and soil acidification, two of the main problems in many parts of the world. The Revised World Land Charter (FAO, 2015) recommends that national governments implement regulations on soil pollution and limit the accumulation of pollutants beyond the levels established to ensure human health and people's well-being [25]. One of the human activities that pollutes the soil is mining. Mining activities affect the soil at the time of extraction, concentration and refining, causing alterations in levels that negatively affect living organisms and plant growth, and as a consequence causes degradation, unbalanced textural class, absence of edaphic structure, nutrient imbalance and rooting difficulty [41]. Investigations in soil contamination are aimed at: monitoring, which refers to systematic sampling with methods and technologies appropriate to the environment in which the study is conducted [1]; remediation, which deals with the execution of the actions contemplated in the Soil Decontamination Plan approved by the competent authority, the characterization, which consists in determining the extent and depth of contamination of those sites detected in the identification phase that exceed the environmental quality standards for soil introduced by mining activity [40]; environmental monitoring implies the execution of a series of sampling at different points, in order to determine the state of environmental components such as air, water, soil, flora and fauna [39].
The characterization of polluting soils is important because it allows a better understanding of the environmental situation of the areas defined as impacted and their surroundings [38]. Methods for characterization of contaminating soils have been developed since the 1970s, including: the method of atomic absorption spectrophotometry by flame, where the sample is digested to reduce interference by organic matter and converts the metal into a determinable free form ; the atomic absorption spectrophotometry method is based on the absorption of visible light by substances and its subsequent measurement of the energy released [44]; and image processing, which is one of the most recent methods that covers many fields, for example, those that are obtained for medical diagnostic purposes, another for field tests. Through this method you can analyze the natural resources and geological faults of land [43].
Image processing is a solution to identify minerals in large and remote parts that are mostly inaccessible with precise spatial and spectral results. The data obtained offer highly characterized visualization of the surface and the area below the surface of interest, the technology provides the ability to detect and distinguish unique characteristics of materials [42]. However, mostly methods based on image processing are aimed at identifying minerals, altered rocks, hazardous pollutants and oil spills. This paper proposes a simple and economical method to characterize soils affected by mining activity based on image processing and analysis. The method consists of 6 phases: identification of the affected area, search and collection of the image, image processing, obtaining magnitudes and colors, construction and analysis of the spectral signature and the revelation of the results. To apply the method, start by choosing any site for sampling with visual characteristics such as soil color, chemical spills and areas that do not have vegetation cover. Once the area considered to have contamination is identified, the longitude and latitude that represent the coordinates of the land are entered to collect the images in Landsat. These images are used to measure the radiation reflected by the earth's surface that comes from any material exposed on the earth's surface. Once the image is visualized, the vector layer is activated to make a series of combinations of the bands, then the colors, the spectral ————————————————
Miryam Cosme, Universidad Nacional Mayor de San Marcos, Lima, Perú Wilver Auccahuasi, Instituto Peruano de Investigación en Ingeniería
Avanzada, Lima, Perú
Luzmila Pró Concepción, Universidad Nacional Mayor de San Marcos, Lima, Perú
791 signature are obtained and the result is subsequently
analyzed. To validate the proposed method, this will be applied to characterize a soil located in the southern part of the Cuzco region, the unit of the Tintaya Mine located in the district of Espinar, Peru, through the technology that consists of processing of satellite image and that the results are represented graphically.
2
METHODS
Y
MATERIALS
Here are some background related to image processing applied to acquire information about the materials that are exposed on the earth's surface:
2.1 Image processing
Landsat and radar spectral images have been implemented to map mineral deposits. As a result, mapping of altered rocks with many minerals has been obtained [8]. Small-scale vehicles are highly agile platforms for collecting data; however, none was manufactured to collect environmental data with stable platforms to accommodate multispectral and hyperspectral cameras, with straight-line and highly developed flight; These avionics are still not suitable to avoid the ruin of wind image data and turbulence. This represents a broad opportunity for research and development [11]. The multispectral image has been used for the mapping of minerals with hydrothermal alteration. The minerals were macroscopically identified during the geological field recognition, the spectral signatures of the images were analyzed to identify and analyze the spectral responses of the pixels resulting in environmental data on illite, chlorite, calinite and alunite [2]. Remote sensing images have been implemented to monitor a grass field. By means of the images the index of vegetation of normalized difference was measured, obtaining as a result the red color, which represented grass with the highest value that represented more vigor, as well as in other parts it showed blue color for the destruction of the grass and only remained bare earth. The average values obtained in the index of the plots were 0.7921 and 0.7843; after the grass was replanted the index was reduced to 0.2745 and 0.3019 [14]. Hyperspectral images have been obtained to characterize the surface of mineralogy. The results allowed to identify rozenite, melanterite, coppite with jarosite, rozenite and pyrite; In a part dominated by high Ph, Jarosite was found, and further away from the tailings, where lower Ph was reflected, Goetite and hematite were found [15]. For the evaluation of the visual impact caused by mining exploitation, images and the indirect method of Bureau of Land Magamement were used, implemented through computer tools; It has been achieved as a result the determination of units of the visual landscape with landscape assessments between low, high and moderate in forest, plantations and water reservoir [16]. The shortwave infrared wavelengths based on the application combined with absorption characteristics for hyperspectral data have allowed the identification of most minerals with high coincidence with a 74.54% overall accuracy [6]. The fusion of hyperspectral data of optical and thermal ranges allows a wider variety to map minerals and interpret spectral ranges of images linked to mineral composition. The result was to classify minerals, phyllosilicates, as well as lignite and quartz contents [21]. In Landsat 5 image processing, the result suggests that the spatial area is exposed to erosion as a result of changes in land use. Erosion values indicate low erosion processes for
792 2.2 Soil characterization
US Geological Land Imager (OLI) surface reflectance images have been applied to identify mining disturbances, resulting in spectral characteristics and topological information with 92.2% accuracy [10]. Hyperspectral remote sensors have been implemented, where each registered pixel contains detailed quantitative and qualitative environmental information that can be studied for the study of vegetation, forest area, habitat, soil and marine spaces, resulting in environmental data that can be used in the Hyperspectral monitoring of vegetation and soil variation [35]. Multiple end-member spectral mixing (MESMA) analysis applied to Landsat Thematic Mapper (TM) data has been used to map the area affected by surface coal mining, resulting in soil characterization accuracy [12]. According to [13] photogrammetric image processing was applied to create digital terrain models and image mosaics with very high resolution at a decimeter level. Obtaining as a result the quantification of eroded lands and bad lands in large areas of landscape. In [37] large-scale monitoring was implemented by processing spectral images to obtain data that they can be acquired, processed and analyzed internally, obtaining as a result spectral data and color saturation values of the image in a simple way that represents an ideal solution for rapid response and visualization of short-term environmental conditions. In [18] he focused on image processing applied to the Wnchanced Thematic Mapper Plus sensor, to characterize lithologies using band combinations. Results were obtained that yielded 82% reliability in environmental characterization and distinguishing the coverage of the area. According to [20] they used images from Landsat 8 and Landsat 5, resulting in matrix-based precision evaluation revealing characteristics with spectral reflectance values. It was observed that almost 47% of the total land area changed, the rate of land cover change is very high. For [23] images were implemented to compare the possible impact of human activities on the environment, resulting in a decrease in forests at an exchange rate of 51.25 and 0.27%, while in urbanized areas, the lands of Cultivation, rocks, bare soils and bodies of water have increased approximately 267.58, 197.30, 714.11 and 4421.43%, the study showed that changes in land covers through urban development have affected the natural functioning of ecosystems. In [30] the remote sensing technique is used to analyze the landscape pattern and ecological processes, as a result they found precise data on the real situation of the land, which is essential to investigate landscape patterns and contamination of point sources. The researchers analyze the image as it contains information of thousands of kilometers. In order to evaluate the colors displayed as data obtained in the bands. The results obtained have been considered as the ideal solution for rapid responses and decision making for mining management .
2.2 Proposed method
A method based on the processing of spectral images for the characterization of polluting soils by mining operations is proposed. Spectral images allow reflectance to obtain information about materials that are exposed on the surface of the earth. The method consists of 6 steps (see figure 1): the identification of the affected area, Search and compilation of the image, Image processing, Obtaining quantities and colors, Construction and analysis of the spectral signature and the revelation of results. For the identification of the affected area, the study area that is considered to be contamination is
selected, in Phase 2 the latitude and longitude of the area must be taken for the search and collection of the image once the image is obtained in Phase 3 the image is processed considering the Landsat 7 and 8 bands, continuing with Phase 4 the bands are combined to obtain colors and wavelengths according to the observed spectrum, in Phase 5 the spectral signature of the image is constructed ending in Phase 6 with the revelation of results that is the characterization of the studied area.
2.2.1 Identification of the affected area
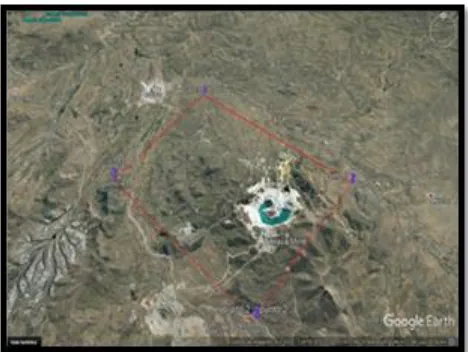
In order to identify the area, the place must be selected taking into account the visibility of the area, including factors such as soil color, chemical spills, areas without vegetation or dead vegetation. Once the place is selected, it continues to locate the dimension of the land, its coordinates, locating latitude and longitude to delimit it spatially. Google Earth can be used to visualize the mapping based on satellite image by locating four reference points.
Figure 1. Image referencing the coordinates of the four
reference points.
2.2.2 Image Collection
The area in the position determined by the terrain coordinates is considered. The image is located in the LANDSAT database. This image has been recorded by the sensors and measures the amount of energy reflected by the natural objects that make up the environment.
2.2.3 Image processing: Spectral observation
793 El (λ)=ER (λ)+ EA (λ)+ ET (λ) (4)
El (λ): incident energy ER (λ): reflected energy EA (λ): absorbed energy ET (λ): transmitted energy
All these components are a function of the wavelength. Through the formula different energies of the image can be distinguished. Here the sensors characterize the electromagnetic waves according to their position, within the electromagnetic spectrum.
2.2.4 Obtaining Magnitudes and Colors
Once the image is visualized, which has been georeferenced, using the coordinates corresponding to the place under study, the vector layer is activated to make the combinations of bands that it considers appropriate, the ground control points with the combinations of the bands are identified. As the surface of the earth is mostly covered by soil, water and vegetation, each reflects the energy in the visible and infrared spectrum, managing to establish the wavelength
2.2.5 Construction and analysis of the spectral signature The combinations are made from the one to the eighth band of the telematic mapping that allows a study of the range of the spectrum from the visible to the far infrared. The combinations are made according to the region of the spectrum and for the analysis of results the characteristics of the detail of the bands are taken into account. The reflectance levels of each band generate a saturation rate of red, green and blue. Within the formation of a color, these bands respond to the light that has penetrated more deeply and serve to interpret the image distinguishing the characteristics of the soil according to the combinations of bands made.
2.2.5 Disclosure of the results
The bands provide reflection and energy absorption, as a result there are colors present in the image that can be dark blue, light blue, green, magenta red, brown, tan brown, yellowish and silver. [17]
a) Dark blue indicates deep wáter
b) Light blue indicates medium depth waters
c) The vegetation is shown in shades of green and
magenta red
d) The soil in brown and tan tones
The bare ground and the rock appear yellowish and silver
3 RESULTS
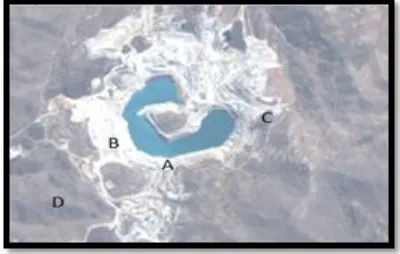
The analysis performed with the Landsat 8 satellite image, in the color combination 3,2,1 that corresponds to red, blue and ultra blue: This combination is chosen because it presents a better visual description of the areas that need to be analyzed with This proceeds to locate and mark areas where there is a deterioration of the land layer resulting from mining action. The analysis of 4 zones is performed as can be seen in the following image.
Figure 3. Image with the reference points.
Each zone is being assigned as follows:
A: corresponds to the mining tailings.
B: corresponds to the surface that is in the vicinity of the mining tailings.
C: corresponds to areas that are far from the tailings area.
D: corresponds to areas with greater distance from the tailings.
With the selected image, the spectral signatures are analyzed, according to the description of the Landsat 8 bands.
For a visual analysis, the color bands are presented separately, showing the image behavior in their bands corresponding to the 4 selected zones. What are they:
794 B= blue, band (2)
Coastal sprays = ultra blue, band (1)
It is necessary to make these combinations formed by the band 3 which is green, it serves to evaluate plant vigor due to its high reflectance of vegetation, delineates shallow water, urban features and infrastructure. The blue band 2, is being used to differentiate vegetation soil, detection of urban areas, buildings and roads. The band 1 coastal sprays is for mapping coasts.
Figure 4. Information of the spectral bands at the reference points.
You can see the signatures of the selected image that represents 4 places in the Espinar District, near the Tintaya Mine, in Cusco, where zone A as described above corresponds to the mining tailings, zone B corresponds to the surface that is found in the vicinity of the mining tailings, zone C corresponds to areas that are far from the tailings area and zone D corresponds to areas with greater distance from the tailings.
Figure 5. Information in point A.
As a result, we can observe a greater predominance of the band 1 that indicates a greater presence of aerosols than by the color it could be the presence of dust particles, followed by the band 2 that differentiates between the soil and the vegetation, as the band 3 is less the predominance therefore there is lack of vigor of the plants. Just as the band 4, 5 and 6 is much smaller so there is no greater contrast in the presence of vegetation, crop soils and surface water.
Figure 6. Information in point B.
As the band 4 is larger, therefore there is a greater contrast in the area with or without vegetation and due to the presence of the brown toasted color in the image, it follows that the bare ground or without vegetation is greater because they are areas near the tailings. As well as the band 3 and 2 it is much smaller deducing the low predominance of vigorous and healthy plants.
Figure 7. Information in point C.
At point C, band 5 is larger, so there is a presence of arable soil and water, followed by band 4 that indicates the presence of vegetation. Zone C is further away from the tailings area.
Figure 8. Information in point D.
795 in soils and vegetation, with greater contrast of areas with
vegetation Because it is an area much farther from the tailings.
4 CONCLUSIONS
There is no efficient methodology that enjoys credibility and legitimacy because it contains transparent mechanisms. Some authors have done work to identify rocks, quantify erosion, oil spills, observation of individual plants, collection of environmental data on a smaller scale, identification of minerals, highlighted environmental changes and the evaluation of the impact of mining works. For this reason, a methodology that is transparent and reliable is proposed. All authors used similar methods of image processing that would allow them to obtain results, but none combined the color analysis with the magnitude of the wave through the combinations between the bands. The study results characterize contaminated soils, using the methodology to characterize soils affected by mining based on image analysis. Finally, the wavelength analysis was made, the Landsat 8 image was worked on in the color combination (3 2 1) corresponding to (Red green coastal spray) in that order, the region of the infrared spectrum is chosen for Determine land use, vegetation, agriculture. Here we proceeded to locate and mark areas where a deterioration of the earth's layer is observed, analyzing 4 zones, marking as the tailings zone A, the length of the spectral signature in the band 4, 5 and 6 are the lowest, that It means that the presence of vegetation is minimal. When the image is analyzed, a dark blue color is observed means that there is water, but it is not a light blue that represents clean water. Therefore, it is concluded that it is not clean water and the band 3 and 4 representing low vegetation, that means that there is little vegetation. In the analysis of the area adjacent to the tailings that is B, there is better predominance in the band 4 and 5, there are conditions in which vegetation may appear. In Zone C which is a place away from the tailings, the band 3,4 and 5 are the highest where there can be a presence of agriculture and vegetation. The zone D that corresponds to areas farther from the tailings there is more presence of vegetation. This result coincides with the result described in the final integrated report of Environmental Sanitary Monitoring of the Province of Espinar, which explains the results obtained that Espinar surface soils show Arsenic concentrations exceeding the permissible level, and this leads to environmental pollution damaging The health of the community.
REFERENCES
[1] 'Ministerio de Energía y Minas,
http://www.minem.gob.pe/minem/archivos/file/Mineria/LEGISLA CION/2016/Inventario%20de%20Pasivos%20Ambientales%20 Mineros%202016.pdf
[2] 'Berrezueta Edgar, Dominguez María-Técnicas aplicadas a la caracterización y aprovechamiento de recursos geológico-
minero,http://www.cyted.org/sites/default/files/-Tecnicas%20Aplicadas%20a%20la%20caracterizacion%20y% 20aprovechamiento%20de%20recursos%20geologico-mineros.pd, 2012,3, accessed 08 September 2018
[3] 'Pinto Herrera Honorio-Contaminación ambiental en Tintaya',file://Users/Casa/Downloads/11759Texto%20del%20art %C3%ADculo-42435-1-10-20160714.pdf
[4] 'Pérez, Daniel-Introducción a los Sensores Remotos, AplicacionesenGeología', https://studylib.es/doc/4862480/-introducci%C3%B3n-a-los-sensores-remotos, accessed 18
September 2018
[5] ‘Ministerio del Ambiente –Guía para el muestreo de suelos’http://www.minam.gob.pe/calidadambiental/wpcontent/up loads/sites/22/2013/10/GUIA-PARA-ELMUESTREO-DE-SUELOS-final.pdf, accessed 19 September 2018
[6] 'Jing, W., Yanfang, M., Qiang, J., et al. -Simple mineral mapping algorithm based on multitype spectral diagnostic absorption features: a case study at Cuprite, Nevada', http://vinar.vin.bg.ac.rs/bitstream/handle/123456789/8027/Milan ovic.pdf?sequence=1&isAllowed=y, 2017.11,(2)accessed 17 October 2019
[7] 'FAO -Food and agriculture organization of the United Nations', http://www.fao.org/3/I9549EN/i9549en.pdf accessed 19 October 2019
[8] Sabins, F.: 'Remote sensing for mineral exploration ', Elsevier, 1999, 14, (3-4), pp. 157-183
[9] Larrañaga, E.: 'Plan de suelos contaminados de la comunidad autónoma del País Vasco'. Edita sociedad pública de gestión ambiental-IHOBE, S.A. (pp.96).
[10]Bernd, E.:'Pattern recognition of geophysical data', Elsevier, 2009, 160, pp. 111-125.
[11]Hardin, P., J., Jensen R. 'Small-Scale Unmanned Aerial Vehicles in Environmental Remote Sensing: Challenges and Opportunities ' GI Science & Remote Sensing, 2011, 48, (1), pp. 99-111
[12]Quintano, C., Fernandez, M., Shimabukuro, Y., et al.: 'Spectral unmixing', Remote Sensing of Environment, 2012, 33, (17), pp. 307-340
[13]Oleire, S, Marzolff, I, Klaus, D., et al.: 'Unmanned Aerial Vehicle (UAV) for Monitoring Soil Erosion in Morocco', Remote Sens, 2012, 4, (11), pp. 3390-3416
[14]Can, H. 'Development of a low-cost agricultural remote sensing system based on an autonomous unmanned aerial vehicle (UAV)', Food and Agriculture Organization of the United Nations, 2013, 108, (2), pp. 174-190
[15]Zabcic, N. , Rivard, B., Ong, C. , et al .: 'Using airborne hyperspectral data to characterize the surface ph and mineralogy of pyrite mine tailings', Elsevier., 2014,32,pp. 152-162
[16]Aguilera, I., Batista, Y, Bastola, S., et al.: ‘Impacto visual generado por la explotación minera en el yacimiento de Punta Gorda, MOA', Redalyc, 2016, 4, (32), pp. 141-159
[17]Aguilera., Fernández, L.:'Impacto visual generado por la explotación minera en el yacimiento Punta Gorda, Moa', Minería y geología, 2016, 32(4) ,141-159
[18]Lo Vecchio, A., Lenzano, M., Richiano, S., et al.: 'Lithologic identification and characterization using ETM+ (Landsat 7). Study case of the Upsala glacier basin, Argentine. Revista de la Asociación Española de teledetección, 2016, 46, pp. 57-72 [19]Shivesh, K. Sukha, R: 'Accuracy of land use change detection
using support vector machine and maximum likelihood techniques for open-cast coal mining areas', Springer International Publishing, 2016, 188,(486), pp.1-13
[20]Nauha, M., Nada, M., Saadi, A.: ' Mine Wasted environmental impact mapping using Landsat ETM+ and SPOT 5 data fusión in the North of Tunisia', Springer International Publishing., 2016,44,(3), pp. 451-455
[21]Kopackova, V., Loucká, L.: 'Integration of absorption feature information from visible to longwave infrared spectral ranges for mineral mapping', Remote Sensing-MDPI, 2017, 9, (10), pp. 1006
796 change (LULCC) on the environmental sustainability of Ekiti
State, southwestern Nigeria ', Springer International Publishing, 2018, 1, (32), pp.1-32.
[23]Veettil, B., Rend, N.: 'Environmental changes near the Mekong Delta in Vietnan using remote sensing', Springer International Publishing. 2018, 29, (3), pp.639-647
[24]FOOD.: ‘Migration, agriculture and rural development‘, Organization of the United Nations Rome, 2018, pp. 1-175 [25]Farnoosh, A., Ardavan, G.: 'Object-based land-use/land-cover
change detection using Landsat imagery: a case study of Ardabil, Namin, and Nir counties in northwest Iran', Springer International Publishing, 2018, 190, (376), pp.1-14.
[26]Asa, M., Eyal, B., Lubos, B.: 'Monitoring of selected soil contaminants using proximal and remote sensing techiques: Background, state-of-the-art and future perspectives', Taylor y Francis Group. 2018, 0, (0), pp. 1-36
[27]Tiezhu, S. , Long, G., Yiyun, Chet al.: 'Proximal and remote sensing techniques for mapping of soil contamination with heavy metals ', Taylor y Francis., 2018,52,pp. 1-23
[28]Dalm, M., Buxton, M., Van, F.: 'Ore-Waste discrimination in epithermal deposits using near-infrared to short-wavelength infrared (Nir-Swir) hyperspectral imagery ', Springer International Publishing. 2018, 51,(7), pp.849-875
[29]Zhang, X., Wu, Q., Cui, J., et al., Wang, W.: 'Source-sink landscape pattern analysis of nonpoint source pollution using remote sensing techniques', International Journal of Environmental Science and Technology., 2018,15,(10),pp.2253-2268
[30]Hamad, R-, Balzter, H., Kolo, K. , et al.: 'Assessment heavy metal release into the soil after mine clearing in Halgurd-Sakran National Park, Kurdistan, Iraq ', Springer International Publishing., 2018,26,(2),pp.1517-1536.
[31]Ahmed, M., Hala, A.: 'Environmental analysis of soil characteristics in El-Fayoun Governorate using geomatics approach', Springer International Publishing., 2019, 191, (463), pp. 1-20
[32]Milanovic, M., Tomic, M., Perovic, V., et al.: 'Land degradation analysis of mine-impacted zone of Kolubara in Serbia', Carpathian Journal of Earth and Environmental Sciences, 2017, 76, (580), pp. 1-10
[33]Dalm, M, Buxton, M., Ruitenbeek, F.: 'Ore–Waste Discrimination in Epithermal Deposits Using Near-Infrared to Short-Wavelength Infrared (NIR-SWIR) Hyperspectral Imagery', Springer International Publishing. 51, (7), pp. 849-875
[34]Abdullah, S., Mohamed, K.,El-Shafei, Z.: 'Using remote sensing techniques and field-based structural analysis to explore new gold and associated mineral sites aroundal-Hajar mine, Asir terrane, Arabian shield', African Earth Sciences, 2016, 117,(16), pp.285-302
[35]Tuominen, J., Lipping, T., 'Detection of environment tal change using hyperspectral remote sensing at olkiluoto repository sit ePosiva Oy', (POSIVA-WR-11-26, 2011), pp. 11-26
[36]Mesa de dialogo de Espinar- Sub grupo del medio ambiente., 'Informe final integrado de Monitoreo Sanitario Ambiental Participativo de la Provincia de Espinar-2013' (Ministerio del Ambiente, 2013), pp. 1-117.
[37]Temence, E, Gary B. , 'An evaluation of remote sensing technologies for the detection of fugitive contamination at selected superfund hazardous waste sites in Pennsylvania', (U.S. Geological Survey,2014), 2014-1081, pp. 23
[38]Servicio geográfico & medio ambiente S.A.C., 'Identificación y caracterización de suelos'(MINEM, 2015), pp. 40
[39]Organismo de evaluación y fiscalización ambiental 'La
vinculación y retroalimentación entre la certificación y la fiscalización ambiental'(OEFA, 2016), pp. 92
[40]Ministerio de Energía y Minas., 'Informe de identificación de sitios contaminados de la planta de gas de Pariñas, planta Verdun y Ductos’ (MINEM, 2019), pp. 2
[41]Tello, F.: 'Evaluación temporal de la lixiviación de nitratos de cuatro abonos orgánicos en tres tipos de suelos', Universidad Agraria La Molina, 2004
[42]Romero, F. ' La Teledetección satelital y los sistemas de protección ambiental ', (, Revista de Ingeniería Industria, 2005,4ta edn), pp.44-57
[43]Dugdale, S. ‘An Evaluation of imagery from anunmanned aerial vehicle (UAV) for the mapping ofintertidal macroalgae on Seal Sands. Tees Estuary. UK Durkam’, (University available at Durham E-Theses, 2007), pp.39