Published online December 18, 2014 (http://www.sciencepublishinggroup.com/j/ajam) doi: 10.11648/j.ajam.20140206.13
ISSN: 2330-0043 (Print); ISSN: 2330-006X (Online)
A grey relational analysis based study on green degree
evaluation of urban logistics
Lijuan Qian
1, 3, *, Jinlin Ma
2, 3, Zongbo Zhang
2, Daming Zhang
3, Kaiping Ma
41
The Faculty of Science, Jiangsu University, Zhenjiang, Jiangsu, 212013, P. R. China 2
School of Automobile and Traffic Engineering, Jiangsu University, Zhenjiang, Jiangsu 212013, China 3
Industrial Technology, California State University, Fresno, CA 93740-8002, USA 4
College of engineering, Nanjing Agricultural University, Nanjing, Jiangsu, 210031, China
Email address:
[email protected] (Lijuan Qian), [email protected] (Jinlin Ma), [email protected] (Zongbo Zhang), [email protected] (Daming Zhang), [email protected] (Kaiping Ma)
To cite this article:
Lijuan Qian, Jinlin Ma, Zongbo Zhang, Daming Zhang, Kaiping Ma. A Grey Relational Analysis Based Study on Green Degree Evaluation of Urban Logistics. American Journal of Applied Mathematics. Vol. 2, No. 6, 2014, pp. 209-213. doi: 10.11648/j.ajam.20140206.13
Abstract:
According to the urban logistics green degree’s evaluation, a weighted grey correlation analysis method based on the analytic hierarchy process is proposed to determine the weight of each index in the urban logistics green degree evaluation system, and then figure out the optimal relative degree, realizing the green degree of each urban logistics. Finally, an example was given for proving the evaluation methods’ intuitive and high efficient.Keywords:
Grey Relational Analysis, Urban Logistics, Green Degree, Evaluation1. Introduction
The world economy has brought serious damage to the environment. As part of the economic activity, urban logistics system is also facing environmental problems, such as polluted gas emissions, traffic congestion and improper waste disposal. Thus, countries have to develop green logistics as a key way to protect the environment and improve efficiency. Green degree of urban logistics industry has gradually become an important indicator of the standard of social development, urban construction and of living of the society. Therefore, the assessment of urban logistics green degree will not only help to identify bottlenecks in its development, but also provide theoretical guidance for the scientific development of circular economy.
2. Determining the City Logistics Green
Degree Evaluation Index System
Green logistics refers to the reduction of environmental harm, while making the best use of logistics resources to achieve economic, social and environmental benefits. It follows four principles: 1) reduction principle, 2) reuse principle, 3) recirculation principle, 4) coexistence principles [1].
Green city logistics include green logistics operation and green logistics management [2]. Therefore, the evaluation of city logistics green degree should be considered mainly for the following indicators:
1) Intensification of resources. It’s the dominant ideology of the logistics industry development. Through integrating the existing capacity resources and optimizing resource allocation and other means, logistics companies can improve resource utilization, reduce waste.
2) Green transport. Firstly, to achieve green logistics, transport routes must be optimized in order that we can shorten the transport distance, Secondly, the rational organization of the supply flow and stowage, can avoid unreasonable transport; In addition, focusing on the transport vehicle maintenance and using cleaner fuels, would be beneficial to reduce energy consumption and emissions.
management efficiency.
4) Reverse logistics. Primarily by means of reuse of waste materials, recycling and waste disposal, we could achieve minimized environmental impact [3].
3. Multi-Level Gray Evaluation Model
System
City logistics green degree evaluation system is a gray system. Firstly, because the factors that affect the city logistics’ green degree are too numerous and complex, we generally select limited key indicators to analyze while conducting the evaluation. Secondly, the link between the factors are not fully known and difficult to be quantified accurately, it is difficult to make a reasonable, accurate judgment relying solely on qualitative methods and mathematical evaluation methods in general [4]. Therefore, it is suitable for using of gray correlation analysis method combined with AHP to “whiten” the not fully ascertain relationship between the evaluation factors [5]. It can also be achieved on multiple city logistics systems to queue in line according to the quality of being friendly to the environment.
The basic idea of the evaluation: All the index value of idealized city logistics x0kcomposing the reference sequence
0
X , all measured index value of a certain city logistics
x
ikcomposing compared sequence Xi , we should find the
correlation between X0 and Xi. The larger the correlation, the more environmental the city logistics is. Therefore, we could judge city logistics systems based on finding the size of the correlation.
Evaluation procedure is as follows:
3.1. To Select the Reference Sequence
Set:
i
is the number of the ith object (city) for evaluation, mi=1,2,⋯, ;
k
is the number of thek
th index for evaluation, k =1,2,⋯,n; vik indicates the score of thek
thindex for the
i
th object. Take the ideal valuev
0k for each indicator as entity of the reference sequence V0, so we get,)
,
,
,
(
01 02 00
v
v
v
nV
=
⋯
In the formula,
v
0k =Optimum (v
ik ), i=1,2,⋯,m;
n k=1,2,⋯,
For a system of evaluation object of
m
, evaluation indexes ofn
, we have the following matrix: = = × mn 2 m 1 m n 2 22 21 n 1 12 11 n m ik V V V V V V V V V ) V ( V ⋯ ⋮ ⋱ ⋮ ⋮ ⋯ ⋯
Reference sequence to be selected is,
)
v
,
,
v
,
v
(
V
0=
01 02⋯
0n3.2. To Normalized Index Value
In order to compare between the various indexes, each index value needs to be normalized, normalized formula is as follows: i ik i ik i ik ik ik
V
min
V
max
V
min
V
X
−
−
=
After the normalization process, we get:
=
=
× mn m m n n n m ikX
X
X
X
X
X
X
X
X
X
X
⋯
⋮
⋱
⋮
⋮
⋯
⋯
2 1 2 22 21 1 12 11)
(
3.3. To Calculate the Correlation Coefficient
Take the normalized sequence X0 =(x01,x02,⋯,x0n) as a reference sequence and Xi =(xi1,xi2,⋯,xin), (i=1,2,⋯,m)
as a compared sequence, Correlation coefficient is calculated as follows: ik k 0 k i ik k 0 ik k 0 k i ik k 0 k i ik X X max max X X X X max max X X min min − ρ + − − ρ + − = ξ
Where,i=1,2,⋯,m;k=1,2,⋯,n;ρ∈[0,1], which is the distinguished factor.
Calculating the correlation coefficient
) , , 2 , 1 ; , , 2 , 1
(i m k n ik = ⋯ = ⋯
ξ
, we could obtain thecorrelation coefficient matrix:
=
=
× mn m m n n n m ikE
ξ
ξ
ξ
ξ
ξ
ξ
ξ
ξ
ξ
ξ
⋯
⋮
⋱
⋮
⋮
⋯
⋯
2 1 2 22 21 1 12 11)
(
Where,
ξ
ikis the correlation coefficient betweenXik andok
X .
3.4. To Calculate the Single-Level Correlation
Taking into account the importance of the indicators are not the same, the correlation calculating method of taking the weight multiplied by the correlation coefficient should be preferred. The priority weight of each index relative to the upper floor target can be calculated based on the Analytic Hierarchy Process,
)
w
,
,
w
,
w
(
In the formula, 1 1 =
∑
= t k kw ,
t
represents the number ofindicators in the layer. Correlation is calculated as follows:
T m
m
i
r
r
r
WE
r
R
=
(
)
1×=
(
1,
2,
⋯
,
)
=
3.5. To Calculate the Ultimate Correlation of Multilayer Evaluation System
By a multilayer evaluation system, the final correlation calculation method is as follows: Synthesize correlation coefficient of each index in
k
layer, we could respectively obtain correlation of each index which belongs to k−1 layer. Then put the obtained correlation of each index in k−1 layer as raw data, continue to synthesize and get correlation of each index in k−2layer. And so on, until we find the correlation of the highest layer so far.3.6. To Judge the Urban Logistics System
According to the correlation ri(i=1,2,⋯,m), judge pros and cons of each object for evaluation and sort it.
4. Empirical Analysis
Taking the status quo of four cities’ (named City1, City2, City3, City4) logistics systems being carried out as an example to illustrate its application.
4.1. To Establish Urban Logistics Green Degree Evaluation System
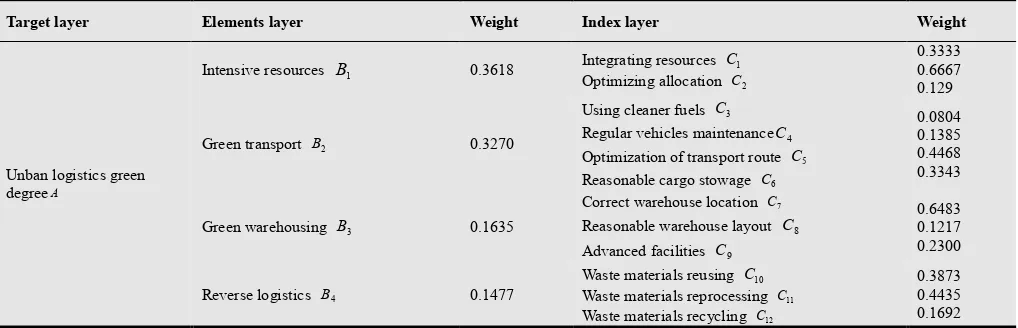
Urban logistics green degree evaluation system is as shown in Table1. The system is composed by three lays of indicators. The first layer is called target layer, which means urban logistics green degree and is represented by A. The second layer is called elements layer, which consists of intensive resources (B1), green transport (B2), green warehousing (B3),
reverse logistics (B4). The third layer is called index layer, which is composed of a total of 12 indicators(C1,C2,⋯,C12).
Note: The reference values in the table refer to the maximum value of each indicator in each city logistics score.
4.2. To Calculate the Single-Level Correlation
Taking the status quo of City1, City2, City3, City4 )
, , ,
(V1V2V3V4 four cities’ logistics systems being carried out as
evaluation object, organize 10 experts to rate each factor of index layer. Each evaluation scores between 0-10, the higher the score, the higher the degree of satisfaction. Using the sub-average method, we could obtain the overall score of 12 factorsv (i=1,2,3,4;k=1,2,3,⋯,12)
ik for each system and the
reference scores
v
ok for the all the factors, see table 2. Reference sequence can be derived from Table 2,) 7,8,8,7 8,8,7,8,8, , 8 , 8 , 8 ( V0 =
After each index value being normalized, take distinguished coefficientρ=0.5, we will have the correlation coefficients of each indicator to each optimum value in the reference
sequence,
}
67
.
0
,
4
.
0
,
1
,
1
,
1
,
4
.
0
,
4
.
0
,
1
,
1
,
5
.
0
,
5
.
0
,
33
.
0
{
)
(
}
1
,
1
,
5
.
0
,
1
,
5
.
0
,
1
,
67
.
0
,
1
,
1
,
5
.
0
,
1
,
67
.
0
{
)
(
}
1
,
1
,
5
.
0
,
1
,
5
.
0
,
4
.
0
,
67
.
0
,
67
.
0
,
67
.
0
,
1
,
67
.
0
,
5
.
0
{
)
(
}
67
.
0
,
5
.
0
,
67
.
0
,
67
.
0
,
4
.
0
,
1
,
1
,
5
.
0
,
67
.
0
,
1
,
67
.
0
,
1
{
)
(
4 3 2 1=
=
=
=
k
k
k
k
ξ
ξ
ξ
ξ
4.3. Correlation Synthesis for Multilayer Structure
Using AHP, through comparing the relative importance of every two indicators, we could get the appropriate proportion of weights to build judgment matrix for upper certain elements related elements of the underlying [6,7,8]. Using Yaahp software to calculate the maximum Eigen values of the judgment matrix and the corresponding eigenvectors, derived single sorting weight vector and total weight vector and get through the consistency test [9,10].The results are shown in Table 3.
By the formula T WE
R= , we could calculate each city’s correlation for each index of
B
layer,) 443 . 0 , 89 . 0 , 613 . 0 , 78 . 0 ( 1 1
1 = C BC =
T B B W E R
Namely the correlation on “intensive resource” in City1, City2, City3, City4 four urban logistics system is 0.78, 0.613, 0.89 and 0.443 respectively.
Also available, ) 678 . 0 , 806 . 0 , 806 . 0 , 595 . 0 ( E W R ) 611 . 0 , 939 . 0 , 550 . 0 , 851 . 0 ( E W R ) 759 . 0 , 849 . 0 , 0.697 , 731 . 0 ( E W R C 4 C 4 4 C 3 C 3 3 C 2 C 2 2 B T B B B T B B B T B B = = = = = =
Further, correlation of A at the highest level index can be obtained ) 609 . 0 , 872 . 0 , 659 . 0 , 748 . 0 ( ] R , R , R , R [ W ) r , r , r , r ( R 4 3 2
1 B B B B AB 4 3 2 1 A = = =
4.4. Comprehensive Evaluation and Sorting for the Green Degree of Urban Logistics
In accordance with the size of the correlation available in
A
R ,the four urban logistics green degree integrated Sorting
from low to high as follows: City4<City2<City1<City3.
In addition, since the correlation of the city1 on "reverse logistics" is 0.595, and the correlation of city2 on "green storage" is 0.55, the correlation of city4 on "intensive resource" is 0.443, each correlation is at the lowest level compared with other cities in the same index which indicates it’s a major bottleneck in the current development and the local government should take greater efforts to improve in the future.
5. Conclusions
explanation of the problems etc., meanwhile, it can help to expand sources of information, improve evaluation analysis of the credibility and enhance the objectivity of the evaluation results in case of incomplete information and inaccurate conditions.
2)In calculating the correlation, using AHP to determine the weight of each index, to account for differences in the degree of importance of each indicator, makes the evaluation results more reasonable and with a strong persuasiveness.
Acknowledgements
The work is supported by Jiangsu Government Scholarship for Overseas Studies and The Youth Foundation of National Natural Science Foundation of China(Grant No.71101072). The authors would also like to thank China Jiangsu University, and California University, Fresno for the support to the first author and the second author as a visiting scholar.
Table 1. Green degree evaluation index system of urban logistics
Target layer Elements layer Index layer
Unban logistics green degreeA
Intensive resources B1
Integrating resources C1
Optimizing allocation C2
Green transport B2
Using cleaner fuels C3
Regular vehicles maintenanceC4
Optimization of transport route C5
Reasonable cargo stowage C6
Green warehousing B3
Correct warehouse location C7
Reasonable warehouse layout C8 Advanced facilities C9
Reverse logistics B4
Waste materials reusing C10
Waste materials reprocessing C11 Waste materials recycling C12
Table 2. Index scores of urban logistics and reference sequence
Index layer City1 City2 City3 City4 Reference
Integrating resources Optimizing allocation 8 7
6 7
7 8
4 6
8 8 Using cleaner fuels
Regular vehicles maintenance Optimization of transport route
Reasonable cargo stowage
8 7 6 7
8 7 7 6
6 8 8 6
6 8 8 4
8 8 8 7 Correct warehouse location
Reasonable warehouse layout Advanced facilities
8 5 6
5 6 7
8 6 7
5 8 7
8 8 7 Waste materials reusing
Waste materials reprocessing Waste materials recycling
7 6 6
6 8 7
6 8 7
8 5 6
8 8 7
Table 3. Urban logistics green degree evaluation index weight summary
Target layer Elements layer Weight Index layer Weight
Unban logistics green degreeA
Intensive resources B1 0.3618 Integrating resources C1
Optimizing allocation C2
0.3333 0.6667 0.129
Green transport B2 0.3270
Using cleaner fuels C3
Regular vehicles maintenanceC4 Optimization of transport route C5
Reasonable cargo stowage C6
0.0804 0.1385 0.4468 0.3343
Green warehousing B3 0.1635
Correct warehouse location C7
Reasonable warehouse layout C8 Advanced facilities C9
0.6483 0.1217 0.2300
Reverse logistics B4 0.1477
Waste materials reusing C10
Waste materials reprocessing C11
Waste materials recycling C12
References
[1] Pan Wenjun,Liang Faqi. To develop the logistics industry based on the theory of circular economy [J]. Logistics Management, 2006, 23(10): 39-43J. Clerk Maxwell, A Treatise on Electricity and Magnetism, 3rd ed., vol. 2. Oxford: Clarendon, 1892, pp.68–73.
[2] David Crawford. What the future holds for ‘green logistics’ [J]. Traffic Engineering and Control, 2009, 50(5): 215-217.K. Elissa, “Title of paper if known,” unpublished.
[3] Hsu Hy Sonya, Alexander Christine A, Zhu Zhiwei. Understanding the reverse logistics operations of a retailer: A pilot study [J]. Industrial Management and Data Systems, 2009.109(4): 515-531.
[4] Liu Sifeng, Xie Naiming. Grey system theory and application (Fourth Edition) [M]. Beijing Science Press, 2010: 44-45.
[5] Deng Julong. Grey predication and decision[M]. Wuhan: Central institute of technology press, 1986: 56-57
[6] Du Dong, Pang Qinghua, Wu Yan. Comprehensive Evaluation of modern methods and case selection [M].Beijing: Tsinghua University Press, 2005: 14-20.
[7] Aya Zeki, Izadbakhsh HR, A combined fuzzy AHP-goal programming approach to assembly-line selection [J]. Journal of Intelligent and Fuzzy Systems, 2007, 18(4): 345-362. [8] Coelli TJ, Prasada Rao DS, O’Donnell CJ, et al. Introduction to
efficiency and productivity analysis [M]. Second Edition. New York: Springer Press, 2005: 202-230.
[9] Andersen B, Fagerhaug T. Performance measurement of logistics processes [J]. Journal of Operation Management, 2003(20): 19-32.