Liquid-Phase Hydrogenation Of
Dimethyl-Nitrobenzene Over Nickel Catalysts
Mansoor Kazemimoghadam
Malek Ashtar University of Technology, Faculty of Chemical and Chemical Engineering, Tehran, Iran mzkazemi@gmail.com
Abstract: The kinetics of liquid-phase hydrogenation of dimethyl-nitrobenzene (DN) on nickel catalyst was studied in the temperature
range of 343–403
K
and a pressure range of 4–10 bar H2, using ethanol as the solvent. Dimethyl-aniline (DA) was the only reactionproduct, generated through the hydrogenation of the Nitro group of dimethyl-nitrobenzene. The effects of hydrogen partial pressure, catalyst loading, dimethyl-nitrobenzene concentration and temperature on the reaction conversion have been reported. Furthermore, an increase in the catalytic activity as the reaction temperature, pressure and weight of catalysts was observed. Conventional Arrhenius behavior was exhibited by catalyst, Ni showed activation energies of 808 J/mol. A simple power law model was used for analysis of the reaction kinetic data.
Keywords: Liquid-phase hydrogenation; Ni catalysts; dimethyl-nitrobenzene; dimethyl-aniline; kinetic
1.
Introduction
Aromatic amines, widely used as important intermediates in the synthesis of chemicals such as dyes, antioxidants, photographic, pharmaceutical and agricultural chemicals, can be obtained easily by the reduction of corresponding aromatic nitro compounds using catalytic hydrogenation and a variety of other reduction conditions. Many reductive agents have been recommended for this transformation and the most classic and practical reductants are zinc, tin, or iron in the presence of an acid. However, most of them lack the chemo selectivity over other functional groups and reduction of aromatic nitro compounds often yield a mixture of products. In addition, the reactions are performed in organic solvents or in the presence of acids, which pose waste-handling problems [1-3]. The selective hydrogenation of nitro compounds is commonly used to manufacture amines, which are important intermediates for dyes, urethanes, agro-chemicals and pharmaceuticals. Hydrogenation of nitro aromatics are used to produce aniline derivatives, which can be carried out in gas or liquid phase by using supported metal catalysts and organic solvents such as alcohols, acetone, benzene, ethyl acetate, or aqueous acidic solutions [4]. The use of these solvents has some drawbacks owing to their toxicity, flammability, or environmental hazards. In addition, the solvent may play a crucial role in the stabilization of reactive intermediates and have a decisive influence on chemical reactions. The rate and the selectivity of aromatic nitro-compounds hydrogenation depend upon different factors such as temperature, hydrogen pressure and concentrations of catalyst and a hydrated compound [5-7]. The main purpose of this study was to evaluate the effects of parameters such as hydrogen pressure and temperature on the rate of dimethyl-nitrobenzene hydrogenation over a Ni catalyst in ethanol-water two components solvent. Solvents are known to have a significant effect on the rate of catalytic hydrogenations. The effects of solvent are attributed to various factors, which include solubility of hydrogen, thermodynamic interaction of solvent with the reactants and products, agglomeration of catalysts in some solvent and competitive adsorption of solvent [8-10]. The solvent employed was ethanol. Further, the recovery of ethanol in the presence of water (formed during the reaction) will be easy. Hence, ethanol was used as a solvent in this study [11].
In this paper the influence of Operation conditions on the catalytic activity for dimethyl-nitrobenzene hydrogenation in an alcoholic solution is presented. The effect of operating conditions on the reactor performance was studied by comparing the conversion of dimethyl-nitrobenzene, under different reaction conditions.
2. Experimental
The details of the experimental set-up, experimental procedures and analytical techniques are presented in this section.
2.1. Materials
All the chemicals used were purchased from Pure Chemicals and used without further purification. Dimethyl-nitrobenzene was used. A 40 wt. % Ni catalyst on alumina-silicate support used to reduction of DN. The average size of Ni particles obtained was shown to be 50µm. dimethyl-nitrobenzene, ethanol, and distillated water used were of laboratory reagent grade. Hydrogen (cylinder purity 99.98%) was used.
2.2. Experimental set-up
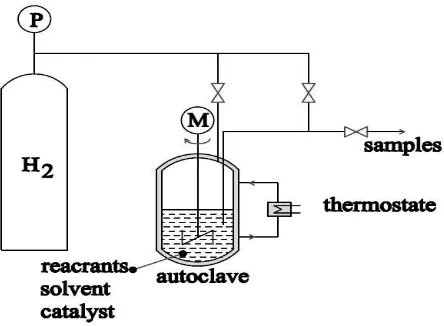
The hydrogenation process was carried out in an isothermal 6L stainless steel autoclave, which allows isothermal conditions due to a heating jacket (Fig. 1).
Figure 1: Experimental set-up for the liquid hydrogenation
The reactor having a diameter of 200 mm (impeller diameter 80 mm) was equipped with an electrically heated jacket, a turbine agitator and a variable-speed magnetic drive ensuring zero leaks. The temperature and the speed of agitation were controlled by means of a controller. The gas inlet, gas release valve, cooling water feed line; pressure gauge and rupture disk were situated on top of the reaction vessel. The liquid sample line and the thermocouple well were immersed in the reaction mixture. The reactor was also provided with a cooling coil. In order to ensure good bubble dispersion, the gas injection is performed through a plunging tube whose exit opening is placed right below the agitation mobile. The hydrogen was supplied at the same rate that it was consumed under isobaric reaction conditions. The samples for the analyses were drawn via a sampling tube. The experiments were carried out using the following procedure; first, DN (99 %) was dissolved in a mixture of 91 %wt of Ethanol (99.9 %) and 9 %wt distilled water. The reactor was filled with 3500 ml solution and the solid catalyst (from 30 to 70 g) was added. Second, the reaction was initiated by removing the air from the reactor by purging with hydrogen and stirring the solution at 800 rpm. The temperature was controlled at 373
K
and the hydrogen partial pressure was kept constant between 4 and 10 bars. The samples were analyzed by gas chromatography and a FID detector [12-14].
3. Experimental procedure
The reactor was first charged with appropriate quantities of the DN, the solvent and the catalyst. It was then purged with nitrogen, prior to the start of the experiment to ensure an inert atmosphere in the reactor. Hydrogen from the cylinder was introduced into the reactor and nitrogen was replaced with it. All the lines were closed. The reactor contents were heated to the desired temperature. The autoclave was then pressurized with hydrogen to get the desired partial pressure of hydrogen. Agitation was then started at the predetermined speed. The consumption of hydrogen due to reaction as well as due to small sampling led to decrease in the total pressure as indicated on the pressure gauge. So, more hydrogen was charged intermittently from the cylinder through manually operated control valve, thus maintaining a constant partial pressure of hydrogen. Samples were withdrawn periodically after sufficient flushing of the sample line with the reaction mixture [15-17].
4. Results and discussion
Heterogeneous catalytic hydrogenation is a reaction involving gas–liquid–solid-phase operation. Various steps occur in series when a gas–liquid–solid reaction occurs [18]. The minimum speed of agitation used was higher than the minimum speed required for the suspension of the catalyst particles. The following assumption was made while studying the heterogeneous catalytic hydrogenation reactions:
1. The activity of the catalyst is maintained throughout in all the experiment, that is, that no poisoning or deactivation of the catalyst occurs.
2. Desorption of the products offered no resistance [19]. The main objective of the work was to investigate the effect of following various process parameters on conversion of nitro aromatic to aromatic amine.
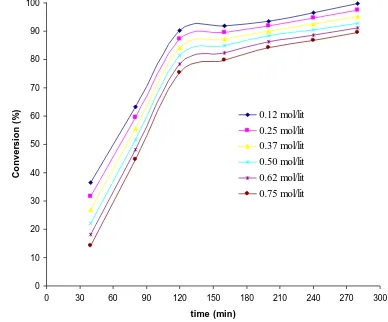
4.1. Effect of the dimethyl-nitrobenzene concentration The effect of DN concentration on the hydrogenation rate was examined by using different DN concentrations (0.12, 0.25, 0.37, 0.50, 0.62 and 0.75 mol/lit) in ethanol. Fig. 2 shows, for the Ni catalyst, the evolution of the conversion level with time at constant hydrogen pressure (10 bars), temperature (363
K
) and weight of catalyst (50 g). Percent conversion was measured using DN in the range 0.5-3 mol in 3500 cm3 ethanol. After reaction time of 210 min, it was observed that with an increase in substrate concentration (dimethyl-nitrobenzene) percent conversion increased almost linearly up to 2.7 mol of DA then surprisingly started decreasing. An increase in the activity as decreasing the DN concentration can be observed. However, if the conversion of the reaction (expressed as the percentage of DN hydrogenated in the mixture) is studied as a function of the reaction time, significant changes are observed. At short reaction times, DA was produced, but at longer reaction times rate of conversion is lower up to reaching a constant value. The higher proportion of DN found at lower conversion levels is attributed to the fact that the lower DN concentration ratio to catalyst loading is easier to hydrogenate compared to the higher DN concentration. Fig. 2 shows that decrease in DN concentration increases the conversion. The conversion is lower at higher DN concentration indicating that the rate of DA formation has a dependency on the DN concentration. DN concentration was varied from 1.0 to 0.05 mol for the catalytic hydrogenation of DN. We observed that the rate of DA formation at high concentrations of DN is low because of substrate inhibition effect present at such high concentrations. Another reason could be that at such high concentrations, external mass transfer resistance may become significant because of the low solubility of hydrogen at high concentrations of the reactant. Therefore low concentrations (0.25-0.5 mol/l) of DN were used for the kinetics studies.Figure 2: Evolution of the conversion level with time at
different dimethyl-nitrobenzene concentration
The effect of time on concentration of DN and DA is shown in Fig. 3. The DA concentration increases with decrease in DN concentration with time. The rate was also reported as proportional to the concentration of DN for its reduction with hydrogen.
0 10 20 30 40 50 60 70 80 90 100
0 30 60 90 120 150 180 210 240 270 300
time (min)
C
o
n
v
e
rs
io
n
(
%
)
Figure 3: Dimethyl-nitrobenzene and dimethyl-aniline
concentrations in solution verses time of reaction
4.2. Effect of hydrogen partial pressure
To study the effect of pressure on conversion of DN, experiments were carried out in the pressure range of 4–10 bars at a DN concentration of 0.25 mol/L in ethanol, temperature of 363
K
. The catalyst loading was kept constant by varying the residence time. Fig. 4 shows a plot of the conversion vs. hydrogen pressures. Fig. 4 indicates that the conversion increases with increase in pressure in the range of pressures studied. This increase in conversion of dimethyl-nitrobenzene is attributed to the increase in the concentration of dissolved hydrogen with increase in pressure, thereby resulting in a higher reaction rate. However, pressure has effect on the conversion at constant loading catalyst because the increase in the reaction rate at higher pressure is countered by the decrease in the catalyst loading. It can be seen that the activity increases as hydrogen pressure increases. When hydrogen pressure increases to 4 atm the rate of dimethyl-nitrobenzene hydrogenation rate increases linearly, then this linearity is destroyed and when the pressure reaches 10 atm the rate of dimethyl-nitrobenzene hydrogenation ceases to be dependent upon hydrogen pressure.Figure 4: Evolution of the conversion level at different
pressure
4.3. Effect of temperature
Catalytic transfer hydrogenation is highly temperature dependant. The reaction did not proceed at room temperature and at lower temperature partially hydrogenated product was
obtained, thus the effect of temperature was studied from 343
K
to 403
K
under otherwise similar conditions (Fig. 5). The conversion of dimethyl-nitrobenzene increased with increase in the temperature of the reaction. The Fig. 5 shows the evolution of the conversion with time at different reaction temperatures for a Ni catalyst. An important enhancement in the catalytic activity as reaction temperature increases can be noted. However, no changes in the selectivity were detected and only dimethyl-aniline was the product obtained. To study the effect of temperature on conversion of dimethyl-nitrobenzene, experiments were carried out in the temperature range of 343-403K
at a substrate concentration of 2 mol/L in ethanol, pressure of 7 bar and a catalyst loading (1% cat/organic phase) with 3500 cm3 solution. Fig. 5 shows that with increase in temperature, the conversion increase at all the temperature levels. These results were obtained after 150 min of reaction time. At temperature of 403 K
more than 95% conversion was obtained at defined conditions.Figure 5: Evolution of the conversion level with time at
different temperature
4.4. Effect of catalyst concentration
The effect of catalyst (Ni) concentration on conversion of DN was studied in the concentration range of 0.00403– 0.00939 mol/lit of organic phase, while keeping the other experimental conditions constant as shown in Fig. 6. The conversion increased with increase in [catalyst], which is due to the proportional increase in the number of active sites. From the results obtained we can say that as the concentration of catalyst increases, the conversion of dimethyl-nitrobenzene to dimethyl-aniline with 100% selectivity. An increase in the activity as the catalyst weight increases can be noted.
0 0.1 0.2 0.3 0.4 0.5 0.6 0.7 0.8 0.9 1 1.1
0 30 60 90 120 150 180 210 240 270 300 Time (min)
C
o
n
c
e
n
tr
a
ti
o
n
(m
o
le
)
RNO2
RNH2
0 20 40 60 80 100 120
0 2 4 6 8 10 12
Pressure (bar)
C
o
n
v
e
rs
io
n
(%
)
0 10 20 30 40 50 60 70 80 90 100
0 50 100 150 200 250
time (min)
C
on
ve
rs
ion
(
%)
70 C
85 C
100 C
115 C
Figure 6: Evolution of the conversion level with time at
different weight of catalyst
5. Reaction kinetic data
The rate of reaction was evaluated by fitting the DN concentration vs. time plot to a polynomial followed by differentiation and calculation at various time intervals. The classical approach of reporting kinetic data in terms of turnover frequency (TOF) defined as
(1)
(time)
centers)
(
reacted
molecules
of
.
active
no
TOF
Would have been the ideal choice. However, gaining knowledge of the active centers on the catalyst surface is a rather difficult task necessitating highly sophisticated techniques. Chemisorptions of H2 (or DN) would have given
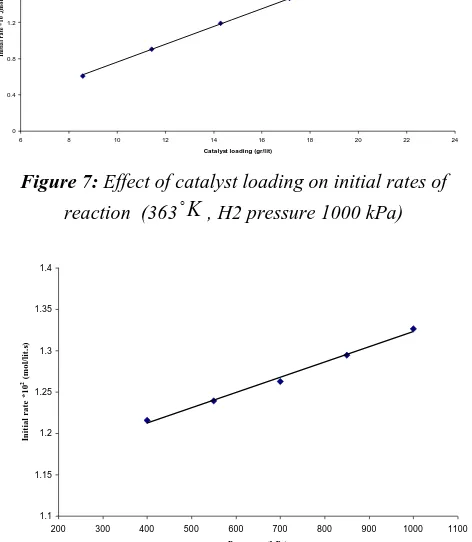
some idea. Our catalyst particles are not spherical in shape but of irregular shape. It was, therefore, decided to express rates as mol kgcat−1 min−1. After all, the active centers are proportional to the catalyst weight. From a process engineering point of view, in the absence of exact knowledge of active centers, this simpler approach would be more comprehensive. The effect of catalyst loading on the initial rates was studied in the range of catalyst concentrations 8.57–20 gr/lit, at 363
K
and 1000 kPa hydrogen partial pressure. These results are shown in Fig. 7. The initial rates increased linearly with the catalyst loading in the range studied. The effects of various reaction parameters such as hydrogen partial pressure and feed DN concentration on the initial rate were studied at 343-403 K
and are described below. The effect of hydrogen partial pressure on initial rates was studied in the range of hydrogen partial pressures 400– 1000 kPa at an initial DN concentration of 0.5 kmolm−3. The initial rate was found to increase linearly with the hydrogen partial pressure. The results are shown in Fig. 8. These results are shown that reaction order, being a first-order dependence on hydrogen pressure for the Ni catalyst. On the other hand, a first-order dependence on hydrogen for Ni catalyst was found.Figure 7: Effect of catalyst loading on initial rates of
reaction (363
K
, H2 pressure 1000 kPa)Figure 8: Effect of hydrogen partial pressure on initial rates
(initial DN concentration 0.5 kmolm−3, Catalyst loading
12.5 kgm−3, 363
K
)Experiments were conducted at varying feed DN concentrations in the range 0.12–0.75 mol/lit, at 1000 kPa hydrogen partial pressure. The dependence of the initial rates on feed DN concentration is presented in Fig. 9.
Figure 9: Effect of initial DN concentration on initial
rates(H2 pressure 700 kPa, catalyst loading 12.5 kgm−3,
363
K
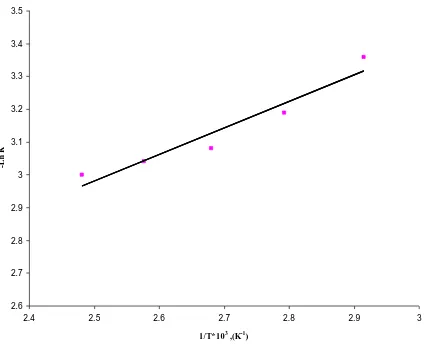
)5.1. Arrhenius plot
It was found that reaction temperature had a strong effect on the initial rate of the reactions. The initial rates were found to increase with increasing the reaction temperature for the reaction. The effect of temperature on the rate of reaction of dimethyl-nitrobenzene with aqueous ethanol was studied in the range of 343–403
K
in the presence of a catalyst, Ni. The reaction rate increases with temperature for the84 86 88 90 92 94 96 98 100
0 20 40 60 80 100 120 140 160 180 200 220
tim e (m in)
C
o
n
v
e
rs
io
n
(%
) 0.00403 mol/lit
0.00537 mol/lit
0.00671 mol/lit
0.00805 mol/lit
0.00939 mol/lit
0 0.4 0.8 1.2 1.6 2 2.4
6 8 10 12 14 16 18 20 22 24
Catalyst loading (gr/lit)
In
it
ia
l
r
a
te
*
10
4,(m
o
l/
lit
.s
))
1.1 1.15 1.2 1.25 1.3 1.35 1.4
200 300 400 500 600 700 800 900 1000 1100
Pressure, (kPa)
In
it
ial
r
at
e
*
10
2 (
m
ol
/lit
.s
)
0.1 0.5 0.9 1.3 1.7 2.1
0.1 0.2 0.3 0.4 0.5 0.6 0.7 0.8 0.9
NX concentration (mol/lit)
In
iti
al
.R
ate
*
10
4(mol
/lit
.s
dimethyl-nitrobenzene. The initial rates were calculated at different temperatures and an Arrhenius plot of ln (initial rate) against 1/T (
K
1) was made (Fig. 10). The apparent activation energies for this kinetically controlled reaction were calculated from the slopes of the straight lines as 808 J/mol. The high values of apparent activation energy confirm that the reaction systems are kinetically controlled.Figure 10: Arrhenius plot for 40% Ni catalyst
5.2. Power law model
The reaction kinetics was modeled by fitting a power law model to the experimental data. The rate of reaction was represented as r = k [A]m[B]n, where [A] = (HAPA). A and B
denote hydrogen and DN, respectively, and HA is the
solubility parameter. The solubility of hydrogen in ethanol at the given partial pressure was used. The values of m and n were found using regression analysis. The resulting rate expression was
,
]
[
[A]
)
T
97.2
-(
exp
57
.
2
0.45B
0.74r
Where T is in Kelvin. The activation energy obtained from this expression was 808 J mol−1. This indirectly confirms the absence of diffusional (mass transfer) resistances. The power law model is always useful for identifying controlling regime (mass transfer or kinetics) while designing a commercial reactor. Heterogeneous models based on reaction mechanisms were proposed for a further in-depth study on the observed reaction kinetics.
6. Conclusions
The kinetics of liquid-phase catalytic hydrogenation of dimethyl-nitrobenzene to dimethyl-aniline was studied in a stirred three-phase slurry reactor between 343
K
and 403K
using a hydrogen partial pressure range of 4–10 bars, with a 5% Ni catalyst. Ethanol was used as the reaction medium. The effects of various parameters on the reactions of DN were studied to determine the dependencies of the reaction rates on the concentrations of various species present in the reaction system. The following sections report the effects of different parameters on the rates of dimethyl-nitrobenzene reduction by aqueous ethanol in the presence of a catalyst, Ni. The reaction kinetic data were modeled using the power law rate expression. The order of the reaction with
respect to dimethyl-nitrobenzene was 0.45 and that of hydrogen was 0.74.
References
[1] P. Reyes, H. Rojas, J.L.G. Fierro, Kinetic study of liquid-phase hydrogenation of citral over Ir/TiO2 catalysts, Applied Catalysis A: General 248 (2003) 59– 65.
[2] P. Hal, V.V. Mahajani, Catalytic transfer hydrogenation: o-nitro anisole to o-anisidine, some process development aspects, Chemical Engineering Journal 104 (2004) 27– 33.
[3] Dilip R.Patel, R.N. Ram, Hydrogenation of nitrobenzene using polymer anchored Pd (II) complexes, Journal of Molecular Catalysis A: Chemical 130 (1998) 57-64.
[4] Volker Holler, Dagmar Wegricht, Igor Yuranov, Lioubov Kiwi-Minsker, and Albert Renken, Three-Phase Nitrobenzene Hydrogenation over Supported Glass Fiber Catalysts: Reaction Kinetics Study, Chem. Eng. Technol. 23 (2000) 3.
[5] Nivedita S. Chaubal, Manohar R. Sawant, Nitro compounds reduction via hydride transfer using mesoporous mixed oxide catalyst, Journal of Molecular Catalysis A: Chemical 261 (2006) 232–241
[6] Shao-Pai Lee, Yu-Wen Chen, Nitrobenzene hydrogenation on Ni–P, Ni–B and Ni–P–B ultrafine materials, Journal of Molecular Catalysis A: Chemical 152 _2000. 213–223.
[7] Sunil P. Bawane, Sudhirprakash B. Sawant, Hydrogenation of p-nitrophenol to metol using Raney nickel catalyst: Reaction kinetics, Applied Catalysis A: General 293 (2005) 162–170.
[8] Sunil K. Maity, Narayan C. Pradhan, Anand V. Patwardhan, Kinetics of the reduction of nitrotoluenes by aqueous ammonium sulfide under liquid–liquid phase transfer catalysis, Applied Catalysis A: General 301 (2006) 251–258
[9] Prakash D. Vaidya, Vijaykumar V. Mahajani, Kinetics of liquid-phase hydrogenation of valeraldehyde to n-amyl alcohol over a Ru/Al2O3 catalyst, Chemical Engineering Science 60 (2005) 1881 – 1887.
[10]T. Swathi, G. Buvaneswari, Application of NiCo2O4 as a catalyst in the conversion of nitrophenol to p-aminophenol, Materials Letters 62 (2008) 3900–3902.
[11]Leanne McLaughlin, Ekaterina Novakova, Robbie
Burch, Christopher Hardacre,
Hydrogenation/hydrogenolysis of disulfides using sulfided Ni/Mo catalysts, Applied Catalysis A: General 340 (2008) 162–168.
[12]Sachin U. Sonavane, Manoj B. Gawande, Sameer S. Deshpande, A. Venkataraman, Radha V. Jayaram, Chemo selective transfer hydrogenation reactions over nanosized c-Fe2O3 catalyst prepared by novel
2.6 2.7 2.8 2.9 3 3.1 3.2 3.3 3.4 3.5
2.4 2.5 2.6 2.7 2.8 2.9 3
1/T*103 ,(K-1)
-L
n
combustion route, Catalysis Communications 8 (2007) 1803–1806
[13]Jia-Huei Shen, Yu-Wen Chen, Catalytic properties of bimetallic NiCoB nanoalloy catalysts for hydrogenation of p-chloronitrobenzene, Journal of Molecular Catalysis A: Chemical 273 (2007) 265–276.
[14]Tatiana Tehila Bovkun, Michael Grayevsky, Yoel Sasson, Jochanan Blum, Liquid phase hydrogenation and hydrodenitrogenation of aromatic nitrogen-containing environmental pollutants, Journal of Molecular Catalysis A: Chemical 270 (2007) 171–176
[15]Ekaterina K. Novakova, Leanne McLaughlin, Robbie Burch, Paul Crawford, Ken Griffin, Christopher Hardacre, Peijun Hu, David W. Rooney, Palladium-catalyzed liquid-phase hydrogenation/hydrogenolysis of disulfides, Journal of Catalysis 249 (2007) 93–101.
[16]Yu-Zhi Haoa, Zuo-Xi Li, Jin-Lei Tian, Synthesis, characteristics and catalytic activity of water-soluble [Pd(lysine•HCl)(Cl)2] complex as hydrogenation catalyst, Journal of Molecular catalysis A: Chemical 265 (2007) 258–267.
[17]Christopher M. Vogels, Andreas Decken and Stephen A. Westcott, Catalyzed hydroboration of nitrostyrenes and 4-vinylaniline: a mild and selective route to aniline derivatives containing boronate esters, Tetrahedron Letters 47 (2006) 2419–2422.
[18]Qiong Xua, Xin-Mei Liu, Jun-Ru Chen, Rui-Xiang Li, Xian-Jun Li, Modification mechanism of Sn4+ for hydrogenation of p-chloronitrobenzene over PVP-Pd/Al2O3, Journal of Molecular Catalysis A: Chemical 260 (2006) 299–305