Published online November 20, 2014 (http://www.sciencepublishinggroup.com/j/sr) doi: 10.11648/j.sr.20140205.20
ISSN: 2329-0935 (Print); ISSN: 2329-0927 (Online)
Differences between the actual scene model and the image
model for computation of visual depth information of early
vision
Zhao Songnian
1, *, Yu Yunxin
2, Zhao Yuping
3, Jin Xi
4, Cheng Wenjun
1 1LAPC, Institute of Atmospheric Physics, Chinese Academy of Sciences, Beijing 100029, China 2Institute of Geophysics of SSB, Beijing 100029, China3Beijing Jetsen Century Technology Co., Ltd., Beijing 100191, China
4China rescue and salvage of ministry of the People’s Republic of China, Beijing 100736, China
Email address:
[email protected] (Zhao S.)To cite this article:
Zhao Songnian, Yu Yunxin, Zhao Yuping, Jin Xi, Cheng Wenjun. Differences between the Actual Scene Model and the Image Model for Computation of Visual Depth Information of Early Vision.Science Research. Vol. 2, No. 5, 2014, pp. 135-149.
doi: 10.11648/j.sr.20140205.20
Abstract:
In this paper, we introduced two viewing modes, "Scene Mode" and "Picture Mode", for early visual depth perception depending on the dimensions of the object being viewed. The essential difference between these two modes of visual depth perception is still unclear. We discuss the basic methods of introducing a three-dimensional Cartesian system into a plane to express the depth information of an image, estimate the loss of depth information caused by this approach, and provide an analysis of the important role of providing depth information based on size constancy and vanishing point in the two viewing modes. We studied the problem of how the retina and visual cortex separate the plenoptic (all-optical) function, which is the input representation of vision, by neural computing in scene mode. We also studied the problem of how to extract information about the position and angle of light beams in the light field, and then determined the output representation of the visual depth perception. In the absence of any stereoscopic cues, such as texture, gradient, shade, shadow, color, occlusion, and binocular disparity, we compare the main differences of visual depth perception between scene mode and picture mode using a cube being viewed and its line drawing, which respectively represent the two modes.Keywords:
Vision, Perceptual Mode, Vanishing Point, Dimensions, Size Constancy1. Introduction
The main process of vision is first to “look” at objects and the environment; the viewer then “sees” the outside world, finds something of interest, and then extracts and processes related information from this visual input [1-4]. In the past, vision and visual perception research has focused on the neural response to specific stimuli; owing to the limit of current experimental equipment and methods (e.g., fMRI, ERPs), visual stimulus images rarely involve actual scenes. Comparative studies of the visual perception mechanism for actual scenes and stereo images on a 2D plane are also rare [5-9]. In fact, complex visual objects can in essence be divided into two categories according to the physical space dimension, namely three-dimensional actual scenes and various images displayed on a 2D plane, such as television, video,
visual depth perception, and do not involve computer vision, or photography.
To study the above issues, a useful way to begin is to ask: why are stereo visual perceptions formed from images and paintings displayed on a flat surface? For example, a transparent cube drawn in the plane (e.g., a Necker cube [10-11]), even without a texture gradient, light and shade, shadows, color and occlusion cues and binocular parallax, is very naturally perceived as a cube. Similarly, when a meandering line is drawn in the plane that extends into the distance, a stereoscopic perception of a river is easily generated. How is such a visual perception effect formed? There is at present no relatively clear understanding of this phenomenon, let alone a theoretical neuroscientific explanation. It is quite commonplace, and we are accustomed to it; but even with careful consideration, it is not easy to explain. Marr, as one of the founders of visual computational theory and computer vision, expressed his confusion on this issue: when proposing the principle of graceful degradation, he pointed out that if the visual system calculates a rough two-dimensional description from an image, it will be able to calculate a rough three-dimensional description represented by this image. In other words, human vision can perceive a real three-dimensional description from a stereoscopic image on a two-dimensional plane. Marr asked: “Contours of the images are two-dimensional, but we are often to understand these contours from a three-dimensional perspective. Therefore, the key question is how do we make a three-dimensional interpretation of the two-dimensional contour? Why can we make such an interpretation?” [2].
When viewing a real 3D scene, although a two-dimensional visual image is formed on the retina, the viewer is able to generate three-dimensional visual perception and can perceive the three-dimensional structure of the actual scene. However, when viewing various images on a two-dimensional plane, the stereoscopic structure of the image can be perceived. In this article, to compare these with each other, we denote viewing an actual scene as "Scene Mode", and denote viewing various images on a two-dimensional plane as "Picture Mode". Obviously, Marr raised issues related to the basic characteristics of scene mode and picture mode, and also related the similarities and differences of their neural mechanisms. Thus, this is a basic problem in vision, cognitive psychology, computer graphics, computer vision, image rendering, 3D display and computational photography. However, this article’s scope is mainly limited to the aspect of human early vision.
Scientific and technical personnel in these areas have been exploring this basic question of human depth perception, particularly various cues of three-dimensional perception [12-20]. They have also focused on how to better express the three-dimensional structure of the scene through image rendering methods [21-23], and how to better improve the quality of 3D displays. Currently, many of these results have already been achieved. However, for the study of human early visual depth perception, a more appropriate research approach involves excluding a variety of cues that can cause
three-dimensional visual perception (such as texture, gradient, shading, shadow, color, occlusion, any other three dimension- nal cues and binocular disparity). We also use a simple line drawing of a cube as a basic stimulus pattern (and therefore do not have to consider the complex structure of the image [24]). Finally, we take the question, “Why can we express a three-dimensional structure in a two-dimensional plane?” as a key research topic. In our research, we discuss a basic method of expressing the stereoscopic structure of an image on a two-dimensional plane, and provide an analysis and an estimation of the loss of depth information caused by this approach. Furthermore, we outline the important roles of size constancy and vanishing point in the stereo perception of images expressed on the plane, as well as conjugate mapping between vanishing point and visual image [25,26]. We also outline the mechanism of neural computations of the retina and the visual cortex using a dual-parameterized method separating full-optical (plenoptic) functions to extract visual information; we determine the plenoptic functions as the input representation of visual depth perception in scene mode, compared with picture mode, in which pictures are input as a representation of human vision.
2. 2D and 3D Methods and Geometry
Introduction
2.1. Basic Representation Method and the Information Loss of Three-Dimensional Visual Perception
In three-dimensional space, the three axes of the Cartesian rectangular coordinate system are orthogonal to each other (strictly speaking, the three planes (xoy; yoz; zox) are perpendicular to each other). While it is possible to draw up a Cartesian coordinate system in the plane, the three coordinate axes are not orthogonal to each other; in fact, we also cannot draw the orthogonal coordinate system on the plane. In three-dimensional space, axes (x, y, z) are orthogonal to each other, so to distinguish these cases when the Cartesian coordinate system is represented in a two-dimensional plane, we denote an axis as the
ˆz
-axis instead of the z-axis; that is, in the two-dimensional plane, the three axes of the Cartesian coordinate system are denoted by the symbols x, y, andˆz
, as shown in Figure 1.In fact, the
ˆz
-axis and the xoy plane are in the same actual plane (M-plane), and therefore, it is impossible to actually draw up aˆz
-axis that is perpendicular to the xoy plane. That is, we cannot really draw theˆz
-axis perpendicular to the ox axis. However, in Figure 1, note that the included angle between theˆz
-axis and the ox-axis is
. When
90
o, in the two-dimensional plane, theˆz
-axis coincides only with the oy-axis. When180o, theˆz
-axis coincides only withthe ox-axis.
Only when 0o or180o will we perceive the
namely xoy, yo
ˆz
andˆz
ox. In this case, although the xoy plane and the yoˆz
planes are not orthogonal (the included angle between both of them is
), the xoy plane and the yoˆz
plane are both orthogonal to theˆz
ox plane. In this case, the human visual system can strongly perceive that the xyˆz
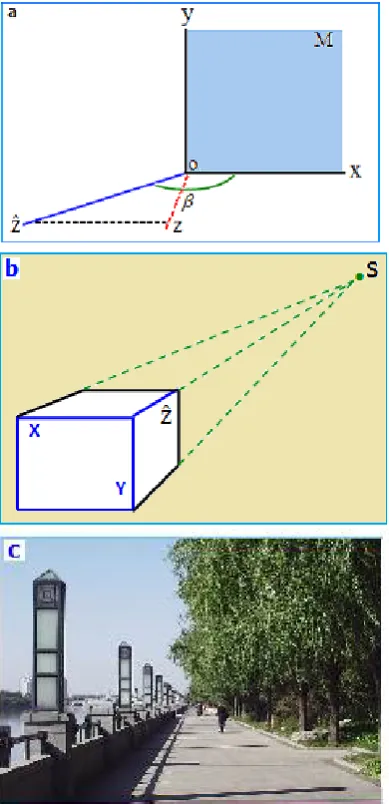
coordinates system forms a stereoscopic space. In this article, we will call this “stereoscopic perceptual space” in the sense of cognitive psychology, to distinguish it from three-dimensional physical space, in which planes xoy, yoz and zox are orthogonal to each other. This terminology is only for the sake of brevity.Figure 1. Stereoscopic perceptual coordinate system on a plane. Human vision can perceive the spatial stereoscopic effects formed by the three coordinates axes x, y and
ˆz
. (a) The basic expression of three-dimensional Cartesian coordinate system on a plane; (b) the relationship between the Cartesian coordinate system and the affine coordinate system is established by the vanishing point on the plane; (c) the image of a real scene corresponding to one vanishing point of part (b) (Figure 1(c) with permission from Li Shuzhong and Sung Guangyu).To compare the three-dimensional physical space and the psychological stereoscopic space, one can "imagine" the following mathematical treatment: let the xy
ˆz
coordinatesystem coincide with the xyz coordinate system. The specific steps are: first, make the xoy plane in three-dimensional physical space and the xoy plane in the three-dimensional perception of space overlap. Second, let the
ˆz
ox plane coincide with the zox plane. It is important to note that the yoˆz
plane is not coincident with the yoz plane; the included angle between them is(
90 )
o (without considering the sign of the angle). We know that, according to the practice of computer graphics or computer vision, when the xoy plane is set as the imaging plane, the z-axis and theˆz
-axis will just carry the depth information of the xyz coordinate system and the xyˆz
coordinate system, respectively (of course, this is true for visual perception). We naturally want to know what the difference is between the following two kinds of depth information: one that is obtained in the z-direction while looking at an actual scene (corresponding to the xyz coordinate system), and the other that is perceived in theˆz
-direction while looking at a picture with the same scene (corresponding to the xyˆz
coordinate system).The easiest way is that the value on the
ˆz
-axis is converted into the one on the z-axis, which is equivalent to the projection of theˆz
-axis into the z-axis; its value is denoted by the symbolz
, i.e.,o
ˆ
z
zcos(
90 )
(1)This means that by comparison with the value of corresponding depth information in the z-axis, the degree of narrowing
d
of the depth information carried by theˆz
-axis, may be calculated aso
ˆ ˆ ˆ
d = z z z zcos( 90 )
= z [1 cos(ˆ 90 )]o (2)
It is not hard to imagine, if the yo
ˆz
plane coincides with the yoz plane, or in psychological space coordinates, that theˆz
-axis is really perpendicular to the ox-axis, which means that
90
o and the loss of information
d 0
. This is, of course, impossible, since the so-called "three-dimensional" coordinate system drawn in the plane, which is dependent on the psychological space formed by human visual perception, can be seen as "attached to" the two-dimensional physical plane. Thus, the constraint condition applied by the plane to the psychological space is
0
o and
90
o. Perhaps humanity has accumulated such rich experience with visual perception and associated functions in three-dimensional space that even in the absence of stereo cues, such as perspective, texture gradient, shade, shadow, color and occlusion as well as binocular disparity, we are able to naturally perceive that the x-axis, y-axis andˆz
-axis in Figure 1 are orthogonal to each other and form a space with stereoscopic properties.linearly shrinks toward the ox-axis along the zo-axis, which contracts toward the horizontal vanishing line, as shown in Figure 2. Since the plane
ˆz
ox is naturally tilted, it cannot be perpendicular to plane xoy. The inclined plane actually causes a kind of visual perception of the sky and the ground plane, and plane oxy is perpendicular to planeˆz
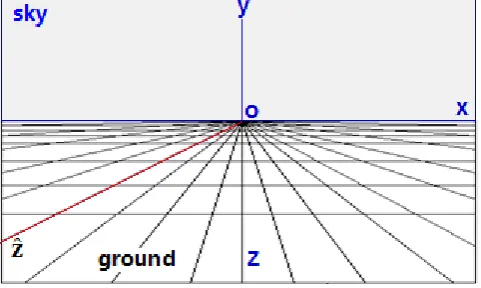
ox or basic ground.Figure 2. Linear shrinkage process of a plane toward the horizon (horizontal vanishing line). In this graph the axis
ˆz
is also drawn, which is shown in Figure 1. Such a splitting of the plane can obtain the visual effects of three-dimensional perception. When shrinking the plane, the tilt anglewith respect to the horizontal plane is determined by the angle between theˆz
-axis and the ox- axis.This further shows the important role of the vanishing point and vanishing lines in forming stereoscopic visual perception from a picture on the plane.
In general, compared with the z-axis in three-dimensional space, the depth perception of the scene provided by the
ˆz
-axis in the two-dimensional plane will be reduced. The amount of this reduction is given bycos(
90 )
o , which indicates the information loss of stereoscopic perception obtained by viewing a three-dimensional image in the plane. When a three- dimensional image of the actual scene is expressed on a two-dimensional plane in the manner of Figure 1 (this is the only way to express it), the depth information provided in the two-dimensional image, with different angles
, means that the depth perception of scenes is also different.It is particularly noteworthy that it is impossible to actually draw the
ˆz
-axis perpendicular to the plane xoy; it is also impossible to really draw theˆz
-axis perpendicular to the ox-axis. In Figure 2, it seems that the ground surface is contracting toward the ox -axis, which is also contracting toward the horizontal vanishing line, wherein the ground is naturally tilted so it cannot be perpendicular to the plane xoy. The inclined plane actually causes such a visual perception; that is, the ox-axis divides the entire plane into two parts: the sky and the ground. This means that, in scene mode, the imaging plane (or retina) of biological vision corresponds to the xoy plane here and is also perpendicular to the optical axis, and the optical axis is coincident with the depth axis (z-axis). However, in picture mode, the z-axis orˆz
-axis cannot be perpendicular to plane xoy. When looking at the visual image, the optical axis of vision may be perpendicular to thetwo-dimensional image plane, which is perpendicular to plane xoy; with the change of gaze angle, the optical axis of vision is no longer perpendicular to the image plane. In addition, to further demonstrate the important role of the vanishing point and vanishing lines to form a three-dimensional visual perception on the plane, please note the z-axis and
ˆz
-axis in Figure 2.From the picture in Figure 1C, it can be seen that the orientation of the optical axis of the camera points to the distant vanishing point, but it is very close to the orientation of the
z
-axis of Figure 2, rather than theˆz
-axis; the ground is clearly tilted in the direction toward the vanishing point. For this reason, there is an effect of upward-sloping for the visual perception, and the sense of reality of a three-dimensional scene in pictures is weakened. However, in an actual scene, when looking at a straight road leading into the distance, this effect is much less obvious. If the direction of the camera’s optical axis is consistent with theˆz
-axis in Figure 2, it will greatly reduce the effects of upward-sloping and increase the sense of reality of three-dimensional visual perception, which also confirms that the interpretations of Figures 1 and 2 made in this paper are reasonable.Incidentally, the image-forming process of the camera’s optical system and the imaging process of optical system of the human vision have some similarities (we shall not consider the differences between them here in detail), and therefore, the expression of photographs and paintings is based on method of Figures 1 and 2.
2.2. Important Role of the Vanishing Point in 3D Space and on the 2D Plane
Why can the technique shown in Figure 1 express three-dimensional structure on the two-dimensional plane? The presence of the vanishing point (infinity point) of visual perception is an important reason. In particular, it is closely related to the formation of psychological coordinates, which in the past did not attract people's attention.
When watching parallel railway tracks fade into the distance, the human visual system perceives the intersection of the parallel lines at a faraway point, which is determined by the basic optical characteristics of the visual system [27-31]. There is no corresponding infinity point in the Cartesian rectangular coordinate system; however, it is possible to add a new coordinate point (
a
) in homogeneous coordinates, thus establishing a mapping between the Cartesian coordinate systemR
nand the affine coordinate systemP
n:n n
R
®
P
:T T
1 2 1 2
T T
1 2 1 2
( , , , )
( , , , ,1)
( , , , ,0)
( / , / , ,
/ ,1) ,
0
n n
n n
x x
x
x x
x
x x
x
x a x a
x a
a
®
®
®
Λ
Λ
Λ
Λ
(3)The infinity point
( , , , , 0)
x x
1 2Λ
x
n T is just the limitingcase of
( / , / ,
x a x a
1 2Λ
,
x a
n/ ,1)
T whena
®
0
,point in the distance [1, 4, 7, 32, 33]; the infinity point mapped onto the retina (the imaging plane) will form a visual image as shown in Figure 3.
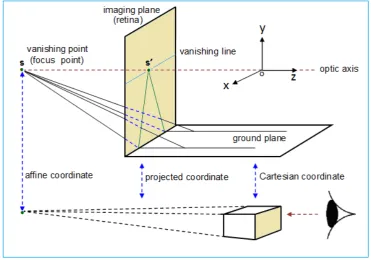
The optical axis of vision points to a distant focus, that is, the fixation point. Straight parallel lines converge at the focus. The focus and its vanishing line project onto the retina, i.e., the imaging plane. Through the vanishing line and vanishing point in the retina, the visual system can perceive a distant intersection in scenes from the outside world. Figure 2 shows the Cartesian coordinate system, in which the z-axis is
consistent with the optical axis of vision. Of particular note is that the parallel lines from infinity are focused on the retina by means of the lens of vision, which is similar to watching parallel railroad tracks converging at one point in the distance, so that the vanishing point is closely related to the parallel lines by affine transformation and its homogeneous coordinates. The relationship between the Cartesian coordinate system, projective coordinate system and affine coordinate system is shown in Figure 3.
Figure 3. Optics model of the affine transformation of parallel lines implemented by vision
Worthy of particular note is equation (3), which contains the conversion between the Cartesian and affine coordinate systems, in which the key is the limit
a
®
0
, i.e., when the distance between an observer and his/her fixation point or spatial range of visual gaze is very small, and the Cartesian coordinate system plays a major role. As
0
, or the fixation point goes into the distance, an affine coordinate system instead of a Cartesian coordinate system comes into play, and parallel lines gradually converge to a point that is simply the vanishing point (Figure3).We know that the affine coordinate system is introduced mainly to reflect the structure of the human retina and to describe the features of vision’s optical system (that is, the vanishing point and size constancy). The process of viewing an actual scene via human vision is essentially (linear) perspective projection from 3D visual space
P
3( , , )
x y z
to 2D retinal imaging planeP
2(
fx z fy z f
/ ,
/ , )
, where the focal lengthf
is the distance (about 18–22 mm) between the imaging plane and the optical center (the projection center). It is also an indirect measure of thez
-axis, because the scaling factorfor the projection is
f z
/
; asz
changes, the scaling factoraffine coordinate system, where M
( , , ,1)
x y z
is a pointin 3D space,
m
(
fx z fy z
/ ,
/ ,1)
is a point on the2D plane,P
is the projection matrix, and the projection equation has the following form:
0 0 0 0 0 0 0 0 1 0
1
k k
x fx f
y fy f
z z
or 3
k
zmP M (4)
If
z
k is the depth of field, it is also the distance from the focal plane (or the principal plane) to the point M (or anobject at distance
L
in Figure 9, orl
of equation (20)). For the “Picture” mode, the human visual system takes input from the picture on the two-dimensional plane, and must therefore perform a projective transformation from the 2D image to the 2D retina. This is the mapping of the pictures to the retina. Here, the projection equation is simplified to the following form:0 0
1
x
fx f
y
fy f
or
2 ˆ
ˆzmP M (5)
For the imaging plane, the difference between z and
ˆz
is caused by the included angle
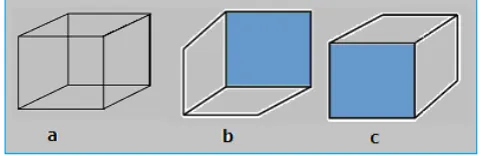
between them, as shown in Figures 1 and 2. Obviously, equations (4) and (5) already show one of the important differences between scene and picture modes.As an example of the application of the vanishing point, the inversing of a Necker cube, which is a known problem in stereoscopic perception, can be explained by the alternating of a Cartesian coordinate system and an affine coordinate system. The Necker cube has a constant perspective angle; i.e., each of the four sides of a Necker cube (see Figure 4) in the vertical direction, horizontal direction and tilt direction are parallel to each other.
There seems to be no vanishing point in Figure 4. In fact, each of the four parallel sides extend to infinity in the left and right, up and down, and forward and backward directions. The parallel sides converge together and inevitably form vanishing points, all of which form a closed circle. This closed circle is the vanishing line. The circular vanishing line is the fundamental reason why human visual perception can invert opposite sides for the front and back of the cube in Figure 4. In the actual scene, visual perception does not need the condition “under the limit case
a
®
0
” to perceive the emergence of the vanishing point; in human vision, parallel railway lines usually seem to converge at a point at a certain distance, but not at an infinite distance. This situation provides practical possibilities and specific effective ways that the 3D depth of an image can be displayed on a 2D plane.In computer vision, the vanishing point is called the infinity
point. The vanishing point has an important role in implement- ting the three-dimensional Cartesian coordinate system in the two-dimensional plane and in expressing stereo scenes in the 2D plane. There are three basic types of the vanishing point in the natural scene, namely, one, two and three vanishing points,
Figure 4. Inversion phenomenon and three-dimensional visual perception of a Necker cube. (a) Necker cube, which can be perceived as in (b), or as in (c)
respectively [4,5,7]. In a variety of buildings and real landscapes, both in photography and during actual viewing under various visual angles, these types of vanishing points can be found.
The coordinate axes (x, y,
z
ˆ
) of the three-dimensional Cartesian coordinate system in a plane. as can be seen from Figure 1, all three kinds of Cartesian coordinate systems that can be drawn in a plane (that is, from which stereoscopic visual perception can be obtained), without exception, have a mapping with the vanishing point. In other words, the existence of the vanishing point is a necessary condition for drawing up a three-dimensional Cartesian coordinate system in the plane.From Figure1(c), because of visual perception effects, the axes x, y and
z
ˆ
appear to be orthogonal to each other; they are in fact unable to be orthogonal in the two-dimensional plane. In the manner shown in Figure 1, there is an arbitrary angle
between thez
ˆ
-axis and the x–y plane or between axes x, y andz
ˆ
; however, 0o (or 180o) ando
90
(or 270o).
Thus, in three-dimensional space, the depth axis z is perpendicular to the imaging plane (xoy) of the retina, and the optical axis of vision is consistent with the z-axis; that is, both the optical axis and the z-axis are, at the same time, perpendicular to the imaging plane. However, in the two-dimensional plane, the
z
ˆ
-axis is not perpendicular to the (xoy) plane (see Figure 1). The optical axis may be perpendicular to the (xoy) plane; however, the optical axis for vision is not consistent with thez
ˆ
-axis, which is one of the fundamental differences between actual three-dimensional scenes and stereoscopic images on the two-dimensional plane.perception of the original gazed image may vary greatly, especially the change in stereoscopic visual perception. For example, as long as we are look at the same picture (such as an advertising picture) from a different perspective, we can obtain the effect of a different visual perception of the same picture.
2.3. Size Constancy of Visual Perception in 3D Space and on the 2D Plane
How can the 3D structure of an image be expressed in a 2D plane? In addition to the existence of the vanishing point in visual perception, this problem is also closely related to size constancy. From the viewpoint of visual information processing, the vanishing point is a basic condition for the existence of size constancy. Figure 1 is just a reflection of visual characteristics, that is, in Figure 1 the constraints (namely
0
o or
90
o) are consistent with the actual presence of the vanishing point (see also Figure 5).We know that when observing the outside world, human vision shows size constancy for visual properties. In short, the sensory perception of the observer is that the same object is far away if it is small and near if it is large. Size constancy is closely related to the affine transformation of the vanishing point, which appears in visual properties. Size constancy is determined by the characteristics of the optical system of the visual pathway. We know that the height of an object on the base plane can be used to measure the size constancy of visual perception; also, important depth cues can be calculated using the following equation [6,8]:
S
AD
(6) Here, S is the height of the object on the fundamentals, is the visual angle of the picture being taken, D is the distance from the photographer to the object, (i.e., the depth information), and A is the scaling factor of the retina. Clearly, equation (6) deals with the two-dimensional case, in which Sand D form a plane such as the (x–y) plane in Figure 1, which is perpendicular to the base plane (
z
ˆ
-x). For a 3D scene expressed on a 2D plane, equation (6) must be modified according to equation (1). As a result, the degree of depth perception obtained from the 2D plane is smaller than that from the 3D scene, and the actual reduction in the degree of depth perception can be calculated according to the following equation (see the Method section for an example):o
cos(
90 )
S
AD
(7)Psychophysical experiments have shown that size constancy is roughly constant within a certain distance (for example, tens of meters). If a vanishing point in the visual perception of the outside world does not exist, then naturally size constancy also does not exist. As a result, the image structure of a 3D scene cannot be expressed on a 2D plane according to Figure 1. Because the vanishing point is determined by the optical characteristics of the human visual system, size constancy is an embodiment of this feature; affine
transformation is its mathematical description, in which the most valuable cue for visual perception is parallel lines intersecting at infinity, thereby forming a theory of vanishing point.
The example in the Method section shows that to determine the depth of different objects in a picture, size constancy must be combined with a calculation of the vanishing point. In computer vision and computer graphics, these calculations are implemented by corresponding algorithms and proprietary software; however, it is still important to note that in Figure 1, when calculating the included angle between the
ˆz
-axis and the ox-axis, both the vanishing point and the horizontal vanishing line must be displayed in the picture (see Figures 1 and 2), which allows the determination of
[34-36]. The horizontal vanishing line corresponds to the ox-axis; theˆz
-axis corresponds to such a straight line, which has the fastest change in depth, and is determined using the fitting method of linear least squares between the linear perspective and the texture gradient in the figure [36].In the Methods section, we calculate the depth of the image by means of size constancy mainly to illustrate that the depth of visual perception and the calculation results are consistent with each other.
3. Mathematical Models
3.1. Description of the Ambient Light Field Function
According to the method given in Figure 1, since we can draw a 3D scene graph in the 2D plane, the next question is: how do we properly describe the three-dimensional structure of an image? What about it is different from the actual scene?
For the actual scene, imagine that at the fixation point, objects reflect light beams to the surrounding area (including radiation of all kinds of lighting sources). At different angles, the light beams pass through the observer’s pupil, and then form an image on the retina. In fact, the reflected light from the gaze point to the surrounding environment is called “structured light”, which carries various environmental information that can be described using the light intensity
, ,
x y zV V V
, wavelength λ, position (x, y, z) in Cartesian coordinates and time t:( , , , , , , , )
W W x y z
P
P x y z
t V V V
(8)its optical parameters (e.g., the pupil, cornea, and focal length). By means of size constancy and around various reference objects, human vision can very easily perceive the distance of the fixation point, so that the z-dimension will be removed from equation (8), and a function with seven variables is obtained. The resulting form of the function, in the spherical coordinate frame, can be expressed as follows:
( , , , , , , )
V V x y z
P
P
t V V V
(9)The z-axis representing the depth is eliminated from equation (9). However, when clearly focusing, Vzis known, which carries information about the distance between the observer and the gaze point of sharp focus. When the fixation point moves forward or backward along the z-axis, the distance between the gaze point and the focal point on the retina changes with it, and the visual depth perception also changes with it; see the schematic in Figure 7. It can be seen as essentially a layered depth image.
The light entering the eye can also be calculated using the coordinates (x, y), where the image plane (that is, the retina) is perpendicular to the optical axis; then, the imaging function PR on the retina can be expressed as follows:
P
R
P x y
R( , , , , , , )
t V V V
x y z (10)The image on the retina, PR, is just the mathematical description of the ambient structured light. The basic idea stems from Adelson and Bergen’s full-optical (or plenoptic) function concept [37, 38]. It is an idealized concept, used to describe natural scenes that seem too complicated and difficult to deal with. However, in this paper, we use full-optical functions that can better analyze the information structure of the incident light, which carry information about the surrounding environment.
In this case, the input representation for vision is just the full-optical function
P
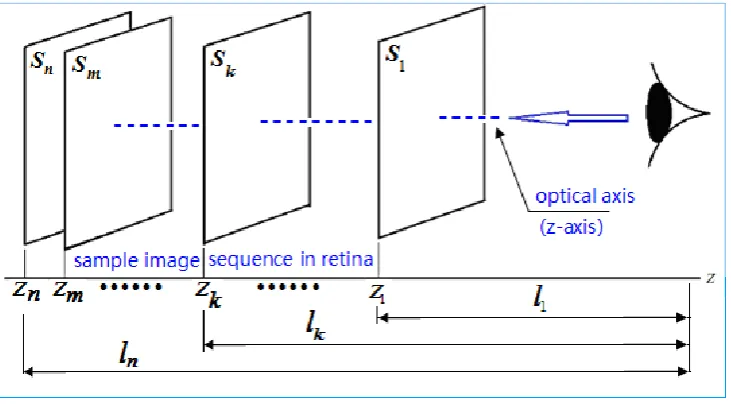
R formed by the visible light-illumine-Figure 5. Visual sample sequence formed in the retina by different fixation points
-tion in the environment, and the output representation for vision is a complete image IR. In other words, the observer forming a visual image on the retina by looking at the actual scene, resulting in visual depth perception, is the “scene mode”. Conversely, seeing the actual scene’s photographic images also allows the formation of a visual image on the retina, likewise causing visual depth perception, but in this case using the “picture mode”. Now we ask: what is the difference between these two? From the perspective of mathematical transformations, are they both equivalent? We will discuss this issue in the following.
Note that when viewing the actual scene, the observer can see only a sample of the function PW. Similarly, when viewing a picture or painting in a plane, the viewer can see only a sample of the light intensity array of the image. In other words, the image PR on the retina and the image IR in the V1 cortex are just a sample of the full-optical function PW of the ambient light field. Along with the movement of the fixation point, for scene mode, the sample sequence
l
1,l
2, …,l
k, …,l
n isformed. For picture mode, only one sample determines when this picture was taken instead of a sample sequence. It can be seen that in scene mode, the sample sequence contains depth information front and rear of the fixation point (see Figure 5); for picture mode, it is fixed. From this, the difference between the two modes is clearly in evidence.
Then, the problem for the visual system is how to get this sample from the full-optical function. This problem is closely related to visual depth perception.
3.2. Seeing Mode and Obtaining the Visual Sample
(rods and cones) in the retina, while orientation information is mainly processed by simple cells, complex cells and orientation functions in the visual cortex V1 [5].
Therefore, position and orientation information can also be separated. Without considering time-varying information for the present, we can use the variable separation approach to simplify the full-optical function with seven variables:
v v
( , , , , , , )
x y zP
P
t V V V
, and also process the visual information.3.2.1. Scene Mode
When the observer’s eye gazes at a point in a scene, the reflected light beam from the point (x, y, z) carries information to the eye about the intensity
V
x,V
y andV
y. The light axis is consistent with the z-axis, and the light intensity (as a stimulus signal for vision) excites photosensitive cells in the retina into firing, so that the intensity of the light stimulus is transformed into the activity strength of a photosensitive cell. Therefore, we only need to record the position and orientationθ,
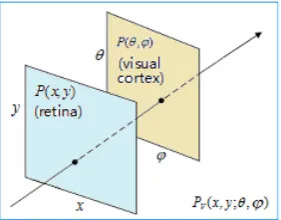
of the light emitted from the point (x, y). For this reason, full-optical functions can be expressed using a dual-plane parameterized method, which can be described using the intersection coordinates( , )
and (x, y) of a light and space plane (retina)P x y
( , )
as well as an angled plane (the visual cortex)P
( , )
, as shown in Figure 6 [42, 43].Figure 6. Nested expression of dual-plane parametric representation
The visual image can be expressed mathematically as the Kronecker inner product of the retina
P x y
( , )
and visualcortex
P
( , )
, namely:I
R
P x y
( , )
P
( , )
, thatis, through the dual-parameterized methods of the plenoptic
functions, we can easily understand the information processing functions of the retina
P x y
( , )
and the visual cortexP
( , )
in the visual pathways. If each primitive of visual image is denoted byR
u v,( )
a
, then the visual imageR
I
can be expressed as the following matrix:1,1 1,2 1,
2,1 2,2 2,
,
,1 ,2 ,
( ) ( ) ( ) ( ) ( ) ( ) [ ( )] ( ) ( ) ( ) V V
u v U V
U U U V
r a r a r a r a r a r a R a
r a r a r a Λ Λ Μ Μ Μ Μ Λ
1, 2, ,
u
Λ
U
, v1, 2, ,ΛV (11)Similarly, the receptive fields of a functional column in primary visual cortex V1 can be expressed as the following matrix:
1,1 1,2 1,
2,1 2,2 2,
,
,1 ,2 ,
( )
( )
( )
( )
( )
( )
[
( )]
( )
( )
( )
b g
b g
b
g
b g
b
g
b
g
B
g
b
g
b
g
b
g
Λ
Λ
Μ
Μ
Μ
Μ
Λ
1, 2, ,
Λ
,
1, 2, ,
Λ
(12)According to the mapping
I
R
P x y
( , )
P
( , )
, the neural computation of cortex V1 to the retinal image is a coincidence operation. That is, each primitive retinal image (i.e., line segments, corners and other features) is detected by receptive fields of various bandwidths and orientations of simple and complex cells in V1 cortical columns in the manner of a compliance operation, which is the Kronecker product operation.1,1 , 1,2 , 1, ,
2,1 , 2,2 , 2, ,
max
,1 , ,2 , , ,
( )[
( )]
( )[
( )]
( )[
( )]
( )[
( )]
( )[
( )]
( )[
( )]
( )[
( )]
( )[
( )]
( )[
( )]
V
V
U U U V
r a B
g
r a B
g
r a B
g
r a B
g
r a B
g
r
a B
g
r
a B
g
r
a B
g
r
a B
g
Λ
Λ
Μ
Μ
Μ
Μ
Λ
1,1 1,2 1,
2,1 2,2 2,
,1 ,2 ,
( )
( )
( )
( )
( )
( )
( )
( )
( )
V
V
U U U V
r a
r a
r a
r a
r a
r
a
r
a
r
a
r
a
Λ
Λ
Μ
Μ
Μ
Μ
Λ
1,1 1,2 1,
2,1 2,2 2,
max
,1 ,2 ,
( )
( )
( )
( )
( )
( )
( )
( )
( )
b g
b g
b
g
b g
b
g
b
g
b
g
b
g
b
g
Published online November 20, 2014 (http://www.sciencepublishinggroup.com/j/sr) doi: 10.11648/j.sr.20140205.20
ISSN: 2329-0935 (Print); ISSN: 2329-0927 (Online)
Obviously, we can obtain the following mappings:
,
( , )
(
,
)
[
( )
]
R u v U V
I
P
x
y
P
R
a
, 1
[
B
( )]
g
I
V
(14)where
I
V1 is the image in V1. The above distributed parallel computing of[
R
u v,( )]
a
U V
[
B
,( )]
g
, from the retinal imageI
R to the cortical imageI
V1, can be achieved within milliseconds of time, which is consistent with recent psychophysical experiments [44].Light with different angles should show up as different perspectives or visual angles in the image, so that such a method of representing light field data can be associated with a neural representation of the human retina in primary visual cortex. A large number of neurobiological experiments have demonstrated that there is a one-to-one mapping between the retina and the visual cortex, and topological connections have been established through ganglion cells. In the retina, photosensitive cells record position and intensity information of incident light; V1, through simple cells, complex cells and function columns, deals with direction or orientation information [45-49].
The visual system can process all-optical functions in a similar manner as dual-plane parameterization, indicating that the optical information to the outside world can be aptly described by an all-optical function. After separation of a visual input signal by the retina and the primary visual cortex, two-parameter processing is achieved, essentially converting an all-optical function
P x y
w( , ,
z V
; ,
xV V
y, ;
z
, )
t
to alight field function
P x y
R( , , , )
zk as shown in thefollowing equation:
P x y z V V V
w( , , ; , , ; , )
x y z
t
P x y
R( , , , )
zk (15)This combination of position, intensity, direction and orientation is just a neural representation of IR in V1; that is, a sample of the actual visual scene obtained by vision. Viewing the actual scene or seeing a stereoscopic image or drawing of the scene expressed in the 2D plane according to Figure 1 can be regarded as a sample of visual perception.
That is, the input signal to vision is
, ,
( , , ;
x y z; , )
P x y z V V V
w
t
, and the input signal to V1is
P x y
R( , , , )
zk for the scene mode.3.2.2. Picture Mode
As already noted, when vision is clearly focused,
V
zk isknown and carries information about the distance between the observer and the sharply focused fixation point. In this sense, looking at the actual scene and looking at a photographic image of the scene will produce the same effect in three-dimensional perception. However, the photographic
pictures are presented in the manner of Figure 1, the input representation is
P x y V V
I( , , , ; )
x y
, compared with scenemode, and there is no information related to the angle
( , )
of incident light.
That is, the input signal to vision is
P x y V V
I( , , , ; )
x y
,and the input signal to V1 is
P x y
V1( , )
for picture mode.Now, the reduction of the effect of depth perception caused by angle
(included angle between thez
-axis and theˆz
-axis in Figure 1) and the change of intensityV
zk shouldalso be considered; here,
V
zk is incident light intensity in 3Dphysical space. For this reason, if the stereoscopic image and the drawing are expressed according to the method in Figure 1, then their intensity information relative to
V
zk has to becorrected. Let
V
zk2D denote the corrected value ofV
zk inthe Cartesian coordinate system introduced into the 2D plane, as shown in Figure 1.
2 o
cos(
90 )
k kz z D
V
V
(16)Human vision is not sensitive to slight changes in visual depth perception; generally, it is difficult to distinguish the difference. Of course, whether the human visual system adopts this strategy to obtain sample information requires further in-depth study.
3.3. Mapping Relationships between Scenes, Pictures and Visual Images
An actual three-dimensional (3D) scene can be described using full-optical functions, as shown:
3D w
( , , ; , , ; , )
x y zI
P x y z V V V
t
(17)As described above, in the psychological coordinate system drawn on a two-dimensional plane, a scene picture, shown in accordance with the method in Figure 1, can be expressed as
I
p3D
P x y z V V V
v( , , ; , , ; , )
ˆ
x y zˆ
t
(18)Here, Ip-3D represents the stereoscopic image of the
This difference between the two modes lies in two aspects. There is the difference in cognition—for example, when viewing the actual scene, the viewer is in the actual scene, there are differences in aspects of visual perception, and the viewer feels immersed in the reality of the scene; whereas while looking at pictures of a scene, the viewer and the scene are separated, with a lack of reality. There is also a difference in terms of depth perception. From equations (1) and (15) we can see that the difference between "scene mode" and " picture mode" is actually the
difference between the
ˆz
and the z, namely:o
ˆ
z=zcos(
90 )
. This equation shows that depth perception in the “picture mode” of stereoscopic perception is clearly lower than in the "scene mode” of three-dimensional perception. However, for the human visual system, it is difficult to distinguish quantitative depth differences between these two modes (absolute depth information), but fairly straightforward to process and estimate the kind of information, such as front and back, right and left, up and down, size, and distance and other location information of objects in scenes and pictures (all this belongs to relative depth information). When pictures are dynamic (such as TV), analysis, judgment and direction of movement of objects are more important.Vision is a causal system, that is, an observer viewing a three-dimensional scene I3D of the outside world will
form a visual image
r p( 3 )D on their retina; and vice versa, when forming a visual image
r D(3 ) on the retina, the scene of the external world will be perceived to be similar to I3D. Likewise, if the image viewed is Ip-3D, theretina will form a visual image
r p( 3 )D , and if the retina contains the visual image
r p( 3 )D , the observer will perceive the scene in the external world as Ip-3D.According to the optical characteristics of the visual system, the object point and the image point can be interchanged. Therefore, both I3D and
r(3D) aremutually conjugate mappings, as are Ip-3D and
r(p 3D) , and vice versa:3D r(3D)
I
3 (p 3D)
p D r
I
From this, we can draw an important mapping:
, ,
( , , ; x y z; , )
P x y z V V Vw
t
P x y z V V Vv( , , ;ˆ x, y, z; , ) t (19)The reason for the above relationship is that the object and its picture have the same dimensions in terms of cognitive psychology; that is, the visual image
r(3D)is formed on the retina by the full-optical functions
I
3D
P x y z V V V
w( , , ; , , ; , )
x y z
t
. Since thephysical dimensions of the retina are 2D, the retinal image
must be formed in the manner shown in Figure 1, which is a reflection of the optical characteristics of the visual system. Thus, we have reason to believe that whether using “scene mode” or “picture mode”; i.e., whether visual images on the retina are represented using
r(3D) or(p 3D)
r
, their display mode is consistent with thefull-optical function Ip-3D, complying without exception
with the pattern in Figure 1. This is also the basic meaning in cognitive psychology of equation (19).
Because the retina is two-dimensional, the visual image on the retina will be expressed in the manner of Figure 1, that is, instead of the coordinate system
x, y,z
(
)
by the coordinate system(
x, y,z
ˆ
)
. Regardless of whether the dimensions of the visual input representation are three-dimensional or two-dimensional, visual images on the retina are two-dimensional. At first glance, the visual images of these two modes on the retina are exactly the same in terms of dimensions, which appears to be a contradictory result. We know whether we are looking at an actual scene or a photograph, even though both of them are, essentially, (linear) projection transformations from 3D visual spaceP
3 to the 2D imaging planeP
2 of the retina. However, in scene mode,the transformation isz 3
kmPM, while in picture mode, it isˆzmP2M; i.e., the points in the 2D plane are
projected onto the retina, which is
m
picture
m
retina. Theloss of depth information of the image
r(p 3D) with respect to
r(3D) iscos(
90 )
o . As for the output representation of V1, its situation is similar to that mentioned above, so we will not repeat it.For the two modes, the above mentioned is another difference obtained from the viewpoint of affine transform.
Notably, in scene mode,
z
k means that the fixation point is moved back and forth in the z-axis in the gaze direction, to form a sample sequence shown in Figure 5, thereby continuously changing depth can be perceived. However, in picture mode, when shooting pictures, the focal length and object distance have been specified, and can no longer be changed with different fixation points. Therefore, in scene mode, depth perception includes more information than the in picture mode in the z-axial direction, i.e., sequencez
k.This study shows the following differences in the basic characteristics between “scene mode” and “picture mode”. The optical axis of the former is consistent with the z-axis of the Cartesian coordinate system, the retinal imaging plane is perpendicular to the optical axis and the z-axis, and the imaging plane of the latter may be perpendicular to the optical axis. However, the z-axis of the psychological coordinate system on the plane is not consistent with the optical axis.
3.4. Depth of Field of Retina Pattern
the optical axis is consistent with the z-axis. The imaging plane is perpendicular to the optical axis and the z-axis, which is an inherent optical characteristic of the visual imaging system. A very small distance fore-and-aft in the focal plane (visual image on the retina), in which the diameter of the light spot (circle of confusion) is small (0.005 mm) [50], still forms a clear visual image; this very small distance is known as
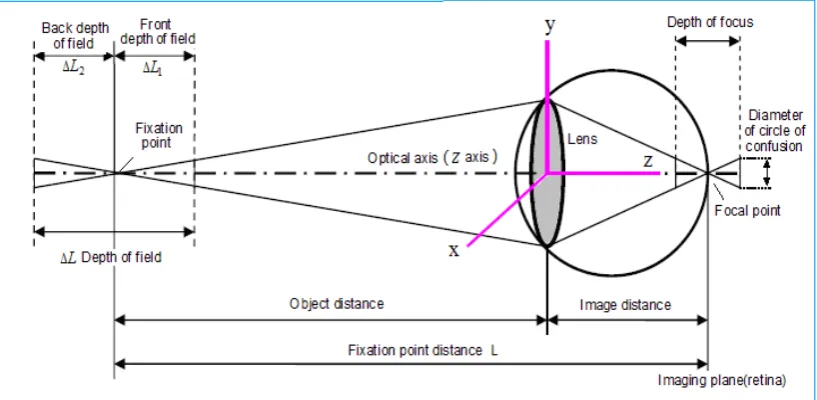
depth of focus (see Figure 7). The conjugate relationship between the image point and the object point for the objects being viewed shows the same situation. In front of and behind the object at a certain distance, when the light spot formed is small, the near point and far point together form the depth of field.
Figure 7. Schematic diagram of depth of field and depth of focus
It is through the optics of the human visual system that depth of field can be perceived in the external world. Depth of field on the retina is determined by
d
(permissible circle of confusion diameter);f
(lens focal length);F
(pupil size);L
(focusing distance);D
L
1 (front depth of field) and 2L
D
(back depth of field). The equation for calculating the depth of field is as follows:2 1 2
F L
L
f
F L
d
d
D
=
+
,2 2 2
F L
L
f
F L
d
d
D
=
-
,
2 2
4 2
1 2
L
2
f F L
2 2f
F
L
L
L
L
d
d
D = D +
D
-D
=
(20)The scene image can be reconstructed based on
D
L
1 (frontdepth of field) and
D
L
2 (back depth of field). The visualimage on the retina does not lose depth information because the three-dimensional scene forms a visual image on the two-dimensional retina. The main reason is that the optical axis is consistent with the z-axis. Thus, the distance zk along the z-axis can be used instead of the focusing distance
L
(see Figures 3 and 5), which makes equation (20) describing the optical characteristics of the human visual system easier to understand. Therefore, equation (20) can be rewritten as:
2 2
4 2 2
1 2
2
k 2k
f F l
L
L
L
f
l
L
F
(21)Here, the
l
k represents the distance along the z-axis fromthe object being observed to the retina when in focus. Simply put, the distance between the observer and the object reflects the scene depth information of the sample image (
l
1,l
2, …,k
l
, …,l
n) at the focal point (see Figure 5). It is thus clear that making the optical axis consistent with the z-axis is a very effective constraint; it is not artificially imposed, but is determined by the optical characteristics of the visual system.Sometimes, the maximum depth of field can also be expressed with the diameter
d
of a photoreceptor (photosensitive cell) in the retina, the pupil diameterD
of the eye, the image distancel
and the object distancel
, i.e.:
2 2
2 2
2
l
2
l
d
L
l
D
l
D
(22)o
ˆ
cos(
90 )
L
L
(23)4. Conclusions and Discussion
In this paper, the problems studied and discussed are very old. According to historical records, in 430 AD, Chinese painter Zong Bing realized that the same object appears smaller when far away and larger when near to an observer. On these grounds, he proposed the perspective method and applied it in his paintings. In the 15th century, during the Renaissance, Leonardo da Vinci also studied the same perspective principle, which is notable in his famous painting “The Last Supper”. This issue is now a hot topic in the field of information processing. To better express stereoscopic animated scenes on a plane, this problem is also now under investigation in the field of computer graphics [51]. In computer vision, this issue is studied to determine corresponding points from dual camera pictures to reconstruct the three-dimensional structure of the scene itself [52]. In his work, Marr mainly explores how the neural mechanisms of cognitive psychology work in the perception of three-dimensional structure from a two-dimensional image [2,3]. Street and wall painters comprehensively use perspective, texture gradients, shading, shadows, and color and occlusion methods, so scene drawing on the plane has a very vivid hierarchy [5]. Comparatively speaking, however, image rendering is at a higher level [23,42,43].
However, we can only know the how and not the why. The intent of this paper is to explore the primary information processing mechanisms that the visual system uses to perceive depth information from stereoscopic scenes on the two-dimensional plane. When excluding factors of atmospheric perspective, texture gradient, image hierarchy, shading, shadow, color and occlusion and binocular disparity, the problem can be naturally attributed to the following problem: Why can we introduce three-dimensional Cartesian coordinates onto the two-dimensional plane to express the three-dimensional structure of the image (see Figure 1)? Why can we draw a line cube (Necker cube, see Figure 4) on the plane? Why can we draw a winding curve into the distance, which can be perceived as a river? What is the basis for this in cognitive psychology?
First, we use the basic situation in Figure 1 as a starting point for research. We point out that the manner of representing 3D objects in Figure 1 is the only way that three-dimensional Cartesian rectangular coordinates can be introduced into a two-dimensional plane to express the three-dimensional structure of the image, and give the calculation formula by which we can evaluate the loss of depth information from a 3D scene. This is followed by in-depth analysis of size constancy in the 3D scene and the 2D image. Differences in vanishing point between the 3D scene and the 2D image also show that vanishing point and size constancy are the basis of the way that the visual system perceives the outside world, as well as introducing the 3D Cartesian coordinate system into the 2D plane. We further study the role
of perceptual constancy and vanishing point in forming a visual image, which reveals a corresponding mapping between the object point and image point in the optics of the visual system. In particular, we propose a neural computational method showing how to separate a full-optical function by the retina and visual cortex, called the dual-parametric approach. This paper also provides a method of obtaining an output sample of visual perception, giving a calculation and measurement of size constancy to show its important role in stereoscopic visual perception and cognitive processing.
Second, in this paper, the problem discussed initially seems simple and clear, but answering it presents unexpected difficulties and complexity. The reader may also to try to answer this question, to see whether there is a clear result. We place so much emphasis on this issue, pointing out its features and complexity, because the study of this problem for stereoscopic visual perception is important and the results have much practical application value for computational vision.
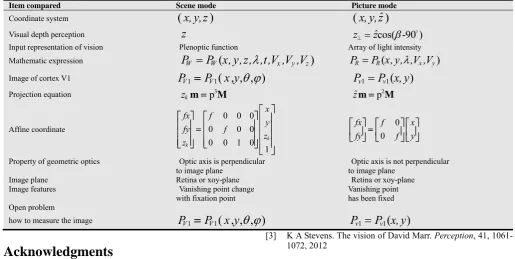
To summarize, the main differences in visual depth perception between scene mode and picture mode consist of the following three points:
1. For the former, the depth axis (z-axis) of a Cartesian coordinate system is consistent with the optical axis of vision, and the imaging plane (or retina) is perpendicular to the optical axis and thus perpendicular to the z-axis. For the latter, because of the different viewing angle, the imaging plane is either perpendicular to the optical axis, or cannot be perpendicular to the optical axis. However, the z-axis (denoted by the symbol
ˆz
in the text) of the three-dimensional Cartesian coordinate system expressed on the plane is not consistent with the optical axis of the image, thus causing a loss of depth information. This paper presents a method to estimate the amount of such loss.2. In scene mode, the visual input signal is a seven-dimensional plenoptic function, and in picture mode, the visual input representation is the light intensity array, i.e., a four-dimensional function of the light field [23], which is obtained by simplifying and separating the seven-dimensional all-optical function. This distinction is very important for the study of visual depth perception for these two modes. 3. In scene mode, the distance of the fixation point is variable; that is, the vanishing point is able to change with a changing fixation point. Also, in picture mode, the vanishing point is fixed, because when shooting the picture, its vanishing point is determined by the optical system of the camera.
In addition, we provide a method to obtain a sample sequence of the output representation of visual perception, and the relationship between the sample and the depth information [26], which relate the size constancy and vanishing point with each other. We point out that both of these have an important role in imaging of the optical system in vision, thus preliminarily explaining why visual images on the human retina contain two-dimensional depth information.