1. Introduction
Iran's economy is a single-product economy based on oil revenues and a major part of the country's revenue is from oil revenues. Considering that the change in oil prices causes oil revenues to change, identifying the impact of these fluctuations on economic growth is essential since economic growth is one of the main pillars of development in each country [1].
Corresponding author
E-mail address: [email protected] DOI: 10.22105/jarie.2019.195436.1098
A Multi-Input, Multi-Output Model on Fuzzy Rule-Based
Systems to Predict Macroeconomic Variables in Iran
Mohammad Hemati
Department of Management, Semnan Branch, Islamic Azad University, Semnan, Iran.
A B S T R A C T P A P E R I N F O
The prediction of economic variables is one of the main issues in a country's macro decisions. Since in many cases there is no historical data for this purpose and it is necessary to have more than one output, it is necessary to use expert opinions and consequently, model expert opinions in the form of mathematical functions, adds to the complexity of the task and the importance of the problem. To solve such problems, this paper presents a ten-step process using fuzzy rule-based systems. At the first step, the three inputs that include: the price of OPEC oil, the level of Iran and Saudi relations and the level of political tension in OPEC member countries and also the three output variables that include: the amount of employment, the economic growth, and the oil price forecast, have been modeled in the form of trapezoidal and triangular functions. Then, these variables have been converted to linear functions. In the next steps, the three-dimensional decision tables were designed and then by using the fuzzy rule-based systems (if, ... Then...), the preconditions and sequences (results) of the decision rules were written and coded in the Matlab software. The results indicate that the outputs are in line with the existing economic realities of Iran and that three input variables to a certain extent can cause changes in the three output variables. Less technical so far with problems with this complexity of problems are capable of results with this obvious. Chronicle:
Received: 23 November 2019 Revised: 27 September 2019
Accepted:22 September 2019
Keywords:
Fuzzy Rule-Based Systems. Fuzzy Logic.
Crude Oil. Predicting.
Macroeconomic Variables in Iran.
Journal of Applied Research on Industrial
Engineering
Reducing oil prices sharply reduce government revenues and will affect developmental projects. Naturally, part of government revenues is spent on investing in the petroleum industry. When the state budget is reduced, investment in the oil industry and, consequently, investment in other industries is decreasing, which causes a lot of problems for the country's economy [2].
Studies show that Iran, along with Venezuela and Nigeria, had the highest error rate in predicting oil prices in annual budgets between 1999 and 2011. Today, the use of new methods such as fuzzy logic to predict the quality of financial decisions has improved dramatically [3].
Many techniques have been presented to predict macroeconomic variables and in numerous articles. Techniques such as statistical techniques: multivariate regression, EGARCH, ARIMA [4, 5], economic techniques: time series ([6], artificial intelligence: neural networks [4, 6], convolutional neural network techniques [7], or a combination of techniques the above: ARFIMA [3, 4].
But in all of the techniques mentioned, historical data is almost an essential component of the technique. Therefore, our goal in this article is to present a different approach that can be based on historical data or expert judgment or a combination of them. There is also only one output variable in almost all of the techniques mentioned, although in many cases we need multiple output variables at the same time with their interactions.
The purpose of this paper is to provide a structured method based on fuzzy rule-based systems (if, .... Then,) in order to predict the behavior of macro variables in Iranian economy with multi-output (oil price, growth economic and level of employment) by using of multi- inputs (current oil prices, Iran-Saudi relations and tension levels in OPEC exporting countries).
2. Theoretical Foundations and Research Literature
2.1. Oil Effects on Economic Growth
The results of the co-integration test on the long-term relationship between oil price variables, exchange rate, housing price index and gold price in the period of 1995-2012, using a structural vector error correction approach, suggest a long-term relationship between variables is significant at the level of 99%. The general results of the variance analysis of forecast error show that the largest share in the variance of the exchange rate is related to the oil price shock, which affects the currency exchange rate variance in the long run [8].
In the study of the asymmetric hypothesis, the relationship between oil price changes and demand for consumption in selected OPEC countries by using of panel data method from 2003 to 2013, suggests that the effects of change in the price of crude oil in selected oil countries (Iran, Saudi Arabia, Iraq, and Kuwait) are asymmetric [9].
correlation function analysis showed that the reaction of oil-free production growth to oil price shocks and oil price stability in the OPEC countries was more severe, while the economies of non-member countries do not show it [10].
The impact of the oil price shock on voluntary financial policies in OPEC countries during the years 1980-2015 was studied using the Autoregressive (PSVAR) technique. Based on the findings, the impact of oil price shock on fiscal policy is voluntary in the short term, but it is ineffective in the long run. In addition, the shock of oil prices has increased government inflation and government spending and reduced OPEC's growth [11].
Many kinds of research have argued that oil price changes are inherently unpredictable, and efforts to predict crude oil prices are in vain. These deniers view current oil prices as the best predictor of future oil prices [12].
In other studies, in the member countries of the European Economic and Financial Society that are importing crude oil, the impact of oil price volatility on GDP growth in the years 2000-2015 has shown a negative impact on these countries [16].
In a study aimed at investigating the effect of oil price volatility on economic growth using the Vector Auto-Regressive test technique for the years 2000-2015, the results showed that in the long run, between the price of crude oil and the growth of the relationship and data suggest that rising oil prices have had a significant positive impact on Libya's economic growth [17].
Other researchers studied the extent of the interdependence of oil prices and economic growth in the UAE, Kuwait, Saudi Arabia and Venezuela in OPEC during the period 2000-2010. They used the Co-Integration test for this purpose. The results showed that the shock of the short and medium oil prices during the fluctuation period in the financial crisis and the global business cycle affects economic growth in the organization of oil-exporting countries, while the effect of medium-time is greater than the short-time effects [18].
In recent years, there have been some patterns of new econometric prediction in the literature that is more accurate, at least to a less than real-predicted level [13, 14, 15].
2.2. Review the Methods of Forecasting
Major well-known techniques for better prediction and studying can be categorized into statistical methods, econometric and statistical methods, and artificial neural networks.
2.2.1. Statistical methods
To forecast 2018 domestic air passenger demand in Nigeria between 2010 and 2017, two mean square deviation (MSD) forecasting methods were examined and compared to determine which method has the least deviation. It was found that MSD with two yearly moving average gave a better forecast rather than simple exponential smoothing because it has a lower MSD [20].
However, the shortcomings in the GARCH class models are as follows:
First, most GARCH models can only capture short-horizontally attributes rather than long-term dependencies, even though long-term dependencies in volatility are commonly recorded in the writings. In particular, Lee and et al [21] show that some sudden events (for example, the Iraqi invasion of Kuwait and the Persian Gulf war) lead to an increase in the constant component conditional variance that results in structural failures.
Second, GARCH class models cannot be adapted to a multi-scale feature, which is a well-known design reality in economics [22].
2.2.2. Econometric and statistical methods
The US Energy Information Administration (EIA) has represented a technique for forecasting oil prices, which creates quarterly forecasts for crude oil prices for the next two years.
Techniques such as empirical mode decomposition (EMD), sparse Bayesian learning (SBL) are used to predict crude oil prices as well as decomposition and ensemble used in time series.
Experimental results show that EMD and SBL are better than many predictions in terms of several evaluation criteria such as absolute mean absolute percentage error (MAPE) and root mean square error (RMSE) [23].
In another study with the aim of predicting the number of hospitalized patients in Mashhad hospitals over a period of 12 years ending to 2016 year in Iran, using time series and techniques group such as: Holt-Winters, SARIMA, MLP and GRNN shows that time series techniques are a good tool for predicting the number of patients with one output variable [24].
2.2.3. Artificial intelligence methods
Neural Networks is one of the most attractive methods of artificial intelligence in dealing with nonlinear predictions due to the ability to learn and adapt to dynamic environments. Many studies have shown the success of the implementation of neural networks in the field of oil exploration and development, such as the pattern of test analysis and prediction of natural gas production in the United States [25]. In order to predict the price of Brent crude oil during the period of 1998-2011, it has been used the three methods of fuzzy, EGARCH and ARFIMA as a comparison. The results have shown a significant fuzzy logic superiority compared to the methods of EGARCH and ARFIMA [3].
It has also been reported that neural network models are better than any other conventional statistical model, such as ARIMA, moving average, widespread self-regression and moving average [27]. Artificial Intelligence (AI) deep learning approaches make more accurate predictions of short-term oil prices than the Naive Prediction (NF) model. It also provides strong evidence that CNN models with matrix inputs are better in the short run than neural network (NN) models with single vector inputs [7].
2.2.4. Machine learning algorithms
In a case study, machine learning algorithms to predict oil prices using linear regression techniques known as super-vector regression, polynomial models, linear models, and Arbf models have been investigated. They have shown that they have considerable capability for predicting the variables with one output [28].
2.3. Summarizing Theoretical Foundations and Research Literature
The results of research that argued by Dourra [29], has represented that fuzzy logic is a more valid method with the following reasons:
A neural network system lacks conceivable reliability in its judgments. There is no way to determine if the training kit is sufficient or no.
In most cases, the response to the technical indicators, yes or no, is not definitive, therefore the fuzzy argument is very effective in these environments.
The rules are structurally similar to those of English that is more in line with human thinking.
Fuzzy logic is more flexible than the specialized system because it uses fewer rules and their composition needs more likely coverage of results.
Fuzzy inference can address or overcome the overlap or ambiguity between the rules.
The fuzzy system is considered as a comprehensive system because it is more coherent compared with artificial intelligence techniques, such as neural network-based trading systems, and has more freedom to repair it.
The fuzzy inference system can be used to score points in an organization, giving a good understanding of the importance of each indicator in relation to others for evaluating the past, present, and future of the organization [30].
As with all techniques used for forecasting, whether statistical techniques or artificial neural network-based techniques, historical data is essential, but for the technique proposed in this article, even if historical data is not available, comments experts can be modeled using fuzzy rule-based systems. In addition, in almost all of the techniques mentioned in the research literature, the output of the predictive model is not one higher variable, but in the proposed technique in this paper, there is no limit (although for more than three output variables, the computational complexity increases).
3. Methodology of Research
According to Fig. 1, taken from Washington. D.C newspaper [31] from 1970 to 2017, the main factors influencing the price of oil have been as follows:
1970 to 1975 US Oil Surplus Capacity.
In 1973, the sanctions of oil from Arab countries to western countries.
In 1979, the occurrence of the revolution in Iran.
In 1981 the Iran-Iraq war.
In 1985, Saudi Arabia acted as a decisive step in oil prices.
In 1990 Iraq invaded Kuwait.
In the year 2000, the Asian financial crisis has been formed.
In 2001, OPEC reduced its production by 7.1 million barrels.
The 2003 Second Gulf War (US invasion of Iraq and the overthrow of Saddam Hussein's government).
In 2008, global financial markets collapse.
In 2009, OPEC cut its production by 4.2 million barrels.
During 2013-2015, OPEC retained its production margin and did not cut it.
Regarding the 12 factors mentioned in this chart (Fig. 1) that affect oil prices, 9 factors have directly related to political issues or decisions made by OPEC exporting countries. Therefore, due to the effective role of political decisions and tensions in OPEC countries, two variables (Iran-Saudi relations and tension levels in OPEC exporting countries) as two of three variables that effect on oil prices in this article has been considered (the variable of current oil price is also considered as the main variable). According to the description given, the output variables of research are oil price, economic growth, and employment rate. Although the role of oil in economic growth is different and sometimes contradictory. For example, in some studies, the existence of oil and the rise in prices have led to economic growth [10]. Some other studies have concluded that oil revenues and rising oil prices have had a negative impact on economic growth and development [6, 32, 33].
But given Iran's reliance on oil revenues, it is natural that part of economic growth and employment and employment levels depend on oil revenues.
In order to extract the rules of decision making and plotting and extracting functions for the oil price, it has used the past behavior of the oil variable over the past 45 years (from 1970 to 2015).
For example, when the current oil price is low (under $ 55), and the relationship between Iran and Saudi Arabia is weak (for example, they still lack official diplomatic relations, but they have not yet entered a military conflict, because then there is a very different issue. Because with the closure of the Strait of Hormuz and the regional conflict, Iranian and Saudi oil exports are sharply reduced, and oil prices are rising sharply) and if the regional tensions in the OPEC exporting countries will be low, the reasonable result is that the price oil will not increase in the near future (Providing that other conditions, such as the export volumes of Russian and American oil, are not changing, as well as the using of alternative energy does not change) and Iran's economic growth, which is highly dependent on oil prices, will be around the same current economic growth and the amount of employment that depends to a certain extent on oil prices will also be around the current level.
In another mode, if the current oil price is low, but the relationship between Iran and Saudi Arabia increasing to a high diplomatic level, and the tensions in the OPEC oil exporting countries being low, in this case, the price of oil can increase, which will also increase the country's economic growth and employment will slightly improve.
4. Presenting the Proposed Model and Proposed Procedures for Research
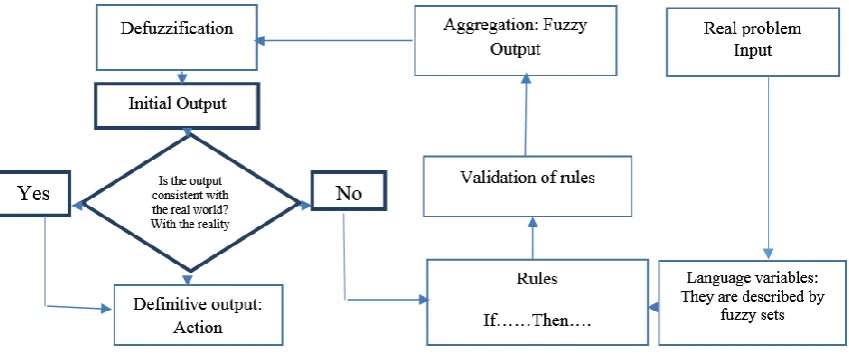
A block diagram for solving a real problem by using fuzzy logic control has a general framework as described in the figure below (Fig. 2).
Fig. 2. The block diagram presented in fuzzy logic control.
A fuzzy logic control model has a block diagram as described above (Fig. 2). As shown in the figure, working with a problem in the real world starts as input. In the next step, transforming the real problem into fuzzy sets. The next step is to design the inference rules (if .,.,. then ,.,.,.). Other steps are:
Control issues have inputs and outputs that are considered as linguistic variables. Linguistic variables are including sets of A, B, C, etc.
1 i i 1 n
1 j j 1 m
1 k k 1 l
{ ,..., A , A ,..., A } B {B ,..., B , B ,..., B }
C {C ,..., C , C ,..., C }
A A
(1) linguistic variables
Step 2. Specify the type of input and output membership functions (triangular, trapezoidal, etc.). In this paper, triangular and trapezoidal membership functions have been used because they are better able to express the goals of the paper. These functions are:
0 ( ) ( ) ( : , , ) ( ) ( ) 0 x a x a
a x b
b a trm x a b c
c x
b x c
c b x c (2) triangular membership function
The letters, a, b, and c are the parameters
0
( )
( )
( : , , , ) 1
( )
( )
0
x a
x a
a x b b a
trm x a b c d b x c
d x
c x d d c x d (3) trapezoidal membership function
The letters, a, b and c, are parameters
Step 3. Linguistic terminology (low, medium, high) and the range of these linguistic semantics have been defined as follows:
1
j Bj 2
3
{( , ( ) }, 1,..., .
B {y, (y) }, 1,..., ,
{ , ( ) }, 1,..., l
i Ai i
j
k ck k
A x x x A U i n
y B U j m
C z z z z C U k
(4) linguistic terminology
Step 4. Specify the type of operators (Max, Min, and Product). Many fuzzy relations have been proposed and applied by researchers, and much research has been done on the behavior of fuzzy relations in different contexts. [34, 35, 36].
The relationship of Mamdani’s requirement: R :c R u v( , )min(
A u B v( ), ( )
. The relationship of Larsen's requirement: Rp:R u v( , )A u B v( ), ( ).The relationship in Lukashevich's requirement: Rl:R u v( , )min[1,1A u( )B v( )]. The relationship of probability requirement: Rk :R u v( , ) 1 A u( )A u B v( ), ( ).
In a relation x equal to
A
i , andy
equal toj
, i.e.
p
i , and qj this relation is defined as a turning. The point, which is a fuzzy relationship with A U U1, 2the following membership function:1 2
min( ( ), ( )), ( , ) ,
i j A i j
p q x x x y A B U U .
The rule, if.... then,.,.,., in the inference relation is a conditional combination that indicates the correctness of the precondition. There are a few definitions for this rule. Here, according to Mamdani, we define the inference principle as a turning point, which is represented by the operator (minima) and is called the result of the resultant (the result) which can also be displayed as follows:
min ( ( ), ( ), (x)),
i j k A i j cij k ij
p q r x x r r .
1 2 3
1,..., ; 1,... ; 1,..., ; ( , , )
i n J m k l and x y z A C U U U .
(5)
type of operators
The above equation provides a regular value that is the result of the minimal operation of the membership functions of fuzzy sets.
Step 5. Designing the multidimensional tables of the intensity of the rules of knowledge. Setting rules if... and... when referring to the logic of inference, the rules of control or the rules of extraction are also called. The number of rules is equal to nm.
The rules are designed to create
L
or obtain(Lnm) a different output number as a result or result (L
the number of terms in the outputC
variable). The rules with fuzzy outputs (Cij) are represented symbolically on a rectangular tablenm (n number of rows and m number of columns), which is called the decision table.Step 6. Writing the rules of inference and the decision of the knowledge base and programmed in a suitable software (such as Matlab).
Step 7. Doing aggregation Operations (Elimination of Contradiction). The application of the control rule, which is also called firing, is used to decide which of the rules must be used. In each rule, the degree of firing or firing can be achieved through the following relationships.
0 0 0 0
( ) ( ) min(( ( ), ( ))
i j Ai x j y Ai x j y
,
1 0 1 0 0 1 0
, ( ) ( ) min(( ( ), ( ))
i j Ai x j y Ai x j y
,
1 1( 0) ( 0) min(( 1( 0), ( 0))
ij Ai x j y Ai x j y
,
1, 1 1( 0) 1( 0) min(( 1( 0), 1( 0))
i j Ai x j y Ai x j y
.
(6)
aggregation operations
Step 8. Defuzzification operation. In order to be able to assign a classical (ordinary) number that is displayed with *
k
k
n
C k 1
* z
n
C k 1 z
Z μ z dz Z μ z dz
Z
.(7)
the center
level method
The sign of "∫" is the integral sign and the applied state when the z z1, q problem interval is divided to q by the number of equal intervals (or approximately equal) in pointsz z1, 2,..., zq 1 , the definite amount *
Z according to this method is Zkthe averaging of the numbers.
Step 9. Designing the program and write the program code in one of the software. Due to the nature of the programs, which are large variables and also require a lot of repetitions, it is necessary to run programs in one of the most powerful programming software. Matlab software, especially in its new releases, has very good capabilities for fuzzy logic and artificial intelligence. In this article, Matlab software is also used for this purpose.
Step 10. Run the program and analyze the sensitivity of the desired domains. At this stage, the program is executed. The program outputs are tested with a variety of inputs and compared to the actual facts, and, if necessary, the required modifications in the knowledge base structure (the type of functions, language terms, operators, inference rules) to express the reality that the knowledge base has been designed for. The modified model is used to decide and predict the values of the output variables.
5. Findings of the Research and Implementation of the Proposed Technique in Practice
According to the steps described in the previous section, the practical steps of implementing the technique and its results are now presented below. It should be noted that software sections have been designed and implemented in the Matlab software.
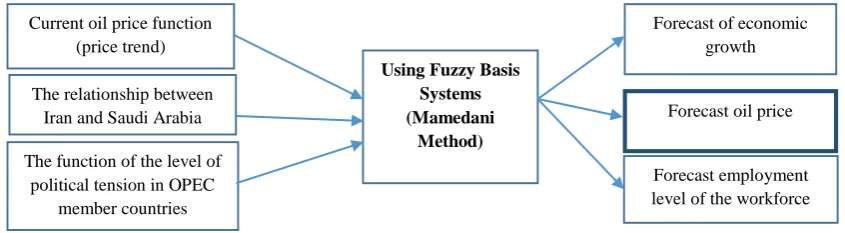
Step 1. Determine the number of input and output variables of the research. In this paper, the three variables, prices, and current trends of OPEC oil, IRAN, and Saudi political relations, and the level of political tension in OPEC exporting countries have been used as input variables. Also, variables, prediction of future OPEC oil price, the economic growth rate in Iran, and employment level in Iran have been used as output variables.
Fig. 3. Conceptual model of research with a structure of three input variables and three output variables (source: researcher).
Current oil price function (price trend)
Forecast of economic growth Using Fuzzy Basis
Systems (Mamedani
Method) The relationship between
Iran and Saudi Arabia
The function of the level of political tension in OPEC
member countries
Forecast oil price
Steps 2 and 3. Designing the linguistic variables of the research and their membership functions in the relevant tables.
In the presented paper, given the limitations of the pages of the article, only one table and a graph (Table 1 and Fig. 4) are presented in the text of the article. And the rest of the tables (5 tables and 5 other charts) only give their results in the final output of the paper. According to the table below (Table 1), the linguistic variables in the current oil price research are mainly presented in three groups: low, medium and high.
Fig. 4. Linguistic variables for the oil price in dimensions of low, medium and high.
Table 1. Designing oil price variables in regard to oil price trends over the past 45 years.
In addition to drawing the tables and charts for the input and output variables of the research, all of their respective functions in formulas 8 to 25 are given below.
1 0 40
1 7
40 70
30 3
0
y x
y x x
others
(8)
linear trapezoidal functions for
low oil prices
1 4
40 70
30 3
1 10
70 100
30 3
0
y x x
y x x
others
(9)
linear triangular function for
0 0.2 0.4 0.6 0.8 1 1.2
0 20 40 60 80 100 120 140 160
Fu
zz
y
Me
m
b
er
sh
ip
Valu
es
Oil Price
Medium High
Description of the language variable Oil price Linguistic range
Type of function
(Low Oil Prices(Low [0 0 40 70]
Trapezoidal
(Average Oil Prices(Medium [ 40 70 100]
Triangular
(High of Oil prices (High [ 70 100 140 140]
the average price of oil
0 70 1 7 70 100 30 3 1 y x
y x x
y others (10) linear trapezoidal function for high oil prices
1 0 25
1
2 25 50
25 0
y x
y x x
others (11) linear trapezoidal function for the low relationship between Iran and Saudi Arabia 1 3 30 50 20 2 1 7 50 70 20 2 0
y x x
y x x
others (12) linear triangular function for the normal relationship between Iran and Saudi Arabia 0 50 1
2 50 75
25
1 75
y x
y x x
y x (13) linear trapezoidal function for the sincere relationship between Iran and Saudi Arabia 1 25 1
2 25 50
25 0
y x
y x x
others (14) linear trapezoidal function for very low tension 1
1 25 50
25 1
3 50 75
25 0
y x x
y x x
others (15) linear triangular function for tension case in the usual
0 50
1
2 50 75
25
1 75
y x
y x x
y x (16) linear trapezoidal function for very high tension
1 0 25
1 3
25 70
50 2
0
y x
y x x
others (17) linear trapezoidal function predicted for low oil
prices 1 4 40 70 30 3 1 10 70 100 30 3 0
y x x
y x x
others (18) linear triangular function for average oil price prediction 0 70 1 7 70 100 30 3 1 y x
y x x
y others (19) linear trapezoidal functions representing the prediction of high oil prices
0
5
1
5
4
1
3
4
8
4
y
x
y
x
x
x
(20) linear trapezoidal function to predict low economic growth 0 4 1 3 4 8 5 5 1 13 8 13 5 5 y xy x x
y x x
(21) linear triangular function to express the prediction of moderate economic growth 0 8 1 8 8 13 5 5 1 13 y x
y x x
express the prediction of
high economic
growth
0 0
1 0 1000
1
2 1000 2000
1000
y x
y x
x x
(23)
linear trapezoidal function to predicting low-level of employment
0 1000
1
1 1000 2000
1000 1
3 2000 3000
1000
y x
y x x
y x x
(24)
Linear triangular function to predicting
medium-level of employment
0 2000
1
2 2000 3000
1000
1 3000
y x
y x x
y x
(25)
Linear trapezoidal function to predicting high-level of
employment
Step 4. In this study, it has been used as the "Max" operator for the union, the "Min" operator to intersection, the "Prod" operator for product, the "Sum" operator to aggregate, and "Centroid" to defuzzification.
Table 2. Decision rules for predicting the intensity of three variables (oil prices, economic growth, and employment rates) for the linguistic variable of low level.
Relations between Iran and Saudi Arabia Regional tensions in OPEC member countries The status of the current trend of oil price Language terms Low Medium High Language terms Low L (Oil Price) L (Economic Rate) L
(occupation) L (Oil Price)
L (Economic Rate) L
(occupation) M (Oil Price)
M (Economic Rate) L (occupation) Low Low L (Oil Price) L (Economic Rate) L
(occupation) M (Oil Price)
L (Economic Rate) L
(occupation) H (Oil Price)
M (Economic Rate) L (occupation) Medium Low M (Oil Price) L (Economic Rate) L
(occupation) H (Oil Price)
L (Economic Rate) L
(occupation) H (Oil Price)
M (Economic Rate)
L
(occupation) High
Source: computing researcher
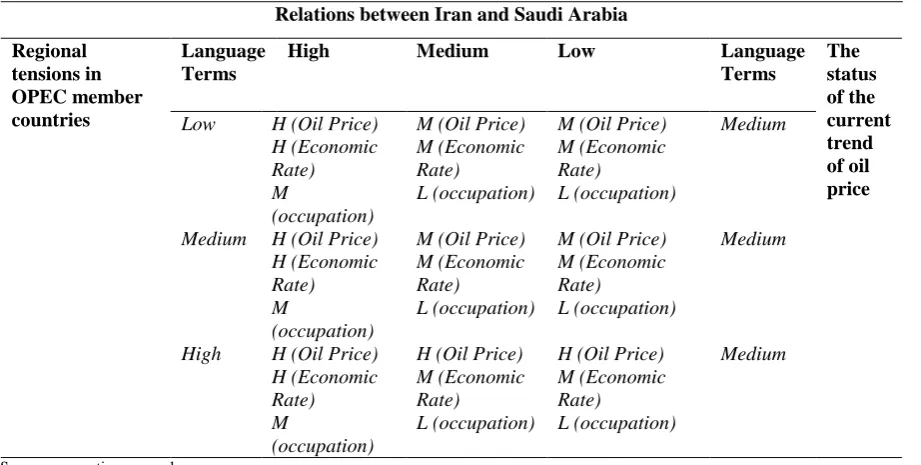
According to Table 3, for example, if the current trend of the oil price situation be on the average, the relations between Iran and Saudi Arabia be in moderation and regional tension also be on average, in this case, the predictions that the price of oil would be moderate, Iran's economic growth would be average and level of employment would be Low (the middle house of Table 3).
Table 3. The decision rules for predicting the intensity of knowledge for three variables (oil prices, economic growth, and employment rates) in the medium linguistic variable.
Source: computing researcher
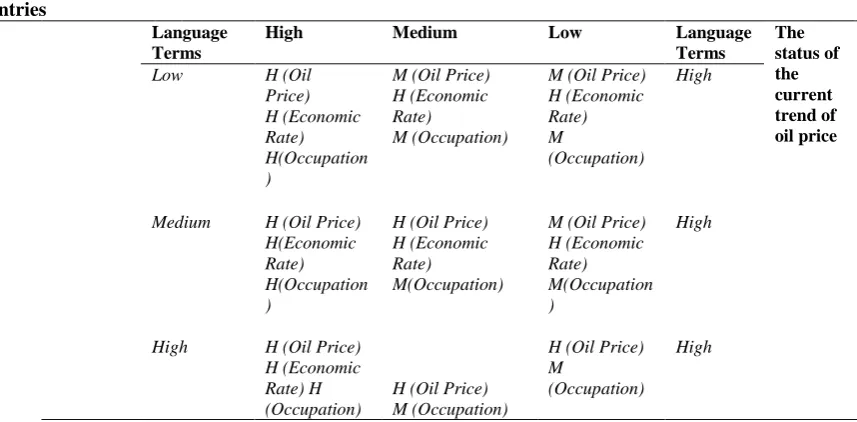
According to Table 4, for example, if the current trend of oil price is high, relations between Iran and Saudi Arabia be moderate and regional tension be on average, in this case, it predicts that the price of
Relations between Iran and Saudi Arabia
The status of the current trend of oil price Language Terms Low Medium High Language Terms Regional tensions in OPEC member
countries M (Oil Price) Medium
M (Economic Rate)
L (occupation) M (Oil Price)
M (Economic Rate)
L (occupation) H (Oil Price)
H (Economic Rate) M (occupation) Low Medium M (Oil Price)
M (Economic Rate)
L (occupation) M (Oil Price)
M (Economic Rate)
L (occupation) H (Oil Price)
H (Economic Rate) M (occupation) Medium Medium H (Oil Price)
M (Economic Rate)
L (occupation) H (Oil Price)
M (Economic Rate)
L (occupation) H (Oil Price)
H (Economic Rate) M
oil would be high, economic growth and employment levels in Iran would be average (middle house of Table 4).
Table 4. The decision rules for predicting the intensity of three variables (oil prices, economic growth, and employment rates) in the high linguistic variable.
Source: computing from researcher
The 6 and 7 Steps. Inference rules and decision bases of knowledge in the Matlab software are programmed. These rules include 27 rules, which, however, given the nature of the problem and the explanations mentioned in the discussion of the aggregation of the rules, can be reduced to 9 rules (these 9 rules have been shown in Fig. 5).
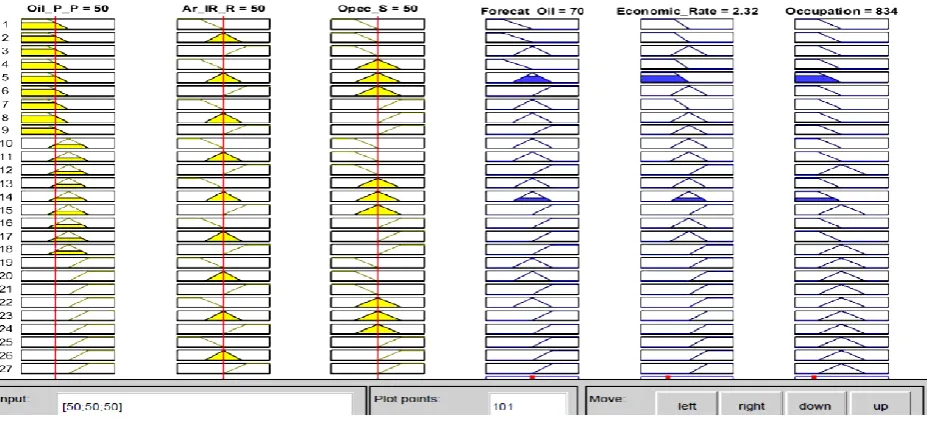
Step 8. In this paper, the central technique has been used for defuzzification. This technique is known in the Matlab software called "Centroid". For example, for three inputs of the model, that includes, oil price, Iran and Saudi Arabia's relations and tension levels in OPEC countries with amounts of "50, 50, 50", the output prediction values for these three variables are: "70, 2.32 and 834" for oil price, economic growth and employment level.
Step 9. Coding and executing the program. In this paper, coding and executing the program has been done in the Matlab software. You can also use the fuzzy toolbox to do this. Also, it can be done using programming power (using the M file). Some of the features the program which has been designed to solve the research problem by using the fuzzy rule system includes:
The main fuzzy relation is Mamdani. A number of input variables: three variables. The number of output variables: three variables. The number of fuzzy rules: 27 rules. The " Min" has been used for "and". "OR" has been used for Max. "Max" has been used for aggregate. The method used to "defuzzification" is "Centroid". The function that has been used for the low domain (MF1) is "Trapmf". The function for Medium level(MF2) is a triangular function with the name of "Trimf". The function for a high level (MF3) is a trapezoidal function with the name of "Trapmf". The Software that has been used is Matlab.
Relations between Iran and Saudi Arabia Regional tensions in
OPEC member countries
The status of the current trend of oil price Language
Terms Low
Medium High
Language Terms
High M (Oil Price)
H (Economic Rate) M
(Occupation) M (Oil Price)
H (Economic Rate)
M (Occupation) H (Oil
Price) H (Economic Rate) H(Occupation )
Low
High M (Oil Price) H (Economic Rate) M(Occupation )
H (Oil Price) H (Economic Rate) M(Occupation) H (Oil Price)
H(Economic Rate) H(Occupation )
Medium
High H (Oil Price)
M
(Occupation) H (Oil Price)
M (Occupation) H (Oil Price)
Also, in the figure below (Fig. 5), the results of the program's implementation in 50 (current oil price), 50 percent (Iran and Saudi-Arabian- relations) and 50 percent (the level of political tension in the OPEC countries) are visible.
Fig. 5. Inputs and outputs from the fuzzy rule-based system in Matlab software.
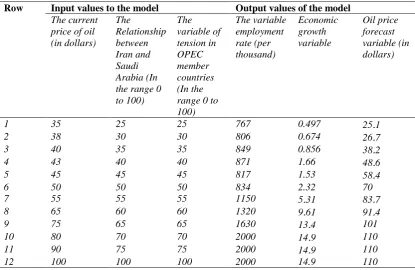
Table 5. Sensitivity analysis of the designed model in different input values.
Output values of the model Input values to the model
Row Oil price forecast variable (in dollars) Economic growth variable The variable employment rate (per thousand) The variable of tension in OPEC member countries (In the range 0 to 100) The Relationship between Iran and Saudi Arabia (In the range 0 to 100) The current
price of oil (in dollars)
25.1 0.497 767 25 25 35 1
26.7 0.674 806 30 30 38 2
38.2 0.856 849 35 35 40 3
48.6 1.66 871 40 40 43 4
58.4 1.53 817 45 45 45 5 70 2.32 834 50 50 50 6
83.7 5.31
1150 55
55 55
7
91.4 9.61
1320 60 60 65 8 101 13.4
1630 65 65 75 9 110 14.9
2000 70 70 80 10 110 14.9
2000 75 75 90 11 110 14.9 2000 100 100 100 12
6. Conclusion and Discussion
According to the results of the sensitivity analysis presented in Table 5, it can be seen that with the three input influential variables (current OPEC oil price, the relationship between Iran and Saudi Arabia and the level of political tension in OPEC member countries) the maximum expected oil price will reach to $ 110, the maximum economic growth of $ 14.9 and the maximum employment of two million people in Iran's current economy (it is rarely or perhaps impossible to relate the relationship between Iran and Saudi Arabia is 100% or the tension in oil-exporting countries is 100%). Therefore, if we are looking for better conditions, for example, to create employment, we need to introduce more variables (such as increased private sector investment, increased foreign investment, tourism development, etc.). Also, in current conditions, the current price of oil is about $ 50, while Iran-Saudi relations are lower at moderate levels and the tension level in OPEC countries is also close to moderate (50, 50 and 50, respectively), output quantities are respectively oil price forecasts, economic growth and employment are equal to $ 70, $ 2.32, and $ 834,000, which, in particular, does not meet the expectations of government-designated programs. According to the theoretical foundations of the research [10, 6, 32, 33], the oil variable can somehow cause Improving economic growth or increasing employment levels, and in the current state, not expecting more than 2.5 percent of economic growth or employment of 800,000. Therefore, economic planners should either think about improving other variables such as increasing private sector investment, increasing foreign investment, improving tourism conditions, etc.
can be designed in the form of both linear and nonlinear equations in the model (for example, oil prices in this paper), and where there is no historical data, using the ten-step technique presented in this paper, experts' opinions can be modeled to predict future issues. It is also faster and easier to model variables because of fuzzy logic in modeling and because of the proximity of this logic to human interactive language. In addition, the model presented with multi-variable inputs and multivariate outputs is a great advantage that other models have less of this feature. The technique presented in this article will be of great use to design scenarios and be easily developed for more economical and marketing issues that are more complex.
References
[1] Sajadi, H., Farazmand, H., & Alisufi, H. (2010). Investigating the relationship between macroeconomic variables and stock index returns in cash: Tehran Stock Exchange. Journal of macroeconomics (journal of economics sciences) 10(2), 123-150.
[2] Mehrara, M., Certain, A., Ahrari, M., & Hamouni, A. (2013). Modeling and predicting the Tehran Stock Exchange Index and determining the effective variables on it. Quarterly journal of economic research and policy, 50.
[3] Golestani, S., Ansari.L., S, & Abbaspour, R. (2014). Oil price forecast with ARFIMA_GARCH and fuzzy logic. The journal of energy economics studies, 10(41), 153-174. (In Persian)
[4] Natarajan, G. S., & Ashok, A. (2018). Multivariate Forecasting of Crude Oil Spot Prices using Neural Networks. arXiv preprint arXiv:1811.08963.
[5] Liu, H., & Chang, Y. (2017). Research on international crude oil price forecasting model. International journal of new development engineering and society, 1(3), 78-81.
[6] Bategeka, L, N., and Matovu, J. M (2011)
.
Oil wealth and potential dutch disease effects in Uganda.Economic policy research centre, 1-36
[7] Luo, Z., Cai, X., Tanaka, K., Takiguchi, T., Kinkyo, T., & Hamori, S. (2019). Can we forecast daily oil futures prices? Experimental evidence from convolutional neural networks. Journal of risk and financial management, 12(1), 9.
[8] Karimzadeh, S. D., & Honarvar, N. (2017). Investigating the long-run relationship between crude oil price, gold price, housing price index and exchange rate in Iran using a structural vector error correction approach. Journal of energy economics studies, 53, 135-164. (In Persian)
[9] Verharami, V., & Sadeghi, M. (2017). The asymmetric effect of crude oil prices on demand in selected OPEC countries is the price analysis and dynamic panel. Journal of energy economics studies, thirteenth, 52, 35-59. (In Persian)
[10] rezazadeh, a., & Jahangiri, K. (2017). Impact of oil price volatility on the economic growth of major oil-producing countries: vector autogeneration approach in panel Data (PVAR). Journal of energy economics studies, thirteenth,52, 153-180. (In Persian)
[11] Dindar Rostami, M., Shirinbakhsh, S., & Afshari, Z. (2019). The effects of oil price shocks on discretionary fiscal policy in selected opec countries: panel structural vector autoregressive. Iranian journal of economic studies, 8(1), 7-25.
[12] Davies, P. (2007). What’s the Value of an Energy Economist?. Speech presented at the International Association for Energy Economics, Wellington, New Zealand.
[13] Baumeister, C., & Kilian, L. (2012). Real-time forecasts of the real price of oil. Journal of business & economic statistics, 30(2), 326-336.
[14] Baumeister, C., & Kilian, L. (2014). What central bankers need to know about forecasting oil prices? International economic review, 55(3), 869-889.
[15] Baumeister, C., Kilian, L and Zhou, X. (2014)
.
Is product spreads usefulfor forecasting oil prices? anempirical evaluation of the verlegerhypothesis, forthcoming, macroeconomic dynamics
.
Retrieved 20September, 2019 from
https://pdfs.semanticscholar.org/3b9d/1f71973aad8f9724648f214f0625713e07db.pdf
[16] Besso, C. R., & Pamen, E. P. F. (2017). Oil price shock and economic growth. Experience of cemac countries, 8(1).
[18] Ftiti, Z., Guesmi, K., Teulon, F., & Chouachi, S. (2016). Relationship between crude oil prices and economic growth in selected OPEC countries. Journal of applied business research, 32(1), 11.
[19] Nicholis, S. C., & Sumpter, D. J. T. (2011). A dynamical approach to stock market fluctuation. International journal of bifurcation and chaos, 21(12), 3557-564.
[20] Olaniyi, A. A., Adedotun, K. O., & Samuel, O. A. (2018). Forecasting methods for domestic air passenger demand in Nigeria. Journal of applied research on industrial engineering, 5(2), 146-155.
[21] Lee, Y. H., Hu, H. N., & Chiou, J. S. (2010). Jump dynamics with structural breaks for crude oil prices. Energy economics, 32(2), 343-350.
[22] Cont, R. (2001). Empirical properties of asset return: stylized facts and statistical issues. Quantitative finance, 223–236.
[23] Li, T., Hu, Z., Jia, Y., Wu, J., & Zhou, Y. (2018). Forecasting crude oil prices using ensemble empirical mode decomposition and sparse Bayesian learning. Energies, 11(7), 1882.
[24] Rasoli, S., Tabesh, H., & Etminani, K. (2018). Evaluation of artificial intelligence models of time series in forecasting the number of hospital inpatient admission. Journal of health and biomedical informations, 5(1), 12-24. (In Persian)
[25] Mohaghegh, S., Richardson, M., & Ameri, S. (2001). Use of intelligent systems in reservoir characterization via synthetic magnetic resonance logs. Journal of petroleum science and engineering, 29(3-4), 189-204.
[26] Preeti, G., & Santi, B (2012). Stock market forecasting techniques: A survey. Journal of theoretical and applied information technology. 1(46). a24-30
[27] Weiss, W. W., Balch, R. S., & Stubbs, B. A. (2002, January). How artificial intelligence methods can forecast oil production. In SPE/DOE improved oil recovery symposium. Society of Petroleum Engineers. [28] Keerthan, J, S. Nagasi, Y. & Shaik, S. (2019). Machine learning algorithms for oil in price prediction.
International journal of innovative technology and exploring engineering (IJITEE), 8(8), 958.963. [29] Dourra, H., & Siy, P. (2002). Investment using technical analysis and fuzzy logic. Fuzzy sets and
systems, 127(2), 221-240.
[30] Shirouehzad, H., & Anvari, S. M. (2014). Prioritization of sustainable production indicators using fuzzy inference system. Journal of applied research on industrial engineering (JARIE),1(2), 96-111.
[31] Washington. D. C. (2017). What Drives Crude Oil Prices. Retrieved 20 September, 2019 from https://knoema.com/WHTDRCOP2019Oct/what-drives-crude-oil-prices-october-2019
[32] Hammond, J. L. (2011). The resource curse and oil revenues in Angola and Venezuela. Science & society, 75(3), 348-378.
[33] Mehrara, M., & Makini, N, M. (2009). Investigation of the nonlinear relationship between oil revenues and economic growth using the limit method (Case of Iran). Journal of energy economics, 6(22), 29-52. (In Persian)
[34] Chien, C. (1990). Fuzzy logic in control systems: fuzzy logic controller. IEEE Trans Syst Man Cybern Part II, 20, 429-434.
[35] Kerre, E. E. (1992, August). A comparative study of the behavior of some popular fuzzy implication operators on the generalized modus ponens. In Fuzzy logic for the management of uncertainty (pp. 281-295). John Wiley & Sons, Inc.