INTERNATIONAL JOURNAL OF PHARMACEUTICAL, CHEMICAL AND BIOLOGICAL SCIENCES
Available online at www.ijpcbs.com
DEVELOPMENT AND VALIDATION OF NEW RP-HPLC METHOD
FOR THE DETERMINATION OF TIROFIBAN IN
PHARMACEUTICAL FORMULATION
K. Sridevi Ranjitha2 and A. Lakshmana Rao1*
1V.V. Institute of Pharmaceutical Sciences, Gudlavalleru, Andhra Pradesh, India.
2Sri Sai Aditya Institute of Pharmaceutical Sciences and Research, Surampalem, Andhra Pradesh,
India.
*Corresponding Author
INTRODUCTION
Tirofiban hydrochloride belongs to the category of antiplatelet agents. Chemically it is (S)-2-(butylsulfonamino)-3-(4-[4-(piperidin-4-yl)butoxy]phenyl)propanoic acid1 (Fig. 1). It is a reversible antagonist of
fibrinogen binding to the GP IIb/IIIa receptor, the major platelet surface receptor involved in platelet aggregation. When administered intravenously, it inhibits ex vivo platelet aggregation in a
dose- and concentration-dependent
manner. Literature survey revealed that few LC-MS2-3 methods are available for
determination of tirofiban. In the present
investigation a simple, rapid, accurate and
precise RP-HPLC method has been
developed for the quantitative
determination of tirofiban hydrochloride in bulk and pharmaceutical dosage forms.
MATERIALS AND METHODS Chromatographic conditions
The analysis of the drug was carried out on a Waters HPLC 2695 separation module equipped with a reverse phase Develosil C8
column (250mmx4.6mm; 5μm), a 20 μl injection loop and UV Visible detector.
Research Article
ABSTRACT
A simple, rapid and precise reverse phase high performance liquid chromatography method has been developed and validated for the determination of tirofiban in pharmaceutical formulation. Chromatography was performed by HPLC 2695 Waters Separation Module with Develosil C8 column 4.6×250 mm, with 5 µ particle size and the
column maintained at ambient temperature. The injection volume was 20 µl and the total run time was 10 min. The detection was carried out at 277 nm. The mobile phase consisted of 1-octane sulfonic acid buffer (pH 3.0) and acetonitrile (55:45 v/v). Prepared mobile phase was filtered through 0.45 µ membrane filter and sonicated. Sample solution was prepared by dissolving the contents of the vial in diluents. The mobile phase was delivered at a flow rate of 1 ml/min.
Chemicals and solvents
The reference sample of tirofiban was supplied by M/s Natco Pharma Ltd.,
Hyderabad. HPLC grade water was
prepared in the laboratory from triple distillation unit. Acetonitrile and 1-octane sulphonic acid are of HPLC grade, orthophosphoric acid of AR grade were obtained from E. Merck (India) Ltd., Mumbai.
Preparation of mobile phase solution
Mix 550 ml of pH 3.0 1-octane sulfonic acid buffer and 450 ml of acetonitrile into an appropriate flask. Filter it and sonicate it for 2 minutes.
Preparation of buffer
Accurately weigh and transfer 2 gm of 1-octane sulphonic acid into 1000 ml water. Adjust pH to 3.0 with orthophosphoric acid.
Preparation of standard solution
Weigh accurately 50 mg of tirofiban and transfer into a clean and dry 100 ml volumetric flask, add about 30 ml of diluent was added, sonicated for 20 minutes and diluted up to the mark with diluent. From this take 5 ml into a 50 ml volumetric flask and make up the volume with diluent.
Procedure
A mixture of buffer and acetonitrile in the ratio of 55:45 v/v was found to be the most suitable mobile phase for ideal separation of tirofiban hydrochloride. The solvent mixture was filtered through a membrane filter and sonicated before use. It was pumped through the column at a flow rate of 1 ml/min. The column was maintained at ambient temperature. The column was equilibrated by pumping the mobile phase through the column for at least 30 min prior to the injection of the drug solution. The detection of the drug was monitored at 277 nm. The run time was set at 10 min. Under
these optimized chromatographic
conditions the retention time obtained for the drug was 4.943 min. A typical chromatogram showing the separation of the drug is given in Fig. 2.
Fig. 1: Chemical structure of tirofiban
Linearity
The linearity of the method was
demonstrated over the concentration range of 100-500 µg/ml. Aliquots of 100, 200, 300, 400 and 500 µg/ml were prepared from stock solution and labeled as solution 1, 2, 3, 4 and 5 respectively. The solutions were injected in to HPLC system as per test procedure.
Calibration plot
20 μl of each dilution was injected three times into the column at a flow rate of 1
ml/min and the corresponding
chromatograms were obtained. From these chromatograms, the average area under the peak of each dilution was computed. The calibration graph constructed by plotting concentration of the drug against peak area was found to be linear in the concentration range of 100-500 μg/ml of the drug. The regression equation of this curve was computed. A calibration curve of tirofiban is given in Fig. 3. The relevant data are furnished in Table 1.
Validation of the proposed method
reanalyzed by the proposed method and the results are furnished in Table 4. The system suitability parameters are given in Table 5.
Estimation of tirofiban hydrochloride in injection
Transfer the contents of the vial into a clean and dry 100 ml volumetric flask and make up the volume with diluent. Separately inject equal volumes (20 µl) of diluents as blank, standard preparation and sample preparations into the chromatograph and record the chromatograms and measure the peak area responses for the analyte peaks and calculate the percentage content of tirofiban injection. The relevant results are furnished in Table 6.
Fig. 2: Standard chromatogram of tirofiban hydrochloride
Fig. 3: Calibration curve of tirofiban
Table 1: Calibration data of tirofiban
Concentration Area
100 159873
200 301846
300 471619
400 639492
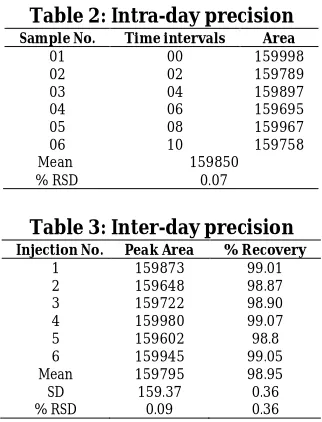
Table 2: Intra-day precision
Sample No. Time intervals Area
01 00 159998
02 02 159789
03 04 159897
04 06 159695
05 08 159967
06 10 159758
Mean 159850
% RSD 0.07
Table 3: Inter-day precision Injection No. Peak Area % Recovery
1 159873 99.01
2 159648 98.87
3 159722 98.90
4 159980 99.07
5 159602 98.8
6 159945 99.05
Mean 159795 98.95
SD 159.37 0.36
% RSD 0.09 0.36
Table 4: Accuracy data of tirofiban
Table 5: System suitability parameters
Parameter Results
Theoretical plates (N) 9065
Linearity range (μg/ml) 100-500
Retention time (min) 4.943
Tailing factor 1.3
Correlation coefficient 0.999
LOD (μg/ml) 0.010 LOQ (μg/ml) 0.032
% RSD 0.02
RESULTS AND DISCUSSION
In the proposed method, the retention time of tirofiban hydrochloride was found to be 4.943 min. Quantification was linear in the concentration range of 100-500 μg/ml. The regression equation of the linearity plot of
concentration of tirofiban over its peak area
was found to be Y=1616X-10550
(R2=0.999), where X is the concentration of
tirofiban (μg/ml) and Y is the corresponding peak area. The use of 1-octane sulfonic acid buffer and acetonitrile in the ratio of 55:45
Sample No. Concentration Peak area % Recovery Mean % recovery SD % RSD
1 50% 76051 101.08
101.05 0.025 0.024
2 50% 75982 101.03
3 50% 75994 101.05
4 100% 151004 100.3
100.5 0.2 0.199
5 100% 151252 100.5
6 100% 151468 100.7
7 125% 228010 101.06
101.15 0.09 0.088
8 125% 228246 101.17
v/v resulted in peak with good shape and resolution. The high percentage of recovery indicates that the proposed method is highly accurate. No interfering peaks were found in the chromatogram of the
formulation within the run time indicating that excipients used in the formulation did not interfere with the estimation of the drug by the proposed HPLC method.
Table 6: Estimation of tirofiban in pharmaceutical dosage form
CONCLUSION
The proposed HPLC method is rapid, sensitive, precise and accurate for the determination of tirofiban and can be reliably adopted for routine quality control analysis of tirofiban hydrochloride in bulk and in pharmaceutical formulation.
ACKNOWLEDGEMENTS
The authors are thankful to M/s Natco Pharma Ltd., Hyderabad for providing a reference sample of tirofiban.
REFERENCES
1. www.rxlist.com
2. Ellis JD, Hand EL and Gilbert JD. Use of LC-MS/MS to cross-validate a
radioimmunoassay for the
fibrinogen receptor antagonist, Aggrastat (tirofiban hydrochloride) in human plasma. J Pharm Biomed Anal. 1997;15(5):561-569.
3. Oertel R, Kohler A, Koste A and Kirch W. Determination of tirofiban in
human serum by liquid
chromatography–tandem mass
spectrometry. J Chromatogr B. 2004;805(1):181-185.
Sample Labeled amount (mg) Amount found (mg) % of drug present