http://www.sciencepublishinggroup.com/j/bsi doi: 10.11648/j.bsi.20170204.17
Statistical Analysis of Factors Affecting the Weight of
Babies at Birth
Obikee Adaku Caroline
1, *, Obiora-Ilouno Happiness Onyebuchi
1, Okoli Cecilia Nchedo
21
Department of Statistics, Faculty of Physical Sciences, Nnamdi Azikiwe University, Awka, Nigeria 2
Department of Statistics, Faculty of Physical Sciences, Chukwuemeka Odumegwu Ojukwu University, Uli, Nigeria
Email address:
obiorailounoho@yahoo.com (Obiora-Ilouno H. O.), pobikeeadaku@yahoo.com (Obikee A. C.), cecilia.okoli@yahoo.com (Okoli C. N.) *
Corresponding author
To cite this article:
Obikee Adaku Caroline, Obiora-Ilouno Happiness Onyebuchi, Okoli Cecilia Nchedo. Statistical Analysis of Factors Affecting the Weight of Babies at Birth. Biomedical Statistics and Informatics. Vol. 2, No. 4, 2017, pp. 172-179. doi: 10.11648/j.bsi.20170204.17
Received: May 6, 2017; Accepted: May 25, 2017; Published: November 15, 2017
Abstract:
This research work studied statistically those factors which determine the weight of a baby at birth. The data used in this research work was collected from the Prenatal and Postnatal Register of Ebonyi State University Teaching Hospital Abakaliki, Nigeria. The data covered all births recorded from January 2009 to December 2013. Factors which determine birthweight are numerous but for this work, variables of greater influence were considered which include: Mother’s age, Parity, Method of Delivery and the Sex of the baby. By Chi-square Test Statistics, it was observed that the birthweight of a baby depends on the sex of the baby with a calculated value 12.14 and a critical value 7.81 0.5 level of significance. Also the method of delivery of a baby also proved to be a significant factor affecting birthweight with a calculated 50.90 and a critical value 12.6 By Chi-Square Test also, the mother’s age and parity shown not to be significant factors affecting birthweight with Chi-Square values 1.90, 1.001 and critical values of 12.6 and 7.81The Z–Test Statistic was also applied to test for the significance difference between the mean birth weigh of male and female babies and it yielded a calculated value 6.48 and a critical value 1.96 at 0.5 level of significance which indicates that there is a significant difference between the mean birthweights of sex of the babies. Also by Z–Test also, method of delivery proved to be a significant factor affecting birthweight with a calculated value 5.41 and a critical value 1.96. Time Series Analysis was also employed to obtain the seasonal variations between the sex of babies and it was observed that more female babies are born during the third quarter and more male babies are born during the fourth quarter of the year. Also by Least Square Method of Regression Analysis, it was predicted that in the year 2014, the total number of male and female birth will be 140 and also in the year 2015, the total numberof male and female birth will be 141.Keywords:
Low Birthweight, Parity, Caesarian Section, Chi-Square, Trend Line, Prediction, Seasonal Variations1. Introduction
This Birthweight is the weight of a baby at its birth. It has a direct link with the gestational age at which the baby was born and can be estimated during pregnancy by measuring the feudal height. The factors affecting birthweight are those factors which determine the weight of a baby at its birth. The study of factors affecting birthweight has been extensively and systematically studied in many parts of the world. A few studies relating to Nigeria merely gave an average weight for children born in the different parts of the world. The knowledge of the factors affecting birthweight in any community is of utmost importance not only to a layman but also to the government for policy making, gynecologist and
pediatricians. Invariably, this study was set out to investigate those factors which appear to have effect on the birthweight of babies born in Ebonyi State University Teaching Hospital Abakaliki Nigeria.
Some of the variables that affect birthweight are:
a Gestational age (Duration of pregnancy).
b Number of children born before the last birth (Parity) c Age of the mother at the birth of the baby
d Sex of the baby
e Method of delivery of the baby
f Head circumference of the baby
g Length of the baby
h Multiple birth
j Nutritional state of the mother during pregnancy etc. Classification of babies by weight and gestational period
a Low birthweight (LBW) babies are those weighing
below 2500g at birth.
b Extremely Low Birthweight (ELBW) babies are those
weighing under 100g at birth
c Very Low Birthweight (VLBW) babies are those
weighing below 500g at birth
The study of birth weigth measurement has been with us for many decades, numerous studies have been carried out to find the relationship between birth weigth and other variables such as the maternal age, birth order or parity, socio-economic status of parents and so on. The consensus has been that infants with low birth weigth were generally gestational premature and Low birthweight (LBW) has been defined by WHO as weight at birth of less than 2.5 kg. The World Health Organization also recommended the use of birthweight as a measure of prematurity in babies. [1-2]. A study of Impact of maternal nutrition on birth weight of babies has revealed the influence of maternal nutritional status on newborn birthweight and particularly low birth weight (LBW) and has shown that maternal nutritional status impacted significantly on newborn birthweight as poorly nourished mothers were observed to produce a higher percentage of LBW babies in comparison to those who were better nourished [3]. Also a study on Risk Factors Associated with Low Birth Weight Babies in Eastern Nepal revealed that maternal height, time of first antenatal care (ANC) visit, number of ANC visits, iron supplementation, calcium supplementation, maternal education, any illness during pregnancy, and hypertension were found as the significant predictors of LBW [4]. A study on maternal Determinants of birthweight has shown that pre-pregnancy body mass index and weight gain during pregnancy influence birthweight. Therefore, emphasis should be placed on counseling and assisting pregnant women to stay within the recommended weight gain ranges [5]. The prenatal period is an important one for both mother and the fetus. The child’s endowments at birth depends wholly on the genetic make-ups of the mother and other factors like the birth process, medical interventions, social, emotional and physical factors of the environment. Some of the causes of prematurity in babies includes: multiple pregnancies, fetal abnormalities, maternal malnutrition, drugs taken by the mother (including nicotine and alcohol) during pregnancy, placental abnormalities, infection, maternal disease such as hypertension and structural or endocrine abnormalities in the mother [6-7]. A study on Maternal Dietary Patterns and Practices and Birth Weight in Northern Ghana has shown that Mothers who practiced good nutrition such as consuming foods across and within the various food groups were less likely to have low birth weight babies. Their findings buttress the importance of optimal nutrition during pregnancy [8]. A recent study on Air pollution, neighbourhood and maternal-level factors modify the effect of smoking on birth weight in British Columbia, Canada has also proved that Maternal smoking during pregnancy negatively impacts fetal growth [9].
Since birthweight is an index of growth of the fetus in the
uterus, it will help the obstetricians and pediatricians to plan on how the next pregnancy should be handled. It will also help to determine the fate of the mother in the subsequent pregnancies as it can decide whether the mother will deliver through a caesarian section or not.
References can also be made to the following papers who have worked in this area in the same regards: Khader YS, and Fa AN Q. (200) [10], Hold Chris and Mac Donald Anita(2007) [11], Shino et al (2006) [12], Queenan(1999) [13], Dalby (1978) [14], Roberton(1999) [15] etc.
Motivation of study
Birthweight is one of the most important variable of concern to many governments in developing countries as it contributes to infant mortality rate. Factors affecting birthweight should be of interest to all as its knowledge will help to reduce child-mother mortality rate in the world.
Five variables collected for the analysis include:
a Weight of baby at birth
b Sex of the baby
c Age of the mother
d Parity
e Method of delivery
f This study seeks to achieve the following objectives: g Determine if the sex of the child has an effect on the
child’s birthweight.
h If the mother’s parity has an effect on the child’s birthweight.
i If the mother’s age has an effect on the child’s birthweight.
j If the method of delivery of the child has an effect on the child’s birthweight.
Hypothesis of Interest
1. Ho: There is no association between birthweight and the
mother’s parity.
2. Ho: There is no association between birthweight and the
mother’s age.
3. Ho: There is no association between birthweight and the
method of delivery.
4. Ho: There is no association between birthweight and the
sex of the child
2. Research Methodology
2.1. Chi-Square Test Statistic
The Chi-Square Test Statistic is to be employed in this
analysis to test the null hypothesis of the
association/independence between birthweight and the sex of baby, mother’s age, method of delivery and parity.
(
)
22
1 1
r c
ij ij
cal
i j ij
n E
x
E
= =
−
=
∑∑
(1)with (r-1)(c-1) degrees of freedom Where
Eij = The expected frequency in the ith row and jth column.
r = Number of rows. c = Number of rows and If the calculated value 2
cal
x
is greater than the table value( )( ) 2
1 1
r c
x
− − , the null hypothesis of independence is rejected atsome level of significance α or otherwise accepted.
2.2. Test of Significant Differences Using the Z-Test Statistic
The Z-Test statistic will be used here to test if there is any significant difference between the hypotheses drawn. And if there is, at what level of significant does it differ.
The modernized Z-Test that will be used for this analysis is:
1 2
2 2
1 2
1 2
Z
X
X
s
s
n n
− =
+
(2)
Which after will be compared with the Z- tabulated at Zα/2 degrees of freedom.
2.3. Method of Time Series
Time series is a set of statistical data which is observed, recorded or collected at uniform intervals of time. It has the model:
Yt = Tt + St + Ct + It (Additive Model) (3)
Where Tt is the trend.
St is the seasonal variation.
Ct is the cyclical variation.
It is the irregular variation.
2.4. Least Square Method of Regression Analysis (Matrix Approach)
Using the least square method to estimate the trend line, we have that
t t i
Y = +α β +e i =1, 2, - - -, n (4)
Using the matrix approach of solving least square equation, we have that;
1
1
1
2
Y
tY
n
t
t
t
α
β
−
=
∑
∑
∑
∑
∑
(5)
Where
n = Number of period t = Time Unit
Yt = Estimated tend value for a given time period
α = The trend line value t = 0
β = The slope of the trend line i. e the change in Yt per unit
of time
3. Result
3.1. Chi-Square Analysis
Table 1. Group weight of babies at birth by sex.
Sex
Birthweight Male Female Total
0.65-1.54 55(39.97) 91(106.03) 146 1.55-2.44 47(44.90) 17(119.10) 164 2.45-3.34 71(83.23) 233(220.77) 304 3.35-4.24 14(18.89) 55(50.11) 69 Total 187 496 683
The expected frequencies are those enclosed in brackets Ho: There is no association between birth weight and sex of
babies.
H1: There is an association between the birth weight and sex
of babies
2
12.14
cal
x
=At a=0.05,
x
( )( )24 1 2 1x
(23,0.05) 7.81− − = =
Decision: Since the 2 12.14
cal
x
= >x
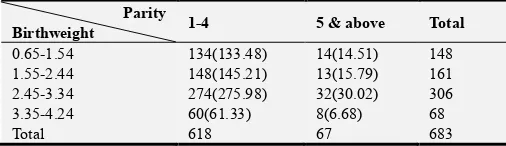
(23,0.05)=7.81, the null hypothesis is rejected which implies that there is an association between the birth weight sex of babies.Table 2. Group weight of babies at birth my mother’s parity.
Parity
Birthweight 1-4 5 & above Total
0.65-1.54 134(133.48) 14(14.51) 148 1.55-2.44 148(145.21) 13(15.79) 161 2.45-3.34 274(275.98) 32(30.02) 306
3.35-4.24 60(61.33) 8(6.68) 68
Total 618 67 683
Ho: There is no association between birth weight and
mother’s parity.
H1: There is an association between the birth weight and
mother’s parity
2
1.001
cal
x
=At a=0.05, the table value
x
( )( )24 1 2 1x
(23,0.05) 7.81− − = =
Decision: Since the 2 12.14
cal
x
= <x
(23,0.05)=7.81, the nullhypothesis is accepted which implies that there is no association between the birth weight and mother’s parity.
Table 3. Group weight of babies at birth by mother’s age.
Age
Birthweight 10-20 21-30 31 & Above Total 0.65-1.54 25(18.51) 77(81.57) 45(46.91) 147 1.55-2.44 23(20.40) 98(89.89) 41(51.72) 162 2.45-3.34 28(38.40) 171(169.25) 106(97.35) 305 3.35-4.24 10(8.69) 33(38.29) 26(22.02) 69
Ho: There is no association between birth weight and
mother’s age.
H1: There is an association between the birth weight and
mother’s age
2
11.15
cal
x
=At a=0.05, 2 11.15
cal
x
= <x
(26,0.05)=12.6,Decision: Since the 2 11.15
cal
x
= <x
(26,0.05)=12.6, the null hypothesis is accepted meaning that there is no association between birth weight and mother’s age.Table 4. Group weight of babies at birth by method of delivery.
Mtd of Delivery
Birthweight Normal delivery Caesarian section Multipl & other Mtds of delivery Total
0.65-1.54 79(108.04) 45(23.24) 23(15.72) 147 1.55-2.44 117(120.54) 27(25.93) 20(17.53) 164 2.45-3.34 256(222.70) 25(47.91) 22(31.49) 303 3.35-4.24 50(50.71) 11(10.91) 8(7.37) 69
Total 502 108 73 683
Ho: There is no association between birth weight and
method of delivery.
H1: There is an association between the birth weight and
method of delivery
2
50.90
cal
x
=At a=0.05,
x
(26,0.05)=12.6Decision: Since the 2 50.90
cal
x
= >x
(26,0.05)=12.6, the null hypothesis is rejected which implies that there is an association between the birthweight and method of delivery of a child.3.2. Z-Test of Significant Difference Between the Mean-Birthweight of Sex of Baby
Ho: There is no significant difference between the
mean-birthweight of sex of babies i.e (µ1=µ2)
H1: There is a significant difference between the
mean-birthweight of sex of babies i.e (µ1≠µ2)
Table 5. Z-Test for birthweight against the sex of babies.
SEX N Mean Variance
MALE 187 2.21 0.74 FEMALE 496 2.45 0.68
2.45 2.21
0.74 0.68
187 496
Z = −
+
0.24 0.005328186993
0.24 0.0370
6.48
=
=
Decision: Since Zcal = 6.48>1.96, Hence the null hypothesis
is rejected which implies that there is a significant difference
between the mean birth weights of sex of the babies.
Table 6. Z-Test for weight against the method of delivery.
Method of delivery N Mean Variance
Normal 502 2.49 0.62 Caesarian 108 2.01 0.85
Ho: There is no significant difference between the meant
weight of babies born through normal delivery and those borne through Caesarian method of delivery.
H1: There is a significant difference between the meant
weight of babies born through normal delivery and those borne through Caesarian method of delivery
Z =2.49 − 2.01 − 0 0.62
502 +0.85108
= 0.48
√0.001235 + 0.00787
= 0.48
√0.00910543= 0.48
0.0887 = 5.41
At α = 0.05, Z. 025 = 1.96
Decision: Since Zcal = 5.41 is greater (>) Zα/2 = 1.96, hence,
the null hypothesis is rejected which implies that there is a significant difference between the mean weight of babies born through normal delivery and those borne through Caesarian method of delivery.
3.3. Time Series Analysis
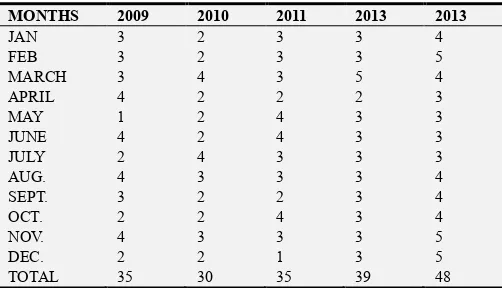
Table 7. Number of male birth between the years 2009 to 2013.
MONTHS 2009 2010 2011 2013 2013
JAN 3 2 3 3 4
FEB 3 2 3 3 5
MARCH 3 4 3 5 4 APRIL 4 2 2 2 3
MAY 1 2 4 3 3
Table 8. Number of female birth between the years 2009 to 2013.
MONTHS 2009 2010 2011 2012 2013
JAN 7 9 8 6 9
FEB 8 7 6 5 8
MARCH 10 7 10 6 10 APRIL 7 8 11 6 10 MAY 12 11 10 6 11 JUNE 8 7 7 5 9 JULY 8 9 7 8 7 AUG. 7 9 8 6 9 SEPT. 8 10 7 6 7 OCT. 11 9 10 7 7 NOV. 9 9 8 8 10 DEC. 10 10 10 8 10 TOTAL 105 105 102 77 107
Table 9. Computation of Seasonal Variation of male birth from the year 2009
to 2013 using the Ratio-to-Moving Average Method.
Years QTRS Acute value
4-Qtr moving total
8-Qtr. Moving total
Centered 8-Qtr M. A (trend)
Seasonal variation
2009 1st Qtr 9 - - - -
2nd Qtr 9 35 - - -
3rd Qtr 9 34 69 8.63 104.29
4th Qtr 8 31 65 8.13 98.40
2010 1st Qtr 8 31 62 7.75 103.23
2nd Qtr 6 30 62 7.75 77.42
3rd Qtr 9 31 62 7.75 116.13
4th Qtr 7 35 66 8.25 84.85
2011 1st Qtr 9 34 69 8.63 104.29
2nd Qtr 10 35 69 8.63 115.87
3rd Qtr 8 37 72 9.00 88.89
4th Qtr 8 35 74 9.25 86.49
2012 1st Qtr 11 37 74 9.25 118.92
2nd Qtr 8 39 76 9.50 84.21
3rd Qtr 10 41 80 10.00 100.00
4th Qtr 10 42 83 10.38 96.34
2013 1st Qtr 13 44 85 10.63 122.30
2nd Qtr 9 48 91 11.38 79.09
3rd Qtr 12 - - - -
4th Qtr 14 - - - -
Computation of seasonal index
N/B: We eliminate the irregular variations in order to obtain the seasonal index. This is done by averaging the seasonal variations for each quarter.
Table 10. Computed Seasonal Index.
Quarters
Year 1 2 3 4 Total
2009 - - 104.29 98.40 - 2010 103.23 77.42 116.13 84.85 - 2011 104.23 115.87 88.89 86.49 - 2012 118.92 84.21 100 96.34 - 2013 122.30 79.09 - Total 448.68 356.59 409.31 366.08 - Quarterly
Average 112.17 98.15 102.33 91.52 404.17
To adjust the seasonal index x to total 400, we introduce a constant K by multiplying each quarterly average by K
Where K = ! = ."".#$
For Qtr 1, the adjusted seasonal index = 112.19 x 0.99 = 111.01
For Qtr 2, the adjusted seasonal index = 98.15 x 0.99 = 97.17
For Qtr 3, the adjusted seasonal index = 102.33 x 0.99 = 101.31
For Qtr 4, the adjusted seasonal index = 91.52 x 0.99 = 90.60
Table 11. Adjusted Seasonal Index for male birth.
Quarters Total
Adjusted
seasonal index 111.01 97.17 101.31 90.60 400.00
From the result above, the quarter that has the highest seasonal variation is the 1st quarter with a seasonal index of 113.56. This means that more male babies were born in the months of January, February and March. Also the 2nd quarter has the least seasonal variation with 90.24, which implies that less male babies were born in the months of April, May and June.
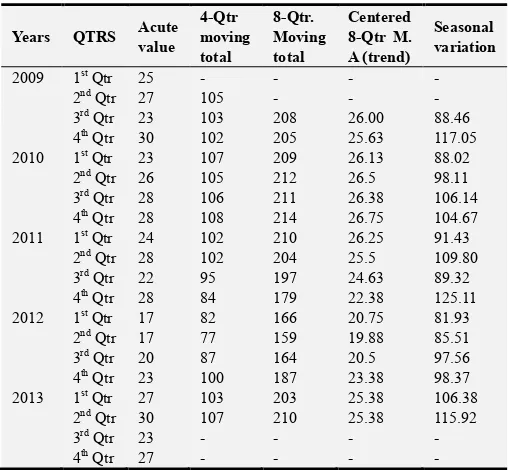
Table 12. Computation of Seasonal Variation of Female birth from the year
2009 to 2013 using the Ratio-to-Moving Average Method.
Years QTRS Acute value
4-Qtr moving total
8-Qtr. Moving total
Centered 8-Qtr M. A (trend)
Seasonal variation
2009 1st Qtr 25 - - - -
2nd Qtr 27 105 - - -
3rd Qtr 23 103 208 26.00 88.46
4th Qtr 30 102 205 25.63 117.05
2010 1st Qtr 23 107 209 26.13 88.02
2nd Qtr 26 105 212 26.5 98.11
3rd Qtr 28 106 211 26.38 106.14
4th Qtr 28 108 214 26.75 104.67
2011 1st Qtr 24 102 210 26.25 91.43
2nd Qtr 28 102 204 25.5 109.80
3rd Qtr 22 95 197 24.63 89.32
4th Qtr 28 84 179 22.38 125.11
2012 1st Qtr 17 82 166 20.75 81.93
2nd Qtr 17 77 159 19.88 85.51
3rd Qtr 20 87 164 20.5 97.56
4th Qtr 23 100 187 23.38 98.37
2013 1st Qtr 27 103 203 25.38 106.38
2nd Qtr 30 107 210 25.38 115.92
3rd Qtr 23 - - - -
4th Qtr 27 - - - -
Computation of seasonal index
The irregular and cyclic variations are eliminated by averaging the seasonal variations for each quarter in order to obtain the seasonal index.
Table 13. Computed Seasonal Index.
Year 1st Qtr 2nd Qtr 3rd Qtr 4th Qtr Total
2009 - - 88.46 117.05 2010 88.02 98.11 106.14 104.67 2011 91.43 109.80 89.32 125.11 2012 81.93 85.51 97.56 98.37 2013 106.38 115.92 - - Total 367.76 409.34 381.48 445.2 Quarterly
Average 91.99 102.34 95.37 111.3 401
Where K = ! = #= 0.9975
For Qtr 1, the adjusted seasonal index = 91.99 x 0.9975 = 91.76
For Qtr 2, the adjusted seasonal index = 102.34 x 0.9975 = 102.08
For Qtr 3, the adjusted seasonal index = 95.37 x 0.9975 = 95.13
For Qtr 4, the adjusted seasonal index = 111.33 x 0.9975 = 111.02
Table 14. Adjusted Seasonal Index for female birth,
Quarters Total
Adjusted
seasonal Index 91.76 102.08 95.13 11.02 399.99
Here, the adjusted seasonal index is 399.99, which is approximately 400.
From the table above, the 4th quarter has the highest seasonal effect with 111.02 seasonal index which implies that more female babies were born in the months of October, November and December. Also the 1st quarter has the least seasonal effect with 91.76 seasonal index, which implies that less female babies were born in the month of January, February and March.
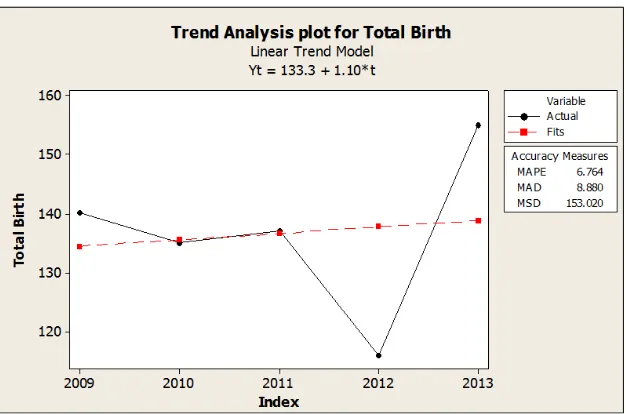
3.4. Estimation of Trend Line Using the Least Square Method of Regression Analysis
Table 15. Total number of male and female birth between the years 2009 to
2013.
Year Total birth
2009 140
2010 135
2011 137
2012 116
\2013 155
Total 683
Table 16. Estimated Trend Values.
Year t Yt t Yt t2 Yt2 Trend
2009 1 140 140 1 19600 134.4 2010 2 135 270 4 18225 135.5 2011 3 137 411 9 18769 136.6 2012 4 116 464 16 13456 137.7 2013 5 155 775 15 24025 138.8 Total 15 683 2060 55 94075
1
683 2060
5
15
15
55
α β
−
=
α = 37565 – 3090050 = 666.550 = 133.3
β = 10300 – 1024550 = 5550 = 1.1
The predicted line Yt=133.3 + 1.1(t) For t = 1
t
Y =133.3+1.1(1) = 134.4
For t = 2
t
Y =133.3+1.1(1) = 135.5
For t = 3
t
Y =133.3+(1.3(3) = 136.6
For t = 4
t
Y =133.3+1.1(4) = 137.7
For t = 5
t
Y = 133.3+1.1(5) =138.8
For t = 6
t
Y = 133.3+1.1(6)=139.9
Also For t = 7
t
Y =133.3+1.1(7) = 140
This implies that in the year 2014, the total number of male and female birth will be 139.9 which is approximately 140 and also in the year 2015, the total number of male and female birth will be 141.
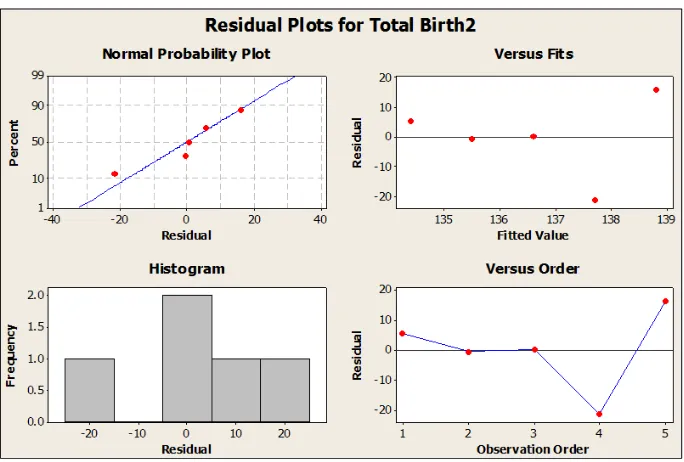
Figure 2. Residual plots of the observed and fitted values.
4. Discussion
The essence of this research work is to satisfactorily analyze the factors affecting birthweight at Ebonyi state university teaching hospital Abakaliki Nigeria. There is a clear indication that the number of female babies born in this hospital is far more than their male counterpart within the researcher’s scope of year. From the hypothesis, we concluded that the null hypothesis is significant 0.05 levels, which means that the baby’s birthweight is dependent upon their sexes. When the data were classified by the age of the mother, the highest birthweight was recorded for children born to women aged 21-30 years, from this peak the birthweight decreased progressively on both sides of the age scale. From the hypothesis the null hypothesis is not significant meaning that there is no association between birthweights and age of the mothers. From the result obtained in the analysis of birthweight and parity, the highest weight was recorded for the length interval 1-4. From this peak, the weight of babies at birth decreased signifying that the number of births delivered previously by mother determines the weight of subsequent births, from the hypothesis tested we concluded that the null hypotheses was significant at 0.05 level which means that there is no association or relationship between birth weight and parity and that the birth weight of a baby is not dependent upon the mother’s parity.
Finally, there is an indication that method of delivery has an effect on the birthweight of babies. Though the number of children born through spontaneous vertex delivery that is through (normal process) is higher than babies delivered through caesarean section (C/S), multiple and other methods of delivery but from the hypothesis drawn, we concluded that the null hypothesis is not significant, that is, the method of delivery of a child depends on the weight of baby.
5. Conclusion
The analysis of some of the factors affecting birthweight at EBSUTH Abakaliki Nigeria has been presented in the tables above.
In absolute terms, it was found in this work that the mean weight of male babies is less than that of the female babies.
However, when this difference in weights were subjected to a statistical test, it was found that there is a significant difference between the mean birthweight of male and female babies born in EBSUTH Abakaliki between the year 2009 to 2013. Sex was found to be a major significant factor affecting the birthweight of babies which was also discovered by Yokoyama et al (2005) in an analysis of factors affecting birthweight of babies. Also It was found in this work that the method of delivery was also a significant factor affecting the birthweight of babies because there is a significant difference between the mean birthweight of babies delivered normally and those delivered through caesarian section. It was discovered from this study that, sex of babies, method of delivery are the factors affecting the birthweight of babies born in EBSUTH Abakaliki by the use of chi-square.
References
[1] World Health Organization (WHO) Expert Committee on Maternal and Child Health “Public Health Aspect of Low Birth Weights” Technical Report Series. No. 217, 1961.
[2] World Health Organization, International Statistical Classification of Diseases and Related Health Problems, Tenth Revi sion, World Health Organization, Geneva, Switzerland, 1992.
[3] Amosu A. M and Degun A. M ‘Impact of maternal nutrition on birth weight of babies’ Biomedical Research 2014; 25(1): 75-78 ISSN 0971-9032 http://www.biomedres.info
[4] Ravi Kumar Bhaskar, Krishna Kumar Deo, Uttam Neupane, Subhadra Chaudhary Bhaskar, Birendra Kumar Yadav, Hanoon P. Pokharel, and Paras Kumar Pokharel ‘A Case Control Study on Risk Factors Associated with Low Birth Weight Babies in Eastern Nepal’ International Journal of Pediatrics. Volume 2015 (2015), Article ID 807373, 7 pages http://dx.doi.org/10.1155/2015/807373
[5] Abubakari A, Kynast-Wolf G, Jahn A (2015) Maternal Determinants of Birth Weight in Northern Ghana. PLoS ONE 10(8): e0135641. https://doi.org/10.1371/journal.pone. [6] Striessguth A.,“Fetal Alcohol Syndrom, A Guide for Families
and Communities’’. Baltimore Publishing ISBN1-55766-283-5, 1997.
[7] Lamont RF and Jagged A. N, “Emerging drug therapies for preventing spontaneous preterm labor and preterm birth”. Expert Opine Investing Drugs 2007, Vol 16. Pg 337-345. PMIP1730, 2007.
[8] Abdulai Abubakari, Albrecht Jahn ‘Maternal Dietary Patterns
and Practices and Birth Weight in Northern Ghana’ Pub lished:
September 9, 2016
https://doi.org/10.1371/journal.pone.0162285
[9] Anders C. Erickson, Aleck Ostry, Hing Man Chan and Laura Arbour BMC Public Health BMC series – open, inclusive and trusted 201616: 585 DOI: 10.1186/s12889-016-3273-9 [10] Khader YS, Fa AN Q., “The periodontal diseases and the risk
of preterm birth” 2005.
[11] Hold Chris and Mac Donald Anita, “Nutrition and child Health” Retrieved 04-03-2007.
[12] Shino, Mayo Clinic (2006): “Premature Birth”.
[13] Queenan John, “Management of High Risk Pregnancy” 2007. [14] Dolby J. T., “Environmental effects on prenatal development
soured of pediatric psychology”, Vol 3, Pg 105-109, 1978.
[15] Roberton NRC “Fetal growth, intrauterine growth retardation and small for gestational age babies”. In JM, Roberton NRC (eds) textbook of neonatology, Churchill Livingstone, London. Pg 389-398, 1999.
[16] Conde-Agudelo A., Diaz-Rossello, Belizan J. M., “Kangoroo care to reduce morbidity in low Birth weight” 2001.
[17] Diane M. Fraser and Margaret A. Cooper, “Myles Textbook for midwives” 14th Edition.
[18] Dole N., D. A. Savittz, M. J. Mcmahoa and P. Buekens, “Maternal Stress and Preterm Birth” 2003.
[19] OYEKA I. C. A, “An Introduction to Applied Statistical Methods in Sciences” third Edition 1992.