0.05% MMS 0.03%
MMS
Drug concentration
Supplementary Figure 1. Sensitivity of Isw2 and Ino80 complex mutants to inhibitors of
replication.
(a)MMS sensitivity of isw2 nhp10 and isw2 ino80∆900 mutants. Wild type (W1588-4c), isw2 (YTT1080),
nhp10 (YTT2060), isw2 nhp10 (YTT2109), ino80∆900 (YTT4179), and isw2 ino80∆900 (YTT4207) stationary phase cells were spotted across YPD plates containing gradients of MMS. The maximum concentration of the drug is indicated at the left. See Supplementary Methods for the protocol to make drug gradient plates.
(b) Survival of isw2 nhp10 mutants during MMS treatment in culture. Strains as in (a) were grown to early log phase, treated with the indicated concentrations of MMS for one hour, then plated. Percent survival (+/- the standard deviation) of wild type, isw2 nhp10, and mag1 (YTT2770, an MMS sensitive control strain) was determined by plating known numbers of cells before and after drug treatment and counting colonies.
(c) Spot tests of UV and gamma irradiated cells. 10-fold serial dilutions of saturated cultures (a) were spotted to YPD plates then exposed to the doses of radiation indicated. Note that the number of colonies at each spot is comparable in each strain.
(d) Sensitivity of isw2 nhp10 mutants to other DNA replication inhibitors. Stationary phase cells were spotted across YPD plates containing gradients of Hydroxyurea (HU), 4-nitroquinoline 1-oxide (4-NQO), or Camptothecin (CPT) as in (a).
WT
isw2 nhp10 isw2 nhp10
WT
isw2 nhp10 isw2 nhp10
WT
isw2 ino80∆900 isw2 ino80∆900
WT
isw2 ino80∆900 isw2 ino80∆900
0.05% MMS 0.03%
MMS
0 20 40 60 80 100
0 0.05 0.1 0.15
WT isw2 nhp10
mag1
% Viability
% MMS
a
Control (YPD)
γ IR
(1000 gy)
UV (200 J/m2)
WT
isw2 nhp10 isw2 nhp10
b
0.25µg/ml 4-NQO
75mM HU
50µg/ml CPT
WT
isw2 nhp10 isw2 nhp10
WT
isw2 nhp10 isw2 nhp10
WT
isw2 nhp10 isw2 nhp10
WT
isw2 nhp10 isw2 nhp10
WT
isw2 nhp10 isw2 nhp10
c
d
Supplementary Figure 2. Replication profiles of MMS treated cells.
(a) Schematic diagram of the dense isotope transfer experiments conducted in the presence of 0.015% MMS, and the generation of replication profiles from isotope labelled DNA collected throughout S phase.
(b) FACS analyses of cell collection for generation of replication profiles. Wild type (YTT1831) and isw2 nhp10 (YTT3306) cells were treated as outlined in (a) and collected for FACS at the indicated times after release from α-factor arrest. Samples used for generation of replication profiles shown in Figure 2 and in (c) are indicated by asterisks. Gray profiles are from cells collected prior to G1 arrest.
(c) Replication profiles were generated from the samples indicated in (b). The collection of isw2 nhp10 mutants began at 45 minutes post-release because of a slight delay in cell cycle initiation following alpha-factor arrest characteristic of the double mutant (b). Profiles from corresponding collection times are the same color. The total percentage of replication for the whole genome at each time-point was determined by slot blot of both replicated and unreplicated fractions used for microarray analysis, followed by hybridization with radioactively labeled and fragmented genomic DNA. Positions of confirmed and likely ARSs, defined at www.oridb.org, are indicated at the bottom of each graph. Filled triangles correspond to origins identified in two studies of replication timing1,2 as being amongst the earliest 25% of origins replicated in a normal S phase. Open
triangles represent origins that are amongst the earliest 25% in only one of the two studies. The filled circles correspond to remaining origins. Origins that are active in wild type cells treated with 200mM Hydroxyurea3 are indicated in red. Positions of centromeres are indicated by the black
1) Grow in dense (13C 15N) media α-factor
105 min
2) Transfer to light(12C 14N)media α-factor
75 min MMS 60 min
3) Release in light media + MMS 4) Collect cells throughout S phase
replicated
unreplicated
6) Separate replicated DNA on CsCl gradient
7) Label replicated & unreplicated DNA 8) Compete
replicated & unreplicated DNA on microarray 9) Generate replication
profiles % r
e
p
lic
a
tio
n
early-S mid-S
late-S
5) Prepare and digest genomic DNA
a
WT
isw2 nhp10
*
*
*
b
*
*
*
*
*
*
*
Time
(min)
0
30
45
60
75
90
105
120
135
150
Chromosome Coordinate
0 20 40 60 80 100
0 100 200
0 20 40 60 80 100
0 100 200 300 400 500 600 700 800 900 1000 1100 1200 1300 1400 1500
0 20 40 60 80 100
0 100 200 300 400 500 600 700 800
0 20 40 60 80 100
0 100 200 300
0 20 40 60 80 100
0 100 200 0
20 40 60 80 100
0 100 200 300 400 500 600 700 800
0 20 40 60 80 100
0 100 200 300
0 20 40 60 80 100
0 100 200 300 400 500 600 700 800 900 1000 1100 1200 1300 1400 1500
% r e p lic a tio n Chr I 12% 31% 45% 66% 81% --30 14% 45 20% 60 27% 90 32% 120 35% 150 time (min) WT isw2 nhp10
% total genomic replication Supplementary Figure 2
Chr. Coordinate Chr II % r e p lic a tio n Chr. Coordinate Chr III Chr IV % r e p lic a tio n Chr. Coordinate % r e p lic a tio n Chr. Coordinate WT WT WT WT
isw2 nhp10 isw2 nhp10
isw2 nhp10 isw2 nhp10 0 20 40 60 80 100
0 100 200 300 400 500
0 20 40 60 80 100
0 100 200 300 400 500
0 20 40 60 80 100
0 100 200
0 20 40 60 80 100
0 100 200
0 20 40 60 80 100
0 100 200 300 400 500 600 700 800 900 1000
0 20 40 60 80 100
0 100 200 300 400 500 0
20 40 60 80 100
0 100 200 300 400
0 20 40 60 80 100
0 100 200 300 400 500 600 700
0 20 40 60 80 100
0 100 200 300 400 500 600 700 800 900 1000
0 20 40 60 80 100
0 100 200 300 400 500 0
20 40 60 80 100
0 100 200 300 400
0 20 40 60 80 100
0 100 200 300 400 500 600 700
%
r
e
p
lic
a
tio
n
Chr VI
Supplementary Figure 2
Chr. Coordinate
Chr VIII
%
r
e
p
lic
a
tio
n
Chr. Coordinate
Chr IX
Chr X
%
r
e
p
lic
a
tio
n
Chr. Coordinate
%
r
e
p
lic
a
tio
n
Chr. Coordinate
WT WT
WT WT
isw2 nhp10
isw2 nhp10 isw2 nhp10
isw2 nhp10
Chr VII
%
r
e
p
lic
a
tio
n
Chr. Coordinate
12%
31% 45% 66% 81%
--30
14% 45
20% 60
27% 90
32% 120
35% 150
time
(min) WT
isw2 nhp10
% total genomic replication
%
r
e
p
lic
a
tio
n
Chr XI
Supplementary Figure 2
Chr. Coordinate
Chr XII
%
r
e
p
lic
a
tio
n
Chr. Coordinate
Chr XIII
%
r
e
p
lic
a
tio
n
Chr. Coordinate WT
WT
WT
isw2 nhp10
isw2 nhp10
isw2 nhp10
0 20 40 60 80 100
0 100 200 300 400 500 600
0 20 40 60 80 100
0 100 200 300 400 500 600 700 800 900 1000
0 20 40 60 80 100
0 100 200 300 400 500 600 700 800 900
0 20 40 60 80 100
0 100 200 300 400 500 600
0 20 40 60 80 100
0 100 200 300 400 500 600 700 800 900 1000
0 20 40 60 80 100
0 100 200 300 400 500 600 700 800 900
12%
31% 45% 66% 81%
--30
14% 45
20% 60
27% 90
32% 120
35% 150
time
(min) WT
isw2 nhp10
% total genomic replication
%
r
e
p
lic
a
tio
n
Chr XIV
Supplementary Figure 2
Chr. Coordinate
Chr XV
%
r
e
p
lic
a
tio
n
Chr. Coordinate
Chr XVI
%
r
e
p
lic
a
tio
n
Chr. Coordinate WT
WT
WT
isw2 nhp10
isw2 nhp10
isw2 nhp10
0 20 40 60 80 100
0 100 200 300 400 500 600 700
0 20 40 60 80 100
0 100 200 300 400 500 600 700 800 900
0 20 40 60 80 100
0 100 200 300 400 500 600 700 800 900 1000
0 20 40 60 80 100
0 100 200 300 400 500 600 700
0 20 40 60 80 100
0 100 200 300 400 500 600 700 800 900 1000
0 20 40 60 80 100
0 100 200 300 400 500 600 700 800 900
12%
31% 45% 66% 81%
--30
14% 45
20% 60
27% 90
32% 120
35% 150
time
(min) WT
isw2 nhp10
% total genomic replication
WT
isw2 nhp10
WT
isw2 nhp10
A
R
S
6
0
7
(e
a
rl
y)
A
R
S
6
0
3
(l
a
te
)
Bubble arc (active origin)
1n
Y arc
a d
WT
isw2 nhp10
WT
isw2 nhp10
A
R
S
1
(e
a
rl
y-m
id
)
A
R
S
1
5
0
2
(l
a
te
)
Time post G1
release (+MMS): 30 60 90 120
Supplementary Figure 3. Patterns of origin firing in isw2 nhp10 mutants.
(a) Origin firing during MMS treatment. The bubble arc is detected when an origin of replication is active in the probed restriction fragment. The ascending portion of the Y arcs (“a”; diagrammed on the right) arises when the probed region is replicated from forks originating outside of the restriction fragment, while the descending portion (“d”) can result from both passive replication and large replication bubbles from an active origin within the fragment. Genomic DNA for 2-D electrophoresis was isolated from WT (YTT1831) and isw2 nhp10 (YTT3306) cells treated as in Supplementary Figure 2a. ARS607 is an early origin, ARS1 is an early-middle origin, while ARS1502 and ARS603 initiate later in S phase. The grey arrows indicate faint bubble arcs at ARS603 and ARS1502. Equivalent amounts of DNA were loaded as indicated by the intensity of 1N signals. See Supplementary Methods for the protocol.
(b), 2-D gel analysis of late origin firing in the absence of MMS treatment. Genomic DNA for 2-D electrophoresis was isolated from strains undergoing S phase in the absence of MMS.
A
R
S
15
02
(la
te
)
WT
WT
isw2 nhp10
A
R
S
6
0
3
(la
te
)
b
a
isw2 nhp10 S-phase
0 20 40 60 80 100
0 50 100 150 200 250 300 350 400
ARS607 DPB4 % budded
Time (min)
% replication
0 20 40 60 80 100
0 50 100 150 200 250 300 350 400
ARS607 DPB4
% budded
Time (min)
% replication
a
WT
isw2 nhp10
0
15
30
45
60
75
90
105
120
135
150
180
210
240
300
360 Time
(min) 0
15
30
45
60
75
90
105
120
135
150
165
180
195
210
240
WT
isw2 nhp10
b
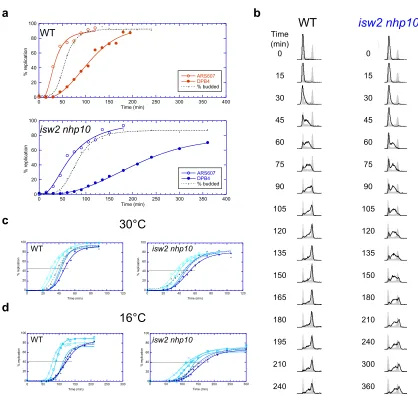
Supplementary Figure 4. Fork progression analyses.
(a) Comparison of replication kinetics of early and late-replicating loci during MMS treatment. Percent replication at an early-replicating locus, ARS607 (open circles), and a locus in a late-replicating region of Chromosome IV, DPB4 (Chromosome coordinate 694 kb, filled circles), was determined for each sample isolated in (b) as described in Methods. The percentage of budded cells is indicated by the dashed line.
(b) FACS analysis of ARS608/ARS609 double deletion strains collected for fork progression-rate determination. Wild type (YTT3528) and isw2 nhp10 (YTT3531) cells were treated as outlined in Supplementary Figure 2a and collected for FACS analysis and isolation of genomic DNA at the indicated times after release from α-factor arrest.
(c) Replication kinetics of the right arm of Chromosome VI at 30°C. Wild type and isw2 nhp10 cells, as in (b), were treated as in Supplemental Figure 2c except that MMS was omitted. Percent replication of regions 1-5 on chromosome VI, designated by blue lines of increasing intensity (as diagrammed in Figure 3a), was determined as described in Methods. The percentage of budded cells is indicated by the dashed line. The horizontal dotted line corresponds to the percent replication value designated as one-half of the maximum obtained for that experiment. The point of intersection of the horizontal dotted line with the fitted curve is designated as the Trep for that region.
(d) Replication kinetics of the right arm of Chromosome VI at 16°C. As described in (c).
0 20 40 60 80 100
0 20 40 60 80 100 120
% replication
Time (min)
0 20 40 60 80 100
0 20 40 60 80 100 120
% replication
Time (min)
0 20 40 60 80 100
0 50 100 150 200 250 300
% replication
Time (min) 0
20 40 60 80 100
0 50 100 150 200 250 300
% replication
Time (min) WT
WT
isw2 nhp10
isw2 nhp10
c
30°C
16°C
a
isw2 vs.
isw2 nhp10
nhp10 vs.
isw2 nhp10
Genes w/ 1.5 -fold
change
Genes w/ 1.5 -fold
change
isw2 nhp10
specific changes
b
1) Grow cells to early log-phase
2) Split culture
Untreated 0.02% MMS
3a) Harvest 2 hours
300C
3b) Harvest
c
Supplementary Figure 5. Summary of gene-expression analysis of MMS-treated isw2 nhp10 mutants.
(a) MMS treatment and culture conditions. isw2 (YTT1080), nhp10 (YTT2060), and isw2 nhp10 (YTT2109) strains were treated as shown before isolation of RNA.
(b) Definition of isw2 nhp10 specific changes in gene-expression. Transcript levels in an isw2 nhp10 mutant were compared to transcript levels from either isw2 (blue) or nhp10 (orange) by co-hybridizing labeled mRNA samples from the single and double mutant on the same microarray (indicated at the top of the diagram). Changes in transcript levels specific to the double mutant were defined as those common to both co-hybridization experiments.
(c) Scatterplot of gene expression levels for MMS treated isw2 or nhp10 single mutants versus the expression levels of MMS treated isw2 nhp10 double mutants. The black data points correspond to 206 genes involved in replication, repair, or the DNA damage checkpoint. Blue lines mark 1.5-fold changes in gene expression. This gene list was compiled based on descriptions provided at the Saccharomyces Genome Database.
X-axis: JAV108 : MMS nhp10 v MMS isw2 nhp10 (w original JAV53.4 data) (Default Interpr... Y-axis: JAV108 : MMS nhp10 v MMS isw2 nhp10 (w original JAV53.4 data) (Default Interpr...
Colored by: JAV108 : MMS nhp10 v MMS isw2 nhp10 (w original JAV53.4 data) (Default I... Gene List: all genes (6458), 195 genes selected
0.01 0.1 1 10 100 1000 1e4
0.01 0.1 1 10 100 1000 1e4
nhp10v isw2 nhp10 (control)
X-axis: JAV108 : MMS isw2 v MMS isw2 nhp10 (3 replicates) (Default Interpretation), isw2 v is... Y-axis: JAV108 : MMS isw2 v MMS isw2 nhp10 (3 replicates) (Default Interpretation), isw2 v is...
Colored by: JAV108 : MMS isw2 v MMS isw2 nhp10 (3 replicates) (Default Interpretation) Gene List: all genes (6458), 195 genes selected
0.01 0.1 1 10 100 1000 1e4
0.01 0.1 1 10 100 1000 1e4
isw2 v isw2 nhp10 (MMS) (control)
log expression level
nhp10
log expression level
isw2 nhp10
log expression level
isw2
log expression level
isw2 nhp10
10 100 1000 10000 101 100 1000 10000
0
1
0
0
1
0
0
0
1
0
0
0
0
1
0
1
0
0
1
0
0
0
1
0
0
0