Volume 20 Number 6 pp. 533–540 C The Author(s) 2017 doi:10.1017/thg.2017.54
Genetic and Environmental Relationships Between
Depressive and Anxiety Symptoms and
Cardiovascular Risk Estimates Among Korean
Twins and Families
Yun-Mi Song,1Joohon Sung,2and Kayoung Lee3
1Department of Family Medicine, Samsung Medical Center, Sungkyunkwan University School of Medicine, Seoul, South Korea
2Department of Epidemiology, School of Public Health and Institute of Health and Environment, Seoul National University, Seoul, South Korea
3Department of Family Medicine, Busan Paik Hospital, Inje University College of Medicine, Busan, South Korea
We aimed to assess shared genetic correlations of depressive and anxiety symptoms with concurrent and future estimated cardiovascular risk (CVR) score in Korean twins and family members. For the relationship with Adult Treatment Panel III CVR estimate in subjects aged 30–74 years (n=1,059, baseline and follow-up after 3.2±1.2 years), Center for Epidemiological Studies Depression Scale (CES-D) and state and trait anxiety inventory (SAI and TAI) were measured at baseline. A mixed linear model for CVR scores at baseline and follow-up was applied to include depressive and anxiety symptoms, twin and family effects, income, education, alcohol use, exercise, body mass index, and baseline CVR score for follow-up analysis. Higher CES-D scores were associated with higher CVR score at baseline in men, while higher TAI score was asso-ciated with higher CVR score at follow-up in women. Heritabilities were 0.245∼0.326 for CVR score, 0.320 for CES-D score, 0.367 for TAI score, and 0.482 for SAI score. There were significant common genetic cor-relations in the cor-relationships of CES-D, TAI, and SAI scores with CVR scores at baseline and follow-up (after adjusting for baseline CV risk score). Shared common environmental correlations were observed in the rela-tionships of CES-D and SAI scores with CVR score at baseline; and SAI score with CVR score at follow-up. In the within-monozygotic twin analysis, there were no associations between CES-D, TAI, and SAI scores, and CVR score. In conclusion, shared genetic and environmental influences were observed in the relationship between depressive and anxiety symptoms with concurrent and future CVR estimates.
Keywords:depressive symptoms, anxiety symptoms, cardiovascular risk estimate, genetic correlation, environmental correlation
Psychological distress, such as depressive and anxiety symp-toms, has been associated with higher risk of coronary heart disease (CHD)-, stroke-, and cardiovascular disease (CVD)-related mortality (Batelaan et al.,2016; de Miranda Azevedo et al., 2014; Moise et al., 2016; Rutledge et al.,
2009; Salaycik et al., 2007; Shen et al., 2008; Ye et al.,
2013), as well as with individual cardiovascular (CV) risk factors (Castaneda et al., 2016; Lopez-Leon et al., 2010; Scherrer et al.,2003). Potential biological mechanisms to explain these relationships have been proposed, includ-ing altered hypothalamic-pituitary-adrenal axis function, circadian rhythms, inflammation, platelet activation, im-balance of neurotransmitters, health behaviors, or side ef-fects of pharmacological treatment of depression (Amare et al., 2017; Carney et al.,1995; McCaffery et al., 2006).
In addition, in meta-analysis studies of genetic epidemi-ology, a strong genetic influence was found for major de-pression (Sullivan et al.,2000), and significant familial ag-gregation was demonstrated for panic disorder, general-ized anxiety disorder, phobias, and obsessive-compulsive disorder (Hettema et al., 2001). In a systemic review of genome-wide and candidate gene studies, 24 potential
received 27 February 2017; accepted 28 August 2017. First published online 5 October 2017.
Yun-Mi Song, Joohon Sung and Kayoung Lee
pleiotroic genes and relevant pathways for the shared bi-ological mechanisms explained the associations between cardiometabolic diseases risk and mood disorders (Amare et al.,2017).
These studies support how genetic factors contribute to depressive and anxiety symptoms and CV risk factors, and that shared genetic factors in the associations between these traits could be a plausible mechanism (Amare et al.,2017; Hettema et al.,2001; Lopez-Leon et al.,2010; McCaffery et al.,2006; Sullivan et al.,2000). Despite this evidence, the research on the role of shared genetic relationships in the association between depressive and anxiety symptoms, and CV risk is limited. In a study of the genetic correlation of de-pression symptoms with hypertension and heart disease in 2,731 male twins from the Vietnam Era Twin Registry (age 41.9±2.7 years; non-Hispanic white, 94.6%), the genetic correlations were 0.19 between depression symptoms and hypertension and 0.42 between depression symptoms and heart disease, while there were no significant environmen-tal correlations between these traits (Scherrer et al.,2003). In the 2,383 individuals from the Erasmus Rucphen Fam-ily study (age 48.7±15.1 years; men, 43.1%), a genetically isolated population in the Netherlands, the genetic corre-lations were 0.25–0.31 between scales of depressive symp-toms and lipid levels and environmental correlations be-tween these traits were−0.15∼−0.16 after adjusting for age, sex, use of medication, and degree of consanguinity and sibship effects (Lopez-Leon et al.,2010).
However, to the best of our knowledge, there are no pub-lished studies on the shared genetic influence between de-pressive and anxiety symptoms and estimated CV risk. In the current study, we aimed to assess shared genetic cor-relations of depressive and anxiety symptoms at a base-line visit with estimated CV risk score at the basebase-line and follow-up visits among Korean twins and their family mem-bers enrolled in the Healthy Twin study. We used the Adult Treatment Panel III risk estimate, the most commonly used CHD risk score (Expert Panel on Detection, Evaluation, and Treatment of High Blood Cholesterol in Adults,2001) to estimate risk for an individual of having a ‘hard’ CHD (myocardial infarction or CHD death).
Materials and Methods
Study PopulationThe study subjects were participants in the Healthy Twin study, a multi-center cohort study established in 2005 for South Korean adult (>30 years of age), same-sex twins and their first-degree adult family members (Gombojav et al.,
2013; Sung et al.,2006). Of the total 3,479 study partici-pants, the trait measurement records for 1,991 individuals at baseline (monozygotic twin individuals, 706; men, 995; women, 996; age 44.4±11.0 years) and 1,059 individuals at follow-up (monozygotic twin individuals, 451; men, 517; women, 542; age 47.2±10.4 years) who were aged from 34
to 74 years and had complete assessment data for depressive and anxiety symptoms were used for the relationship with 10-year CV risk. The rate of recruitment success rate was 53.2%. The interval between baseline and follow-up visits was 3.2±1.2 years. This study was carried out in accor-dance with the Declaration of Helsinki. Informed consent along with conflict of interest disclosure was obtained from the study participants. All study procedures were approved by the respective institutional review boards of the partici-pating institutions.
Measurements of the Depressive and Anxiety Symptoms
The assessment of measures in the Healthy Twin study has been described in detail elsewhere (Gombojav et al.,
2013; Sung et al.,2006). Depressive and anxiety symptoms at baseline visit were assessed using scales included in a self-administered questionnaire. Depressive symptoms in the past week were assessed with a scale that used the 20-item Center for Epidemiological Studies Depression Scale (CES-D; Radloff, 1977), which was translated to Korean (Chon et al.,2001). For the CES-D, participants were asked how often they have felt each of the feelings listed below during the past week. Each item was scored as 0 (rarely or none of the time,<1 day), 1 (some or a little of the time, 1–2 days), 2 (occasionally or a moderate amount of the time, 3–4 days), or 3 (most or all of the time, 5–7 days). Anxiety symptoms were assessed using the State-Trait Anxiety In-ventory (STAI) developed by Spielberger et al. (1970). We used the Korean version of STAI adapted by Kim (1978). Each section consists of 20 questions, totaling 40 questions. The State Anxiety Inventory scale (SAI) reflects fluctuat-ing emotional state and severity, which depends on the sit-uation and time, while the Trait Anxiety Inventory scale (TAI) evaluates a constant behavioral tendency. Each mea-sure is validated as a predictor of objective health outcomes in cardiac populations (Shibeshi et al.,2007; Wassertheil-Smoller et al.,2004). In the present sample, internal consis-tency value (Cronbach’sα) was 0.89 for the CES-D, 0.89 for the TAI, and 0.92 for the SAI.
Measurement of Cardiovascular Risk Estimate and Covariates
CV risk was estimated at baseline and follow-up visits using the Adult Treatment Panel III risk estimate (Expert Panel on Detection, Evaluation, and Treatment of High Blood Cholesterol in Adults,2001). This risk estimate is based on a modified Framingham risk model for predicting an indi-vidual’s risk for developing CVD over the next 10 years in those aged 30–74 years, and includes age, total cholesterol, high density lipoprotein cholesterol (HDL-C), systolic blood pressure, and smoking status as components (Expert Panel on Detection, Evaluation, and Treatment of High Blood Cholesterol in Adults,2001). Smoking status (current
534
TWIN RESEARCH AND HUMAN GENETICShttps://www.cambridge.org/core/terms. https://doi.org/10.1017/thg.2017.54
smoker vs. non-current smoker) was assessed using a self-reported questionnaire. Other components of CV risk esti-mates were measured for participants who fasted overnight for at least 12 hours. Blood pressure was assessed manually using a standard mercury sphygmomanometer under standardized conditions. The levels of total cholesterol and HDL-C (measured using an enzymatic or homoge-neous assay) were measured using ADVIA 1650 (Siemens, Germany) or Hitachi 7600-210/Hitachi 7180 (Hitachi, Tokyo, Japan) equipment. The analyses were conducted in a central laboratory authorized by the Korean Association of Quality Control for Clinical Laboratory Examination.
The covariates considered were baseline measurements such as body mass index (BMI), educational attainment (< graduated high school, graduated high school, or > graduated high school), income level (<2×10⁶won vs.≥2 ×10⁶won), alcohol consumption (current user vs. current
non-user), and exercise (yes vs. no to engaging in regular moderate to high-intensity exercise). BMI was calculated as measured weight (kg) divided by measured height squared (m2) using a digital balance (Tanita Co., Seoul, Korea)
and stadiometer (Samwha Co., Seoul, Korea), respectively. Self-reported questionnaires were used to assess other covariates.
Statistical Analysis
Chi-square tests or t-tests were conducted to assess dif-ferences in the characteristics between those included in the follow-up analysis and those who were excluded in the follow-up analysis. The absolute 10-year CV risk and CV risk scores at baseline and follow-up, and the CES-D, TAI, and SAI scores at baseline between men and women were compared usingt-tests. Spearman correlations were applied to the relationships among the CES-D, TAI, and SAI scores. Mixed linear models were used to determine the associa-tions of the CV risk score at baseline and follow-up with the CES-D, TAI, and SAI scores, BMI, socioeconomic sta-tus, and health behaviors at baseline. Due to skewed dis-tribution of absolute 10-year CV risk, the CV risk score was used for these relationships. In this model, the corre-lation structures from family and twin recorre-lationships were included as random effects, and the CES-D, TAI, and SAI scores, and other characteristics (e.g., education, income, BMI, alcohol consumption, exercise, and the CV risk score at baseline for the follow-up analysis) were included as fixed effects. The analyses were conducted in all subjects as well as separately for men and women on the basis of previous findings of sex-specific associations between psychosocial distress and CVD development (Haukkala et al.,2009). To evaluate whether the associations of the CES-D, TAI, and SAI scores with the CV risk score were not related to ge-netic and shared familial factors, a co-twin control analy-sis in pairs of monozygotic twins was conducted. The risk for having a higher CV risk score at baseline and follow-up between monozygotic twin pairs was assessed using
condi-tional logistic regression analysis for the CES-D, TAI, and SAI scores, education, income, BMI, alcohol consumption, exercise, and the baseline CV risk score (in the analysis for follow-up CV risk score). Apvalue<.05 was considered statistically significant. Data were analyzed using IBM Sta-tistical Package for the Social Sciences (SPSS) software ver-sion 23 (IBM Corp., Armonk, NY, USA).
The genetic analysis was conducted using the Sequen-tial Oligogenic Linkage Analysis Routines (SOLAR) pack-age (http://solar.sfbrgenetics.org, version 6.6.2). Heritabil-ities were calculated for the CES-D, TAI, and SAI scores, and the CV risk score and its components (i.e., total choles-terol, systolic blood pressure, and HDL-C) at baseline and follow-up. Heritabilities were calculated as the proportion of phenotypic variance explained by additive genetic effects. To find any evidence of common genetic and environmen-tal regulation between the CES-D, TAI, and SAI scores, and the CV risk score with its components (baseline and follow-up), we partitioned the phenotypic correlations into cor-relations explained by genetic sharing (ρG) and
environ-mental sharing (ρE). Regarding the bivariate analysis for
the CV risk score and its components at follow-up, we ad-justed for baseline value for each trait. IfρGorρE
signifi-cantly deviated from zero, we regarded it as evidence of a ge-netic or environmental association between the two traits, respectively.
Results
Characteristics of Subjects
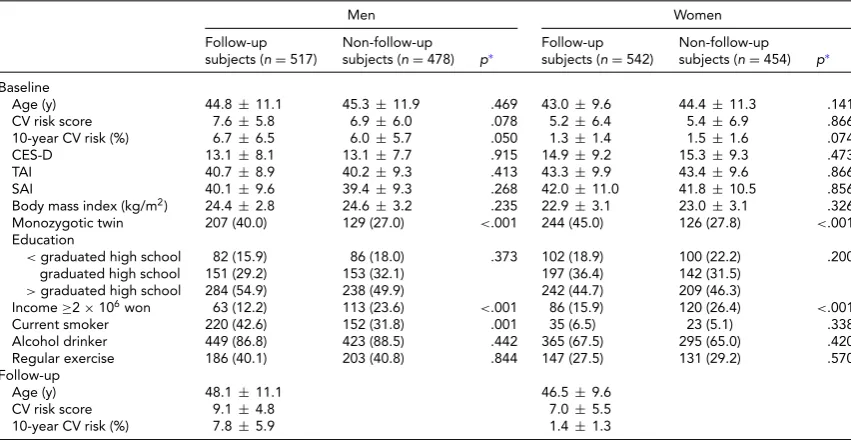
The 10-year CV risk, the CV risk score, the CES-D, TAI, and SAI scores, age, BMI, education, alcohol use, exer-cise at baseline in men and women who were included in the follow-up analysis were not significantly different from those characteristics in excluded subjects in the follow-up analysis. However, there were more monozygotic twins in the included subjects in the follow-up analysis compared to the excluded subjects (Table 1). Men were more likely to have higher CV risk scores, while also having lower CES-D, TAI, and SAI scores compared to women at baseline and follow-up (p<.01).
Relationships of CV Risk Score with Depression and Anxiety Symptoms and Other Characteristics
The correlation coefficients were 0.69 for the relationship between the CES-D and the TAI scores, 0.63 for the rela-tionship between the CES-D and the SAI scores, and 0.79 for the relationship between the SAI and the TAI scores in all subjects at baseline (allp<.001).
Yun-Mi Song, Joohon Sung and Kayoung Lee
TABLE 1
Comparison of Characteristics by Sex and Follow-Up Status in Subjects Who Did Not Have a History of Stroke and Coronary Heart Diseases at Baseline
Men Women
Follow-up subjects (n=517)
Non-follow-up
subjects (n=478) p∗ Follow-upsubjects (n=542) Non-follow-upsubjects (n=454) p∗ Baseline
Age (y) 44.8±11.1 45.3±11.9 .469 43.0±9.6 44.4±11.3 .141 CV risk score 7.6±5.8 6.9±6.0 .078 5.2±6.4 5.4±6.9 .866 10-year CV risk (%) 6.7±6.5 6.0±5.7 .050 1.3±1.4 1.5±1.6 .074
CES-D 13.1±8.1 13.1±7.7 .915 14.9±9.2 15.3±9.3 .473
TAI 40.7±8.9 40.2±9.3 .413 43.3±9.9 43.4±9.6 .866
SAI 40.1±9.6 39.4±9.3 .268 42.0±11.0 41.8±10.5 .856
Body mass index (kg/m2) 24.4±2.8 24.6±3.2 .235 22.9±3.1 23.0±3.1 .326
Monozygotic twin 207 (40.0) 129 (27.0) <.001 244 (45.0) 126 (27.8) <.001 Education
<graduated high school 82 (15.9) 86 (18.0) .373 102 (18.9) 100 (22.2) .200 graduated high school 151 (29.2) 153 (32.1) 197 (36.4) 142 (31.5)
>graduated high school 284 (54.9) 238 (49.9) 242 (44.7) 209 (46.3)
Income≥2×10⁶won 63 (12.2) 113 (23.6) <.001 86 (15.9) 120 (26.4) <.001
Current smoker 220 (42.6) 152 (31.8) .001 35 (6.5) 23 (5.1) .338 Alcohol drinker 449 (86.8) 423 (88.5) .442 365 (67.5) 295 (65.0) .420 Regular exercise 186 (40.1) 203 (40.8) .844 147 (27.5) 131 (29.2) .570 Follow-up
Age (y) 48.1±11.1 46.5±9.6
CV risk score 9.1±4.8 7.0±5.5
10-year CV risk (%) 7.8±5.9 1.4±1.3
Note: Values represent mean±SDorn(%). CV=cardiovascular; CES-D=Center for Epidemiological Studies Depression scale score; TAI= Trait Anxiety Inventory score; SAI=State Anxiety Inventory score.
∗Usingt-test or chi-square test.
higher CV risk scores at follow-up in women. There were differential associations of the CV risk score with BMI, ed-ucation, income, alcohol use, and exercise according to sex and time.
Heritability, Bivariate Analysis, and Co-Twin Control Analysis
Heritability estimates were 0.245∼0.326 for the CV risk scores, 0.320 for the CES-D score, 0.367 for the TAI score, and 0.482 for the SAI score. Bivariate analysis resulted in significant common genetic correlations in the relation-ships of the CES-D, TAI, and SAI scores with the CV risk score at baseline and follow-up (after adjusting for baseline CV risk score). Shared common environmental correlations were observed in the relationships of the CES-D and SAI scores with the CV risk score at baseline; the SAI score with the CV risk score at follow-up (Table 3).
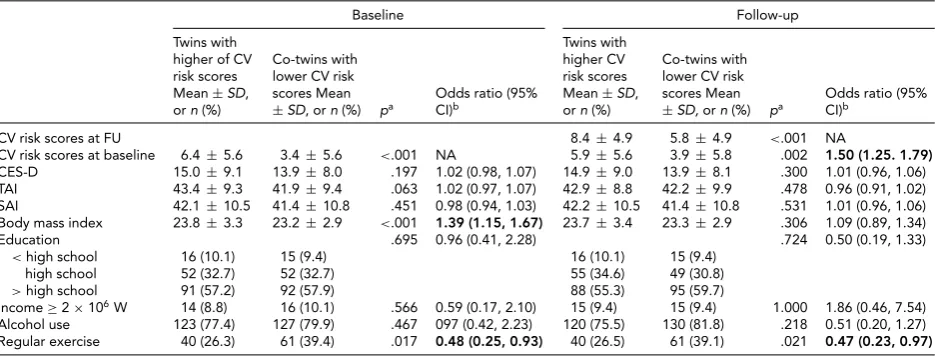
In the multivariate conditional logistic analysis for within-monozygotic twin pairs to assess non-shared envi-ronmental factors, there were no significant associations of the CES-D, TAI, and SAI scores with the CV risk score at baseline and follow-up. Monozygotic twins with higher CV risk scores at baseline were 1.39 times more likely to have higher BMI compared to their co-twin pairs with lower CV risk scores at baseline. Monozygotic twins with higher CV risk scores at baseline or follow-up were respectively 52% and 53% less likely to exercise regularly compared to their co-twin pairs with lower CV risk scores at baseline or follow-up (Table 4).
Discussion
In the Korean twins and their family members who did not have history of CVD, we found a positive association between depressive symptoms and concurrently estimated CV risk scores in men but not in women after adjusting for anxiety symptoms, BMI, education, income, alcohol use, and exercise habit. In addition, there was a positive as-sociation between TAI scores and future CV risk scores in women after adjusting for baseline CV risk scores, de-pressive symptoms, SAI scores, BMI, education, income, alcohol use, and exercise. Despite these less consistent re-lationships according to sex, scales of anxiety assessment, and assessment time, current findings could be interpreted that increased depressive or anxiety symptoms could oc-cur with higher CV risk estimates and predict higher CV risk estimates in the future. The observation would support previous knowledge about the associations between depres-sive and anxiety symptoms and CVD and CV risk factors (Batelaan et al.,2016; Castaneda et al.,2016; de Miranda Azevedo et al.,2014; Lopez-Leon et al.,2010; Moise et al.,
2016; Rutledge et al.,2009; Salaycik et al.,2007; Scherrer et al.,2003; Shen et al.,2008; Ye et al.,2013).
Despite evidence that depressive and anxiety symptoms and CVD are heritable, the research for common genetic influence on the associations between these traits is very limited. In genetic studies for depressive and anxiety symp-toms including self-reported questionnaires, CVD, and CV risk factors, the estimated heritability was moderate to high (Amare et al., 2017; Carney et al., 1995; Hettema et al.,
536
TWIN RESEARCH AND HUMAN GENETICShttps://www.cambridge.org/core/terms. https://doi.org/10.1017/thg.2017.54
Depr
essive
and
A
nxiety
S
ymptoms
a
nd
CV
Risk
Scor
es
TABLE 2
The Associations of the Cardiovascular Risk Score at Baseline and Follow-Up With the CES-D, TAI, and SAI scores, BMI, Socioeconomic Status, and Health Behaviors (n=1,059)
Baseline Follow-up
Overall (n=1059) Men (n=517) Women (n=542) Overall (n=1059) Men (n=517) Women (n=542)
Baseline CV risk score (per 1 score) NA NA NA 0.73 (0.70, 0.75) 0.72 (0.68, 0.75) 0.71 (0.67, 0.76)
CES-D (per 1 score) 0.06 (0.01, 0.12) 0.09 (0.01, 0.18) 0.03 (−0.03, 0.10) −0.01 (−0.03, 0.02) 0.03 (−0.01, 0.06) −0.03 (−0.06, 0.01)
TAI (per 1 score) −0.05 (-0.11, -0.01) −0.08 (−0.17, 0.02) −0.02 (−0.10, 0.06) 0.02 (−0.01, 0.05) −0.02 (−0.04, 0.04) 0.04 (0.01, 0.08)
SAI (per 1 score) 0.03 (−0.02, 0.08) 0.01 (−0.08, 0.08) 0.05 (−0.02, 0.11) 0.01 (−0.02, 0.03) 0.01 (−0.03, 0.04) 0.01 (−0.03, 0.04)
BMI (per 1 kg/m2) 0.49 (0.40, 0.57) 0.24 (0.03, 0.36) 0.47 (0.36, 0.57) 0.11 (0.07, 0.15) 0.13 (0.07, 0.18) 0.09 (0.04, 0.15)
Higher education −2.73 (−3.16,−2.30) −2.38 (−3.12,−1.84) −3.34 (−3.90,−2.78) −0.20 (−0.41, 0.02) −0.10 (−0.39, 0.18) −0.36 (-0.69,-0.03)
Higher income 0.65 (−0.29, 1.59) 0.47 (−0.97, 1.91) 1.24 (0.04, 2.43) −0.94 (−1.39,−0.50) −1.01 (−1.65,−0.38) −0.78 (−1.41,-0.14)
Alcohol use −0.26 (−1.01, 0.49) −0.10 (−1.44, 1.24) −1.27 (−2.20,−0.34) 0.15 (−0.21, 0.50) 0.39 (−0.16, 0.95) −0.03 (−0.52, 0.47)
Regular exercise 0.46 (−0.21, 1.14) −0.06 (−1.00, 0.89) 0.41 (−0.54, 1.35) 0.07 (−0.25, 0.39) −0.24 (−0.66, 0.17) 0.38 (−0.11, 0.88)
Note: Bold type represents significant coefficients. CES-D=Center for Epidemiological Studies Depression scale score; TAI=Trait Anxiety Inventory score; SAI=State Anxiety Inventory score; BMI=body mass index; NA=not applicable.
Values were estimated coefficients (95% confidence interval) using a mixed linear model including random effects (twin and family effects) and fixed effects (baseline CV risk in the analysis for follow-up CV risk, CES-D, TAI, SAI, alcohol use, exercise, BMI, education, and income).
TABLE 3
Heritability and Genetic and Environmental Correlations for the Relationships of CES-D, TAI, and SAI Scores With the CV Risk Score With Its Components (n=1,059)
CES-D TAI SAI
h2 ρP ρG (SE) ρE (SE) ρP ρG (SE) ρE (SE) ρP ρG (SE) ρE (SE)
Baseline
Total cholesterol 0.200 (0.051)∗ 0.076∗ −0.161(0.113)∗ 0.235 (0.060)∗ 0.368∗ 0.190 (0.133) 0.445 (0.044)∗ 0.311 0.030 (0.119) 0.488 (0.045)∗
SBP 0.221 (0.060)∗ 0.085∗ −0.120 (0.132) 0.192 (0.059)∗ 0.137∗ 0.024 (0.153) 0.183 (0.053)∗ 0.071∗ 0.013 (0.099) 0.121 (0.062)
HDL 0.338 (0.064)∗ 0.014 0.190 (0.134) −0.076 (0.062) 0.169∗ 0.258 (0.131) 0.137 (0.060)∗ 0.001 0.154 (0.111) -0.109 (0.064)
CV risk score 0.245 (0.058)∗ 0.273∗ 0.465 (0.132)∗ 0.208 (0.056)∗ 0.153∗ 0.544 (0.134)∗ −0.021 (0.060) 0.250∗ 0.493 (0.107)∗ 0.139 (0.058)∗ Follow-upa
Total cholesterol 0.292 (0.055)∗ 0.019 −0.054 (0.139) 0.055 (0.064) 0.189∗ 0.015 (0.138) 0.293 (0.064)∗ −0.007 −0.088 (0.106) 0.056 (0.068)
SBP 0.251 (0.058)∗ 0.095∗ 0.133 (0.134) 0.083 (0.052) 0.068∗ 0.170 (0.128) 0.018 (0.059) 0.036 0.052 (0.092) 0.025 (0.063)
HDL 0.395 (0.071)∗ 0.017 0.034 (0.124) 0.008 (0.065) 0.012 0.202 (0.119) −0.120 (0.070) 0.021 0.020 (0.091) 0.023 (0.069)
CV risk score 0.326 (0.058)∗ 0.172∗ 0.606 (0.228)∗ 0.076 (0.056) 0.056 0.282 (0.129)∗ −0.044 (0.056) 0.202∗ 0.370 (0.108)∗ 0.123 (0.055)∗
CES-D 0.320 (0.061)∗
TAI 0.367 (0.049)∗
SAI 0.482 (0.060)∗
Note: CES-D=Center for Epidemiological Studies Depression scale score; TAI=Trait Anxiety Inventory score; SAI=State Anxiety Inventory score; SBP=systolic blood pressure; HDL=high density lipoprotein cholesterol; h2– heritability;ρP=common phenotypic correlation;ρG=common genetic correlation;ρE=common environmental correlation.
aadjusting for baseline value in bivariate analysis with each trait (i.e., sum of CV risk score at baseline for sum of CV risk at follow-up).
∗p<.05.
TWIN
RESEARCH
AND
H
UMAN
GENETICS
537
.
https://doi.org/10.1017/thg.2017.54
https://www.cambridge.org/core
. IP address:
118.70.13.36
, on
06 Sep 2020 at 05:27:55
Yun-Mi Song, Joohon Sung and Kayoung Lee
TABLE 4
Risk Estimation for Having Higher Cardiovascular (CV) Risk Scores at Baseline and Follow-Up: Co-Twin-Control Analysis in Monozygotic Twins (n=159 pairs)
Baseline Follow-up
Twins with higher of CV risk scores Mean±SD, orn(%)
Co-twins with lower CV risk scores Mean
±SD, orn(%) pa Odds ratio (95%CI)b
Twins with higher CV risk scores Mean±SD, orn(%)
Co-twins with lower CV risk scores Mean
±SD,orn(%) pa Odds ratio (95%CI)b
CV risk scores at FU 8.4±4.9 5.8±4.9 <.001 NA
CV risk scores at baseline 6.4±5.6 3.4±5.6 <.001 NA 5.9±5.6 3.9±5.8 .002 1.50 (1.25. 1.79) CES-D 15.0±9.1 13.9±8.0 .197 1.02 (0.98, 1.07) 14.9±9.0 13.9±8.1 .300 1.01 (0.96, 1.06) TAI 43.4±9.3 41.9±9.4 .063 1.02 (0.97, 1.07) 42.9±8.8 42.2±9.9 .478 0.96 (0.91, 1.02) SAI 42.1±10.5 41.4±10.8 .451 0.98 (0.94, 1.03) 42.2±10.5 41.4±10.8 .531 1.01 (0.96, 1.06) Body mass index 23.8±3.3 23.2±2.9 <.001 1.39 (1.15, 1.67) 23.7±3.4 23.3±2.9 .306 1.09 (0.89, 1.34)
Education .695 0.96 (0.41, 2.28) .724 0.50 (0.19, 1.33)
<high school 16 (10.1) 15 (9.4) 16 (10.1) 15 (9.4) high school 52 (32.7) 52 (32.7) 55 (34.6) 49 (30.8)
>high school 91 (57.2) 92 (57.9) 88 (55.3) 95 (59.7)
Income≥2×10⁶W 14 (8.8) 16 (10.1) .566 0.59 (0.17, 2.10) 15 (9.4) 15 (9.4) 1.000 1.86 (0.46, 7.54)
Alcohol use 123 (77.4) 127 (79.9) .467 097 (0.42, 2.23) 120 (75.5) 130 (81.8) .218 0.51 (0.20, 1.27) Regular exercise 40 (26.3) 61 (39.4) .017 0.48 (0.25, 0.93) 40 (26.5) 61 (39.1) .021 0.47 (0.23, 0.97)
Note: Bold type represents significant odds ratios.SD=standard deviation; CI=confidence interval; NA=not applicable.
aPairedt-test or conditional logistic regression analysis.bMultivariate conditional logistic regression analysis including the CES-D, TAI, and SAI scores,
body mass index, education level, income level, alcohol use, regular exercise, and CV risk score at baseline (in the analysis for follow-up CV risk score) as predicting variables.
2001; McCaffery et al.,2006; Silberg et al.,1990). The es-timated heritability in our study was in line with previ-ous findings. Furthermore, we observed shared genetic fac-tors between depressive and anxiety symptoms and CV risk estimate even after adjusting for baseline CV risk scores for the bivariate analysis with CV risk scores at follow-up. These findings could enhance the case for shared genetic vulnerability in the association between depressive or anx-iety symptoms and CVD or CV risk factors.
There are two studies regarding the genetic association between depressive symptoms and CVD or CV risk fac-tors. In a male twin study of the Vietnam Era Twin Reg-istry, the genetic correlation between depressive symptoms and hypertension was 0.19 and the genetic correlation be-tween depression and heart disease was 0.42 (Scherrer et al.,
2003). In the Erasmus Rucphen Family study, the genetic correlations between depressive symptoms (assessed using the CES-D scale and the Hospital Anxiety and Depression Scale) and serum lipid levels ranged from 0.25 to 0.31. In that study, the genetic correlations of depressive symptoms with blood pressure and serum glucose level were not sig-nificant (Lopez-Leon et al.,2010). While these two studies revealed evidence for a genetic connection between depres-sive symptoms and CV risk factors and concurrent heart disease, we did not find any study that demonstrated a ge-netic correlation between depressive or anxiety symptoms and estimated CV risk scores, a composite value of several CV risk factors. We also found that the genetic correlation with estimated CV risk scores were stronger than the ge-netic correlation with individual CV risk factors. Our re-sults, along with previous studies, support the possibility of the presence of pleiotropic (common) genes influencing the
concurrent as well as future associations between depressive and anxiety symptoms and CV risk estimates in middle-aged men and women. Our observations could be in line with an overlap of depression and CVD linkage signals that suggest the potential for common candidate genes related to inflammation or serotonin that contribute to both depres-sion and CVD (Lopez-Leon et al.,2010; McCaffery et al.,
2006). Further research is necessary to investigate genes in-volved in predicting future CVD in individuals with depres-sive or anxiety symptoms.
Of note, we found significant shared environmental cor-relations between depressive and anxiety symptoms and the CV risk score, whereas we did not observe non-shared en-vironmental factors in those relationships by the analysis of within-monozygotic twin pairs after adjusting for covari-ates. At least, those shared environmental factors may be explained by uncontrolled factors such as dietary habit of families. We also demonstrated the importance of educa-tion, BMI, and exercise as modifiable risk factors related to higher CV risk scores.
However, there are limitations that should be addressed. First, the assessment of depressive and anxiety symptoms was based on self-reported questionnaires. While these scales are validated tools for predicting CV outcomes (Shibeshi et al.,2007; Wassertheil-Smoller et al.,2004), the Korean version of these questionnaires has not been val-idated for predicting CV outcomes. Second, the tools for estimating 10-year CV risk may under- or overestimate observed CVD risk according to population characteris-tics (Lloyd-Jones et al.,2016). Based on a previous study, The Adult Treatment Panel III- based risk estimation may overestimate the risk of CHD in the Korean population
538
TWIN RESEARCH AND HUMAN GENETICShttps://www.cambridge.org/core/terms. https://doi.org/10.1017/thg.2017.54
(Jee et al.,2014). Third, the associations were not fully ad-justed for other potential confounding factors and therefore residual confounding factors may influence current associ-ations. Finally, the subjects may be more concerned with their health compared with the general population, and consequently, volunteer bias cannot be excluded. Neverthe-less, the current findings were compatible with established associations between depressive and anxiety symptoms and CV risk factors. Furthermore, the current findings could provide more evidence for the genetic correlations between those traits.
In conclusion, we found shared genetic and environmen-tal influences on the relationship of depressive and anxiety symptoms with concurrent and future CV risk estimates. Further studies are needed to better elucidate the genetic origin and pathway explaining the associations between the psychological distress and CVD development and outcome.
Acknowledgments
This study was supported by the 2016 Inje University Research grant. None of the authors have any conflicts of interest to report.
Ethical Standards
The authors assert that all procedures contributing to this work comply with the ethical standards of the relevant na-tional and instituna-tional committees on human experimen-tation and with the Helsinki Declaration of 1975, as revised in 2008.
References
Amare, A. T., Schubert, K. O., Klingler-Hoffmann, M., Cohen-Woods, S., & Baune, B. T. (2017). The genetic overlap be-tween mood disorders and cardiometabolic diseases: A sys-tematic review of genome wide and candidate gene studies. Translational Psychiatry, 7, e1007.
Batelaan, N. M., Seldenrijk, A., Bot, M., van Balkom, A. J., & Penninx, B. W. (2016). Anxiety and new onset of cardiovas-cular disease: Critical review and meta-analysis.The British Journal of Psychiatry, 208, 223–231.
Carney, R. M., Freedland, K. E., Rich, M. W., & Jaffe, A. S. (1995). Depression as a risk factor for cardiac events in established coronary heart disease: A review of possible mechanisms.Annals of Behavioral Medicine, 17, 142–149. Castaneda, S. F., Buelna, C., Giacinto, R. E., Gallo, L. C.,
Sotres-Alvarez, D., Gonzalez, P., … Talavera, G. A. (2016). Cardiovascular disease risk factors and psychological dis-tress among Hispanics/Latinos: The Hispanic Community Health Study/Study of Latinos (HCHS/SOL). Preventive Medicine, 87, 144–150.
Chon, K., Choi, S., & Yang, B. (2001). Integrated adaptation of CES - D in Korea.Korean Journal of Health Psychology, 6, 59–76.
de Miranda Azevedo, R., Roest, A. M., Hoen, P. W., & de Jonge, P. (2014). Cognitive/affective and somatic/affective symp-toms of depression in patients with heart disease and their association with cardiovascular prognosis: A meta-analysis. Psychological Medicine, 44, 2689–2703.
Expert Panel on Detection, Evaluation, and Treatment of High Blood Cholesterol in Adults. (2001). Executive summary of the third report of the National Cholesterol Education Pro-gram (NCEP) expert panel on detection, evaluation, and treatment of high blood cholesterol in adults (Adult Treat-ment Panel III).JAMA, 285, 2486–2497.
Gombojav, B., Song, Y. M., Lee, K., Yang, S., Kho, M., Hwang, Y. C., … Sung, J. (2013). The healthy twin study, Ko-rea updates: Resources for omics and genome epidemi-ology studies. Twin Research and Human Genetics, 16, 241–245.
Haukkala, A., Konttinen, H., Uutela, A., Kawachi, I., & Laatikainen, T. (2009). Gender differences in the associ-ations between depressive symptoms, cardiovascular dis-eases, and all-cause mortality.Annals of Epidemiology, 19, 623–629.
Hettema, J. M., Neale, M. C., & Kendler, K. S. (2001). A review and meta-analysis of the genetic epidemiology of anxiety disorders.The American Journal of Psychiatry, 158, 1568– 1578.
Jee, S. H., Jang, Y., Oh, D. J., Oh, B. H., Lee, S. H., Park, S. W., … Woodward, M. (2014). A coronary heart disease prediction model: The Korean Heart Study.BMJ Open, 4, e005025. Kim, J. T. (1978).The relationship between trait anxiety and
so-ciality. Unpublished masters thesis, Korea University Grad-uate School, Seoul, South Korea.
Lloyd-Jones, D. M., Huffman, M. D., Karmali, K. N., Sanghavi, D. M., Wright, J. S., Pelser, C., … Goff, D. C. Jr. (2016). Esti-mating longitudinal risks and benefits from cardiovascular preventive therapies among medicare patients: The million hearts longitudinal ASCVD risk assessment tool: A special report from the American Heart Association and American College of Cardiology.Circulation, 135, e793–e813. Lopez-Leon, S., Aulchenko, Y. S., Tiemeier, H., Oostra, B. A.,
van Duijn, C. M., & Janssens, A. C. (2010). Shared genetic factors in the co-occurrence of symptoms of depression and cardiovascular risk factors.Journal of Affective Disorders, 122, 247–252.
McCaffery, J. M., Frasure-Smith, N., Dube, M. P., Theroux, P., Rouleau, G. A., Duan, Q., & Lesperance, F. (2006). Com-mon genetic vulnerability to depressive symptoms and coronary artery disease: A review and development of can-didate genes related to inflammation and serotonin. Psycho-somatic Medicine, 68, 187–200.
Moise, N., Khodneva, Y., Richman, J., Shimbo, D., Kronish, I., & Safford, M. M. (2016). Elucidating the association be-tween depressive symptoms, coronary heart disease, and stroke in black and white adults: The Reasons for geo-graphic and racial differences in stroke (REGARDS) study. Journal of the American Heart Association, 5, e003767. Radloff, L. (1977). The CES-D scale: A self-report depression
Yun-Mi Song, Joohon Sung and Kayoung Lee
Rutledge, T., Linke, S. E., Krantz, D. S., Johnson, B. D., Bittner, V., Eastwood, J. A., … Merz, C. N. (2009). Co-morbid depression and anxiety symptoms as predictors of cardiovascular events: Results from the NHLBI-sponsored women’s ischemia syndrome evaluation (WISE) study. Psy-chosomatic Medicine, 71, 958–964.
Salaycik, K. J., Kelly-Hayes, M., Beiser, A., Nguyen, A. H., Brady, S. M., Kase, C. S., & Wolf, P. A. (2007). Depres-sive symptoms and risk of stroke: The Framingham Study. Stroke, 38, 16–21.
Scherrer, J. F., Xian, H., Bucholz, K. K., Eisen, S. A., Lyons, M. J., Goldberg, J., … True, W. R. (2003). A twin study of depression symptoms, hypertension, and heart disease in middle-aged men.Psychosomatic Medicine, 65, 548–557. Shen, B. J., Avivi, Y. E., Todaro, J. F., Spiro, A. 3rd, Laurenceau,
J. P., Ward, K. D., & Niaura, R. (2008). Anxiety characteris-tics independently and prospectively predict myocardial in-farction in men the unique contribution of anxiety among psychologic factors.Journal of the American College of Car-diology, 51, 113–119.
Shibeshi, W. A., Young-Xu, Y., & Blatt, C. M. (2007). Anxiety worsens prognosis in patients with coronary artery disease. Journal of the American College of Cardiology, 49, 2021– 2027.
Silberg, J. L., Heath, A. C., Kessler, R., Neale, M. C., Meyer, J. M., Eaves, L. J., & Kendler, K. S. (1990). Genetic and
en-vironmental effects on self-reported depressive symptoms in a general population twin sample.Journal of Psychiatric Research, 24, 197–212.
Spielberger, C. D., Gorsuch, R. L., Lushene, R. E. (1970). Man-ual for the state-trait anxiety inventory. Palo Alto, CA: Con-sulting Psychologists Press.
Sullivan, P. F., Neale, M. C., & Kendler, K. S. (2000). Ge-netic epidemiology of major depression: Review and meta-analysis.The American Journal of Psychiatry, 157, 1552– 1562.
Sung, J., Cho, S. I., Lee, K., Ha, M., Choi, E. Y., Choi, J. S., … Song, Y. M. (2006). Healthy Twin: A twin-family study of Korea-Protocols and current status.Twin Research and Hu-man Genetics, 9, 844–848.
Wassertheil-Smoller, S., Shumaker, S., Ockene, J., Talavera, G. A., Greenland, P., Cochrane, B., … Dunbar-Jacob, J. (2004). Depression and cardiovascular sequelae in post-menopausal women: The women’s health initiative (WHI). Archives of Internal Medicine, 164, 289–298.
Ye, S., Muntner, P., Shimbo, D., Judd, S. E., Richman, J., Davidson, K. W., & Safford, M. M. (2013). Behavioral mechanisms, elevated depressive symptoms, and the risk for myocardial infarction or death in individuals with coro-nary heart disease: The REGARDS (REason for Geographic And Racial Differences in Stroke) study. Journal of the American College of Cardiology, 61, 622–630.
540
TWIN RESEARCH AND HUMAN GENETICShttps://www.cambridge.org/core/terms. https://doi.org/10.1017/thg.2017.54