P h illip s , P e t er, M a n n i n g , D avi d J., Do n o v a n , Ti m, C r a w f o r d ,
T r e v o r a n d H i g h a m , S t e p h e n ( 2 0 0 5 ) A s of t w a r e fr a m e w o r k fo r
d i a g n o s ti c m e d i c al i m a g e p e r c e p ti o n wi t h f e e d b a c k , a n d a n o v el
p e r c e p ti o n vis u aliz a ti o n t e c h n i q u e . P r o c e e di n g s of S P I E, 5 7 4 9 .
Do w n l o a d e d fr o m : h t t p ://i n si g h t . c u m b r i a . a c . u k /i d/ e p ri n t/ 1 0 3 3 /
U s a g e o f a n y i t e m s f r o m t h e U n i v e r s i t y o f C u m b r i a’ s i n s t i t u t i o n a l r e p o s i t o r y ‘I n s i g h t ’ m u s t c o n f o r m t o t h e f o l l o w i n g f a i r u s a g e g u i d e l i n e s .
Any it e m a n d it s a s s o ci a t e d m e t a d a t a h el d i n t h e U niv e r si ty of C u m b r i a ’s in s ti t u ti o n al r e p o si t o r y I n si g h t ( u nl e s s s t a t e d o t h e r wi s e o n t h e m e t a d a t a r e c o r d ) m a y b e c o pi e d , di s pl ay e d o r p e rf o r m e d , a n d s t o r e d i n li n e wi t h t h e JIS C f ai r d e a li n g g ui d eli n e s ( av ail a bl e h e r e) fo r e d u c a t i o n al a n d n o t-fo r-p r ofi t a c tiviti e s
p r o v i d e d t h a t
• t h e a u t h o r s , ti tl e a n d full bi blio g r a p h i c d e t ail s of t h e it e m a r e ci t e d cl e a rly w h e n a n y p a r t
of t h e w o r k is r ef e r r e d t o v e r b a lly o r i n t h e w ri t t e n fo r m
• a h y p e rli n k/ U RL t o t h e o ri gi n al I n si g h t r e c o r d of t h a t it e m is i n cl u d e d i n a n y ci t a ti o n s of t h e w o r k
• t h e c o n t e n t is n o t c h a n g e d i n a n y w a y
• all fil e s r e q ui r e d fo r u s a g e of t h e it e m a r e k e p t t o g e t h e r wi t h t h e m a i n it e m fil e.
Yo u m a y n o t
• s ell a n y p a r t of a n it e m
• r e f e r t o a n y p a r t of a n it e m wi t h o u t ci t a ti o n
• a m e n d a n y it e m o r c o n t e x t u ali s e it i n a w a y t h a t will i m p u g n t h e c r e a t o r ’s r e p u t a t i o n
• r e m ov e o r a l t e r t h e c o py ri g h t s t a t e m e n t o n a n it e m .
T h e full p oli cy c a n b e fo u n d h e r e.
A Software Framework for Diagnostic Medical Image
Perception with Feedback, and a Novel Perception
Visualisation Technique
P.W. Phillips*
a, D.J. Manning
b, T. Donovan
b, T. Crawford
c, S. Higham
c aDept. of Computing, InfoLab21, Lancaster University, Lancaster, LA1 4WA, U.K.
bDept. of Medical Imaging Sciences, St. Martin’s College, Lancaster, LA1 3JD, U.K.
c
Dept. of Psychology, Lancaster University, Lancaster, LA1 4YF, U.K.
ABSTRACT
This paper describes a software framework and analysis tool to support the collection and analysis of eye move-ment and perceptual feedback data for a variety of diagnostic imaging modalities. The framework allows the rapid creation of experiment software that can display a collection of medical images of a particular modality, capture eye trace data, and record marks added to an image by the observer, together with their final decision. There are also a number of visualisation techniques for the display of eye trace information. The analysis tool supports the comparison of individual eye traces for a particular observer or traces from multiple observers for a particular image. Saccade and fixation data can be visualised, with user control of fixation identification functions and properties. Observer markings are displayed, and predefined regions of interest are supported. The software also supports some interactive and multi-image modalities. The analysis tool includes a novel visualisation of scan paths across multi-image modalities. Using an exploded 3D view of a stack of MRI scan sections, an observer’s scan path can be shown traversing between images, in addition to inspecting them.
Keywords: Eye Tracking, Feedback, New Modalities, Visualisation, Evaluation
1. INTRODUCTION
Eye tracking is used across a wide variety of domains,1 but in medical imaging it is primarily used as a tool for measuring and understanding perception when related to observer performance. Using an eye tracker to record eye movements has revealed several interesting features about how an observer interrogates an image. Characterising patterns in scans paths has helped to develop models of searching and identify search strategies. It has been demonstrated that there is a marked difference between the scan paths of an experienced observer when compared to a novice.2, 3 The visual scan pattern of an experienced observer is more efficient then the novice.4 Experts appear have learned to reduce the amount of time they send looking for lesions in unlikely areas, yet errors are still made by experienced observers, as demonstrated by the satisfaction of search effect. Investigations into satisfaction of search have shown that obvious abnormalities in an image can reduce the chance of additional ones being reported, despite the observer fixating on them.5 Displaying to an observer where they fixated, known as perceptual feedback, and asking them to repeat their search has been shown to improve observer performance.6, 7
Modern radiography has seen a boom in new imaging and presentation modalities that can be used for diagnosis, driven by new imaging technologies, improvements in imaging resolution, and faster computers to compose the data. Several of these new modalities could be described as active or interactive, requiring some form of observer intervention via a computer interface to control the visualization. Where there was once a static 2D image on screen for the observer to interrogate, now they can look at section scans stacked on each other and composed into 3D models, which they can move. There are so many new ways to find abnormalities but also new ways to miss them.
modality where the image on screen can be modified by the observer? Can models of observers carry over into these new modalities? Observation is no longer a passive activity with the luxury of observing all the data in one action. In these new modalities the act of searching now becomes one of viewing what is on screen and bringing what is obscured into view.
This paper describes a set of software that has been used to collect and analyse eye gaze data for percep-tion studies of medical images, providing perceptual feedback during experiments. It also presents a novel 3D visualization technique for viewing scan paths across stacks of MRI/CT sections. From the start, this work has been informed by a number of different disciplines. The genesis of this software was in usability studies of world-wide-web pages8 and psychology studies into reading and reasoning, but its more recent evolution has been driven by perception and perceptual feedback. In particular, the greatest contribution to its development has come from a recent study into the use of feedback in wrist fracture detection.9A system was required which would be able to record eye trace and user events, such as key presses and mouse clicks, and provide feedback to an observer. All of the collected data would need to be visualised in some way, and be exportable in a format compatible with popular statistics software.
The first part of this paper describes the features of the data collection and analysis software generated for the fracture study, before outlining how it has been extended to support a forthcoming study on perception in brain section images, with a novel 3D visualization for scan paths.
2. DATA COLLECTION TOOL
2.1. Eye Tracker
A 60Hz LC EyeGaze system (LC Technologies, Virginia, USA) is used to collect the eye tracking data. The data collection tool that has been produced does not use any specific eye tracker programming interface. It starts and stops the eye tracker by running command line programs in the background, to avoid disrupting the on-screen display. Calibration is also invoked by this method. Most eye trackers have a demonstration program that can track eye gaze and record it to a log file. All that is required is a simple program that can start or stop such eye tracker software. By loosely coupling the eye tracker system to the experiment software, it is possible to use different models of eye tracker without any changes to the data collection software itself. The amount of images involved in the fracture study9made it desirable to log eye gaze for each image, rather than run continuously for the whole session and try and synchronise the gaze data to what was on the screen at the time. This also allowed calibration to take place at various points during the session, at the discretion of the experimenter, without affecting gaze logging. It also allowed participants to take a short break half way through the session.
2.2. Open Standards
Image order, image marking, and decisions are stored separately from the eye gaze log in a platform-independent language for interchanging data, known as the Extensible Markup Language. (XML). Storing the other infor-mation in an XML document improves the portability of the data. It is easy to validate, parse and it can be transformed into other file formats by using an XML stylesheet. Not interfering with the eye gaze log format allows collected gaze data to be viewed in other software tools which may be included with the eye tracker.
Each image that is used in an experiment is associated with a web page describing its properties. The web page is written in the Extensible HyperText Markup Language (XHTML), itself an XML language. By using this well known and well supported standard, existing web authoring tools can be used to create, position, and mark up individual images. Regions of interest can be added to an image using the ImageMap feature of XHTML. Areas of an image can be marked using a rectangle, circle or irregular polygon, via, authoring tools such as Macromedia Dreamweaver. Textual descriptions of the area can be added also be added. As the image property file is a web page, it is portable, cross platform and very easy to disseminate. There is a wealth of existing software available to assist in authoring such files, so no bespoke applications need to be developed. Using XHTML rather than the older HyperText Markup Language (HTML), provides the extra benefits of XML such as validation, and stylesheet transformations.
2.3. Data Collection Process
The data collection software tool handles the display of images, recording observer decisions and the displaying feedback. It also manages the eye tracker and the data files that it produces. For each participant taking part in an experiment a presentation file containing the desired viewing order of the images is loaded. The presentation file itself is a simple text description of the image locations and messages that should be displayed as the session progresses. The file can also be written in a simple programming language (Microsoft VBScript) allowing the presentation order of the session to be randomised as it is loaded into the data collection tool. Once the presentation file has been loaded, the participant eye position is calibrated, using a simple nine point process. Between each image is an information screen, which tells the participant how far they are though the experiment. Recalibration can also be invoked manually by the experiment-observer at these information points, as they require the participant to click a button to continue.
For each image in the session, the participant is asked to make a decision about the presence of abnormality by rating the image from one (normal) to ten (abnormal). This decision is collected by the participant using the mouse to click one of ten radio buttons at the bottom of the screen. Their gaze is tracked as they view the image and the image has a time limit on screen of 30 seconds. Five seconds before the image is automatically removed there is an audio warning. Both the warning and image time limit can be configured from a menu option in the tool before the experiment session begins. Once they have made their decision they move on to the next screen by clicking an on screen button. In the background, the eye tracker is stopped and the fixations calculated. Having viewed the image for the first time, the participant is shown the image again and asked to mark on points or areas where they think any abnormality exists, by means of mouse clicking. Once satisfied with their marks, the participant is then shown their fixations, overlaid on the image. The fixations are drawn as circles with solid edges10with the radius of the circle being proportional to the fixation duration. After viewing their fixation feedback, the eye tracker is restarted and the participant is shown the image again. After making another decision, or if the 30 second time limit is reached, the eye tracker is stopped and the participant asked to mark the image one more time.
The data collection tool creates a log for each session that contains the data and time11, screen properties, and for each image the decision rating, clicks and gaze log file locations. This session log can be loaded into a session summary tool, which lists the lists the pre and post feedback decision for each image in a table. The number of marks made on an image, pre and post feedback, are also shown. The accuracy of the decisions, when compared against the gold standard, is also shown by colour coding the decision values; green for correct, red for incorrect. The information can be exported from the summary software in a format suitable for importing into a ROC analysis tool.
3. TRACEVIEWER: ANALYSIS TOOL
The analysis tool, TraceViewer, is used to load up one or more eye trace data files and superimpose them on the image that was being viewed. Each trace data file has an associated image XHTML page, which contains the image, its size and position on screen, and regions of interest descriptions. Once an initial association has been made between a gaze data file and its image description, an adaptive loading feature will automatically locate and import image and region information for subsequent gaze files that are loaded.
3.1. Data Window
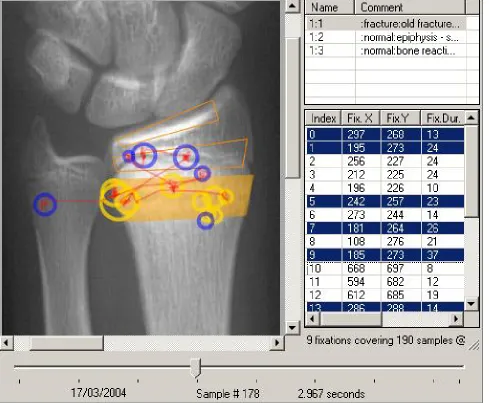
Each data file is loaded into a data window, shown in figure 1, which is contained within the larger TraceViewer application. Multiple windows can be open at once and the main application can control the layout of the windows, using tile or cascade menu options. Each window is divided into four main areas.
3.1.1. Display Area
Figure 1.An example of a data window within TraceViewer. The display area (top left) provides an interactive visuali-sation of the gaze data. The region of interest table (top right) shows three regions associated with this particular image. One of the regions has been highlighted and used to highlight fixations that fall within its boundaries, in both the fixation table (centre right) and display window. The time controller (bottom) indicates the position in the lifetime of the gaze data.
3.1.2. Fixation Table
The fixation table contains data for all the calculated fixations for the current image in the order that they occurred. Each fixation has an order number, x and y position, a fixation start time, and duration. At the bottom of the table is a summary of fixations; total number and duration. A fixation can be selected, which highlights the corresponding fixation marker in the display window. Multiple fixations can be selected by shift-clicking additional fixations. The summary of fixations also changes to reflect the overall information for the selected fixations only.
3.1.3. Region of Interest Table
A table listing the names of the regions of interest associated with the current picture. The area data and names are automatically loaded from the image description XHTML file. Clicking on a name highlights the region in the display view. Option-clicking on a name will highlight all of the fixations that fall in that region, both in the display view and the fixation table. Multiple regions can also be selected.
3.1.4. Time Controller
The time controller runs across the bottom of the data window and has a moveable slider control. This control represents the lifetime of the eye trace and changes the amount of eye trace information drawn in the display window according to the position of the slider. When the slider is fully to the left hand side of the time control this corresponds to the beginning of the eye trace (time = 0). When at the right hand end this corresponds to the finishing time. The slider allows rapid repositioning within the trace time line and updates the display window as it moves, providing interactive, user controlled, forward and reverse motion though the trace lifetime.
3.2. Visualising the Trace Data
There are three different features superimposed over the background image; saccade path, fixation zone, and region of interest. They are anti-aliased to produce smooth lines and curves, and semi-transparent to show feature overlap and the underlying image.
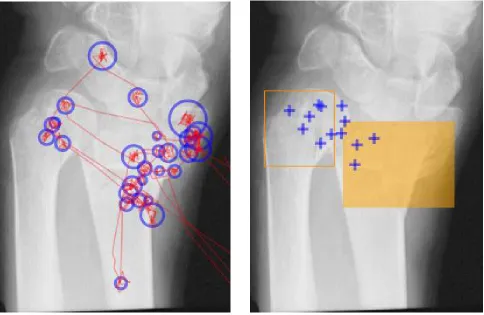
Saccade paths are sample-point to sample-point lines indicating the path of the eye across the image. Fixations are shown as duration circles; circles with a radius related to the fixation duration and centred on the fixation point. These two features are shown in figure 2a. In addition, the presentation of fixation points can be modified to show only the fixation centre, represented by a fixed-size cross. No duration information is conveyed. Alternatively both representations can be activated at the same time, which is useful for long duration fixations with close centres. Either representation can be clicked to highlight the corresponding fixation from the fixation table. Regions of interest are overlaid on the background image as semi-transparent polygons. Highlighting a region reduces the transparency slightly, to make it discernible from unselected regions. Figure 2b shows fixation crosses and region of interest marks. Saccade path, region of interest, and fixation representations can be toggled on or offby the user to control the amount of visual information in the display window. The background image can also be hidden.
3.3. Other Features
It is also possible to manually correct any large drift in the eye trace data. A moveable display mode permits the user to interactively reposition the collective trace presentation items over the background image, using their mouse or arrow keys. As the data only moved relative to the background image, only the offset values need to be added to saccade and fixation positions. The offset data can be saved, to a new file if desired.
Figure 2.The four overlay features. Image 2a, left, shows the traditional saccade path and fixation circle display. Each circle represents a fixation, centred on the fixation point. The size of the circle is proportional to the duration of the fixation. Image 2b, right, shows fixation points marked by crosses. No duraton information is conveyed. Two regions of interest are also shown, one of which is highlighted. These images come from the wrist fracture study9: 2a is the participant’s first gaze, while 2b is their second trace, having been given feedback on their previous fixations.
This feature allows the study of fixations within image regions before and after a particular image feature has been seen.
4. PERCEPTION FOR NEW MODALITIES
Past studies have shown the benefit of perceptual feedback in detection tasks for static 2D images, such as chest xrays.6, 7, 10 Advances in medical imaging and data manipulation have seen the development of more complex images,12 image processing, stacking and smoothing of 2D images to produce 3D representations,13 and very large, full body datasets.14 There does not seem to be other work on perceptual feedback using these modalities. Some studies have used eye tracking for observer analysis of other modalities, but more from a display performance and usabililty standpoint.15, 16
Several of these new methods and modalities are interactive. The investigation of the data is driven by the observer’s hand on the keyboard as well as their eye. The representation of the data on screen can be changed by the observer. In some modalities it is not possible to see all of the data at once, so identifying a search strategy must take into account data manipulation as well as eye movement.
4.1. Example: Sections of the brain
A group of MRI or CT scans of a single brain are often displayed as a series of aligned images, with one image laid on top of another other, like a deck of cards. Stacking images in this way, and providing some method of traversing the stack, is a simple two-and-a-half-dimension technique of visualising the brain, or some other volume. Image processing can also be used to alter the display properties of a particular image, such as windowing. A new aspect to the temporal record of an eye trace must now be recorded. In addition to the eye, the properties of the image on screen at that sample point also become important, as well as identifying which image is being displayed. Capturing and identifying perception becomes far more complicated.
4.2. Sections in TraceViewer
The data capture and TraceViewer software have been modified to track and analyse eye movement across a stack of MRI/CT images. The order of images in a stack is defined in an stack XHTML, with the same features available as before. When a stack of images is loaded into the picture viewing tool, a mouse-operated scrollbar appears at the side of the viewing window, which allows the participant to traverse the stack. The eye trace file is modified to include an extra column for the index of the displayed image, and the index is recorded for each sample. The internal fixation calculations have been modified to end an active fixation if the stack is traversed in any way. Within the TraceViewer application, the time control slider can be used to travel back and forth across the lifetime of the experiment, only now it changes the background image, in addition saccade and fixation information.
There are several user-selectable options for controlling the presentation of eye trace data over the stack of images. The most basic is to show the saccades and fixation points only for the image currently being displayed on screen. A more fine-grained option highlights eye data that is relevant to the current visit to the displayed image, but keeps other visit trace data in view. The final option, shown in figure 3a, superimposes saccades and fixations across the whole of the stack of images and highlighting the fixations connected to the image currently on display.
Figure 3.Viewing stacked brain sections. Image 3a, left, shows the all fixations that have been recorded for a participant’s investigation of the stack, and highlights the fixations associated with the image currently being displayed. Image 3b, right, shows the 3D visualisation of the image stack and how the gaze path moves up and down the stack, in addition to moving over individual images.
5. CONCLUSION
This work has grown out of initial software to investigate human-computer interaction and usability. The evolution of the software, driven by the related fracture study, has seen it shift from a generic eye tracking tool into a flexible set of software tools, which can be used to run experiments into perception and feedback, and visually analysis the results. Image metadata and observer session results are stored in a portable platform-neutral standard, which promotes dissemination. In addition, groups of data can be collated and exported to familiar statistics packages. Leveraging the usability and human-computer interaction background of the software, it has now evolved into a system that can investigate observer perception of new imaging modalities. Fusing user-driven input with eye-tracking data, all of the current features for 2D image viewing and analysis are available for studies into 2.5D image stacks. It is now possible to investigate eye gaze and perception across a larger set of imaging image modalities which have not been previously studied. These modalities are interactive, posing new questions on interfaces and controls, in addition to suitable visualisation and feedback. The novel 3D visualisation of scan paths will provide some of the first clues as to how these interactive modalities are being perceived and what modifications could be made to improve performance.
REFERENCES
1. A. Duchowski, “A breadth-first survey of eye-tracking applications,” Behavior Research Methods, Instru-ments, and Computers34, pp. 455–470, November 2002.
2. D. Carmody, H. Kundel, and C. Nodine, “Comparison scans while reading chest images. taught, but not practiced,”Invest Radiol19(5), pp. 462–466, 1984.
3. E. A. Krupinski, “Visual scanning patterns of radiologists searching mammograms.,”Acad Radiol3, pp. 137– 44., Feb 1996.
4. E. Krupinski, “Influence of experience on scanning strategies in mammography,” inProceedings of SPIE: Medical Imaging 1996: Image Perception, H. L. Kundel, ed.,2712, pp. 95–101, 1996.
5. S. Samuel, H. L. Kundel, C. F. Nodine, and L. C. Toto, “Mechanism of satisfaction of search: eye position recordings in the reading of chest radiographs.,”Radiology 194, pp. 895–902., Mar 1995.
6. C. Nodine, E. Krupinski, and H. Kundel, “A perceptually-based algorithm provides effective visual feed-back to radiologists searching for lung nodules,” inProceedings of the First Conference on Visualization in Biomedical Computing, pp. 202–207, 1990.
7. E. Krupinski, C. Nodine, and H. Kundel, “Perceptual enhancement of tumor targets in chest x-ray images,” Perception and Psychophysics53, pp. 519–526, 1993.
8. A. Poole, L. Ball, and P. Phillips, “In search of salience: A response-time and eye-movement analysis of bookmark recognition,” in Proceedings of HCI 2004: People and Computers XVIII-Design for Life., pp. 363–378, Springer-Verlag, 2004.
9. T. Donovan, D. Manning, P. Phillips, S. Higham, and T. Crawford, “The effect of feedback on performance in a fracture detection task,” in Medical Imaging 2005: Image Perception, Observer Performance, and Technology Assessment, SPIE, 2005.
10. E. A. Krupinski, C. F. Nodine, and H. L. Kundel, “A perceptually based method for enhancing pulmonary nodule recognition.,”Invest Radiol28, pp. 289–94., Apr 1993.
11. A. Gale, “Circadian variation in radiology,” inTheoretical and Applied Aspects of Eye Movement Research, A. Gale and F. Johnson, eds., pp. 305–312, Elsevier Science, 1984.
12. S. Webb, ed.,Physics of Medical Imaging, Medical Science Series, Institute of Physics Publishing, 1998. 13. W. Cai, D. Feng, and R. Fulton, “A 3d image smoothing method for dynamic functional imaging,” in
Selected papers from the Pan-Sydney workshop on Visualisation, pp. 99–100, Australian Computer Society, Inc., 2000.
14. M. J. Ackerman, “The visible human project,” inProceedings of the IEEE,86, pp. 504–511, March 1998. 15. D. V. Beard, E. D. Pisano, K. M. Denelsbeck, and R. E. Johnston, “Eye movement during computed
tomography interpretation: eyetracker results and image display-time implications.,” J Digit Imaging 7, pp. 189–192, Nov 1994.
16. R. Niimi, K. Shimamoto, A. Sawaki, T. Ishigaki, Y. Takahashi, N. Sugiyama, and E. Nishihara, “Eye-tracking device comparisons of three methods of magnetic resonance image series displays.,”J Digit Imaging