K Maximum Probability Attack Paths Dynamic
Generation Algorithm
Kun Bi, Dezhi Han, and Jun Wang
College of Information Engineering, Shanghai Maritime University, Shanghai 201306, China [email protected], [email protected], [email protected]
Abstract. An attack graph depicts multiple-step attack and provides a descrip-tion of system security vulnerabilities. It illustrates critical informadescrip-tion necessary to identify potential weaknesses and areas for enhanced defense. Attack graphs in-clude multiple attack paths, which are a focus for further detailed analysis and risk mitigation. Considering that different vulnerabilities have different probabilities of being exploited, this paper proposes an algorithm to dynamically generate the top K attack paths with maximum probabilities for every node of a system. The pro-posed algorithm does not require generation of the full attack graph to calculate the K attack paths. Instead, it directly processes and analyzes the system input data and dynamically identifies the K attack paths. The computational time, based upon the complexity of the attack paths, can be constrained by the parameter K. Experimental results show that the algorithm is scalable and efficient.
Keywords:attack path, attack graph, K shortest paths, system security, network security.
1.
Introduction
Computer system security is one of the most important research topics in information security area. Enterprise systems are composed of large numbers of computers which are connected by switches, routers and other network devices. In enterprise computer system, firewalls are widely used to control and isolate network access to the enterprise. Due to the inability to fully eliminate software vulnerabilities and misconfigurations, enterprise systems are vulnerable to attack. The attacker uses multiple-step attacks which exploit the vulnerabilities in computers and network system through a step-by-step methodology [2, 13, 16].
One type of partial attack graph describes the attack paths for a given node or a set of nodes; another type describes the attack paths with the maximum probability of exploit or with the minimum attack cost.
A complete attack graph contains all the available attack paths existing in the system, so in a large system with a large number of nodes and vulnerabilities, there are a lot of multiple-step attack combinations which make the complete attack graph very large and complex. It is more effective to analyze attack paths to generate useful information for users. Vulnerabilities have different probabilities of exploit. The Common Vulnerability Scoring System (CVSS) [6] methodology can be applied to rank and identify those attack paths of highest priority for focused analysis. CVSS associates a quantitative metric to a vulnerability based upon analysis of multiple factors. When considering the probability of an exploit, the top K attack paths with the highest cumulative probability (based upon the product of the probabilities of the exploits associated with an attack path) for a given node or for several nodes in the system can be computed and selected for further mitiga-tion. Those attack paths provide specific information for users to make corrective action decisions to further protect the system.
Algorithms for identifying the attack paths with the maximum exploit probability have been proposed [10, 18]. This paper describes computation of the top K maximum proba-bility attack paths for every node in the system, with K as variable. A dynamic attack paths generating algorithm to solve the problem is proposed. This algorithm does not require the generation of a complete attack graph first in order to compute the top K maximum probability attack paths. Instead, it directly analyzes the original system information and computes the top K maximum probability attack paths in a dynamic way. The number of attack paths for every node is determined by the parameter K. The computation cost of generating the attack paths, the information contained in all the attack paths and the clar-ity of the analysis results can be balanced by choosing different values for the parameter K.
The rest of this paper is organized as follows: section 2 is related work; section 3 states the problem; the new algorithm to dynamically generate the K maximum probabil-ity attack paths is described in section 4; section 5 presents and analyzes the experimental results; section 6 gives the conclusions.
2.
Related Work
speed up the attack graph generation by building indexes for the attributes in the graph. Chen, et al [3, 4] proposed a dynamic algorithm to generate the attack graph. During the graph generation, the length of any attack paths was limited to no more than N, so the computation cost can be reduced.
Li, et al [10] considered the vulnerability exploiting probability and proposed a poly-nomial algorithm to compute the maximum probability attack paths for every node in the system dynamically. Ye, et al [18] reduced the edges in attack graph through deleting cy-cles existing in the graph and they proposed another algorithm to compute the maximum probability attack paths. In their work, the vulnerability exploiting probability value is assigned according to the CVSS [6] system recommendation.
Chung, et al [5] proposed a network intrusion detection system framework named NICE . This IDS system was built on attack graph and reconfigurable virtual network. The IDS system monitors the network event through the reconfigurable virtual network and analyzes those events using attack graph analytical models. Shameli-Sendi, et al [15] presented a survey of intrusion risk assessment and response system. Attack graph was an important method and widely used in intrusion risk assessment. Kent, et al [9] gave a survey of the authentication graph. To analyze user behavior, attack graph was a power-ful model and it had the ability to describe the relationships among those vulnerabilities and misconfigurations in all the devices. Almohri, et al [1] proposed a probabilistic graph model and utilize the sequential liner programming method to address the security op-timization problem. In their work, the security risk was described using a probabilistic model and the dynamic of the network connectivity and configurations were also consid-ered. Kaynar, et al [8] studied the distributed attack graph generation problem and pro-posed a distributed computation method based on virtual shared memory model. Wang, et al [17] considered the uncertainty in a single attack step and proposed a probabilistic model for security analysis. In their model, the attack graph was combined with the Hid-den Markov Model. They also presented a heuristic searching algorithm to compute the security hardening strategy. Poolsappasit, et al [14] studies the dynamic security risk man-agement problem using Bayesian attack graph. In their work, they utilized the Bayesian model and computed the local conditional probability distribution on every node in the attack graph.
3.
Problem Statement
We first describe the attack graph model used in this paper, and then we discuss the K max-imum probability attack paths problem and the dynamic attack paths generation problem.
3.1. Attack Graph Model
In this paper, an attack graph is defined asG={V, E}, where V is the set of all the nodes of the system andE ={ei|ei ∈(V ×V)}is the set of all the edges in the attack graph.
is stored in the edge attributes set. The access privileges and other post conditions which are got in this attack step will be updated to the attack access vector. An attack access vector has N elements and N is the total number of the nodes in the system. An element in the vector stores all the privileges and other attack results acquired by the attacker so far in the corresponding node.
Every attack template has four elements, including the vulnerability information or the trust relationship information, the prerequisites of exploitation of a vulnerability or trust relationship, the post conditions of the attack and the probability value of success-fully exploiting the vulnerability or trust relationship. The trust relationship means that computer B can remote access or login to computer A if A trusts B. For example, SSH public key certificate login mechanism is a typical trust relationship. The post conditions of an attack can be classified into two categories. One category is related to gaining and promoting access privilege and the other category includes all the left post conditions of an attack such as system out of service, loss of data integrity, etc. The vulnerability can be local or remote. The vulnerability exploiting probability can be quantified according to expert repository such as CVSS [6].
3.2. K Maximum Probability Attack Paths
An attack path can be a single-step attack or a multiple-step attack. A multiple-step attack is a composite of a number of single-step attacks, where every single attack step is related to an exploitation of vulnerability or trust relationship. The probability value of a single-step means the probability of successfully exploiting the vulnerability or trust relationship and achieving the intermediate attack goal in that single attack step. The probability value of a multiple-step attack is equal to the product of all the single-step probabilities. The top K maximum probability attack paths for the attack goal node are those single-step or multiple-step attacks whose probabilities are within the K biggest values.
3.3. K Maximum Probability Attack Paths Dynamic Generation Problem
In general, in order to compute the top K maximum probability attack paths for a given attack goal node or for all of the attack goal nodes, it requires to generate a full attack graph first and then compute the top K maximum probability attack paths on that graph. But computing a full attack graph is time consuming and not necessary in order to com-pute the top K maximum probability attack paths, instead, those paths can be generated in a dynamic way. The problem of dynamically generating attack paths is how to generate the top K maximum probability attack paths for one or more attack goal nodes gradually and dynamically through directly analyzing the system input data.
When the top K maximum probability attack paths have been generated, a partial attack graph can be constructed by combining those attack paths. The constructed partial attack graph provides security information for system protection. The computation cost, the volume of information contained in the graph and the clarity of the graph can be traded off by choosing different value for the parameter K.
attack steps, compare the possibility value of those paths and save the K paths with the biggest K possibility, in the worst case, the computation complexity is exponential. To solve the problem, it is required to analyze the characteristics of those attack paths and design a strategy for searching and exploiting the vulnerabilities or trust relationship in the system.
4.
K Maximum Probability Attack Paths Dynamic Generation
Algorithm
We first present the algorithm and discuss the details, and then we analyze the time com-plexity of the algorithm.
4.1. Algorithm Description
The pseudo-code of the K maximum probability attack paths dynamic generation algo-rithm is shown in Algoalgo-rithm 1. This algoalgo-rithm has the ability to compute the top K maxi-mum probability attack paths for every node in the system. There are five steps.
Step 1. Input the system information. The input data include the existing vulnerabili-ties and trust relationships in every system node, the attack template knowledge informa-tion, the connections among the system nodes and the concrete value of the parameter K. K is the number of paths with the biggest probabilities required to be generated for every node in the system.
Step 2. Initialize the data structures used in this algorithm, initialize the attack paths recording set to be empty and initialize the start position of the attack. Note that, every node has its own attack paths recording set which is used to store those attack paths that can reach it at present. The attack start position can be a computer outside the system which accesses the system through network or a computer inside the system which ini-tializes an internal attack.
Algorithm 1K Maximum Probability Attack Paths Generation Algorithm 1: Input(); //Step 1.
2: Initial(); //Step 2. 3: Update (Q); //Step 3. 4: while(!Q.Empty())do
5: //Step 4. 6: v=Q.GetMax(); 7: Q.Pop();
8: ifv.N ode.P athN um < Kthen
9: VulUtilize(); 10: UpdateInfo( ); 11: Update (Q); 12: end if
13: end while
Step 3. Update Q. Q is the currently available vulnerability set. Note that, in the fol-lowing parts, we use the word vulnerability to represent a trust relationship or a vulner-ability for brief. It first searches the vulnerabilities which exist in those nodes that the attacker can directly access, and queries the attack template knowledge information of the corresponding vulnerability. If the prerequisite conditions of the vulnerability can be satisfied and the attack path has no loop, the vulnerability information is added into Q. The cumulative probability of the corresponding attack path is equal to the product of all the single-step probabilities. Q is a maximum heap according to the cumulative probabilities of those attack paths. The vulnerability description information includes the prerequisite conditions of the vulnerability, the probability of the vulnerability and the post conditions of the vulnerability. The vulnerability information stored in Q includes the vulnerability number, the corresponding node of the vulnerability, the attack path from the attack start position to the vulnerability and the cumulative probability of the corresponding attack path.
Step 4. If Q is empty, go to step 5; otherwise, pick out the vulnerability whose proba-bility value is the biggest in Q and then remove it from Q. If the number of paths for the node where the vulnerability exists is equal to K, it means the algorithm has already com-puted the top K maximum probability attack paths, so it will discard this vulnerability and go to the beginning of step 4; if the number of paths for the node is less than K, it picks up the post conditions of the vulnerability, adds the corresponding attack path to the nodes attack paths recording set and updates the attackers access privileges in that node. After that, it updates the attackers current position to that node and goes to step 3. Every attack path includes the vulnerability number, the corresponding node of the vulnerability, the attack path from the attack start position to the vulnerability, the cumulative probability of the corresponding attack path and the post conditions of the vulnerability.
Step 5. Output the results. In this step, Q is empty and the top K maximum probability attack paths for every node have been stored in its own attack paths recording set, so those paths can be outputted directly.
4.2. Time Complexity Analysis of the Algorithm
Note that the number of nodes in the network is N, the number of vulnerabilities in every node isM and the number of paths to be computed for every node isK. The time complexity of the algorithm isO(K·N2·M·log(K·N2·M)). If the parameterM is viewed as a constant value, the time complexity of the algorithm isO(K·N2·log(K·N2)) . The details of the proof are provided in appendix.
5.
Experimental Results and Analysis
We first give an example to illustrate the mechanism of the algorithm, and then we show the experimental results and analysis.
5.1. An Example of the Algorithm
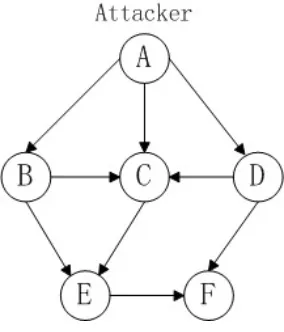
Fig. 1.Network topology
The connections among all the nodes which are constrained by firewall or access control list are shown in table 1. Each row represents the directed access connections from the node in the first column to the other nodes in the system. The symbol ‘√’ means having a directed access connection and ‘×’ means no connection.
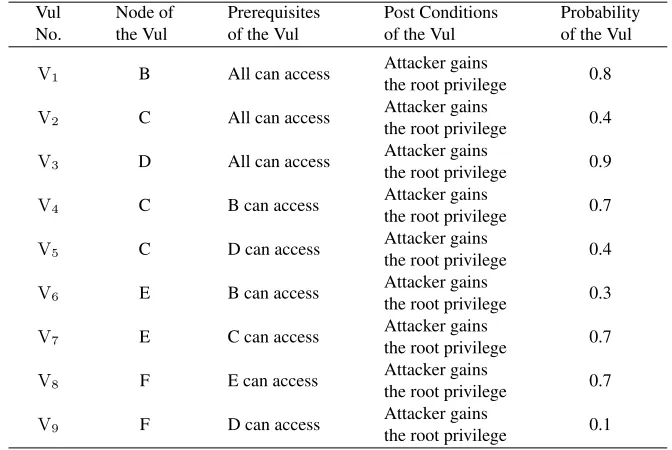
The vulnerabilities information, the prerequisites, the post conditions and the proba-bilities of those vulneraproba-bilities are shown in table 2. For convenience of description, all the post conditions of those vulnerabilities are all that the attacker gains the root privilege in the corresponding node. In actuality, the post conditions of those vulnerabilities can be various.
Table 1.Nodes access matrix
Node attacker B C D E F
attacker √ √ √ √ × ×
B × √ √ × √ ×
C × × √ × √ ×
D × × √ √ × √
E × × × × √ √
F × × × × × √
Table 2.Vulnerability information of each node Vul No. Node of the Vul Prerequisites of the Vul
Post Conditions of the Vul
Probability of the Vul
V1 B All can access
Attacker gains
the root privilege 0.8
V2 C All can access
Attacker gains
the root privilege 0.4
V3 D All can access
Attacker gains
the root privilege 0.9
V4 C B can access Attacker gains
the root privilege 0.7
V5 C D can access Attacker gains
the root privilege 0.4
V6 E B can access
Attacker gains
the root privilege 0.3
V7 E C can access
Attacker gains
the root privilege 0.7
V8 F E can access
Attacker gains
the root privilege 0.7
V9 F D can access
Attacker gains
the root privilege 0.1
so the cumulative probability of this attack path can be computed as “0.8×0.7 = 0.56”. The results show that all of the top two attack paths with maximum probabilities for every node in the system have been computed correctly.
Table 3.K maximum probability attack paths of each node (K=2)
Node No. Attack
Path No. Attack Path
Cumulative Probability
B 1 AB(V1) 0.8
2 Does not exist.
C 1 AB(V1)C(V4) 0.56
2 AC(V2) 0.4
D 1 AD(V3) 0.9
2 Does not exist.
E 1 AB(V1)C(V4)E(V7) 0.392
2 AC(V2)E(V7) 0.28
F 1 AB(V1)C(V4)E(V7)F(V8) 0.2744
5.2. Performance Evaluation
We use simulation experiments to test the performance and scalability of our algorithm. The test environment is one 2.8GHz CPU with two cores, 2GB memory, windows 7 op-eration system and visual c++ 2010. The test codes are written in C++ using C++ STL.
In those experiments, we use the full connection topology whose number of edges can reach its maximum value. We have tested the algorithm under different number of nodes, different number of vulnerabilities and different K values. In all the experiments, the probabilities of all the vulnerabilities are randomly generated.
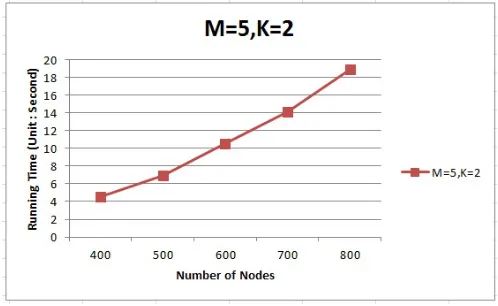
The first experiment tests the effect of the number of nodes on the running time of the algorithm. In this test, each node has 5 vulnerabilities,K= 2and the number of nodes is in range [400, 800]. The experimental results are shown in figure 2.
When the number of nodes in the system is 400, the running time is about 4.5 second; when the number of nodes in the system is 800, the running time is about 18.9 second. The running time is about quadratic in the number of the nodes. The experimental results are consistent with the theoretical time complexity analysis.
The second experiment is to test the effect of the number of vulnerabilities on the running time of the algorithm. In this test, the number of nodes in the system is 500 and K= 2. The number of vulnerabilities in every node is in range [5, 10]. The experimental results are shown in figure 3.
When the number of vulnerabilities in every node is 5, the running time is about 6.9 second; when the number of vulnerabilities is 10, the running time is about 14.8 second. The running time is about linear in the number of the vulnerabilities.
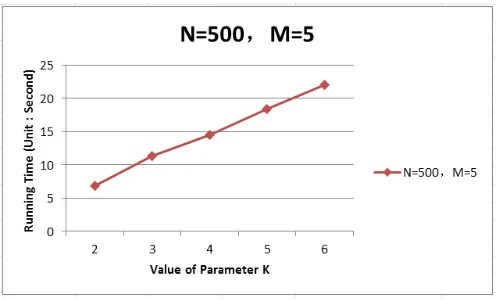
The third experiment is to test the effect of parameter K on the running time of the algorithm. In this test, the number of nodes is 500 and the number of vulnerabilities in every node is 5. The value of parameter K is in range [2, 6]. The experimental results are shown in figure 4.
WhenK= 2, the running time is about 6.9 second; whenK= 4, the running time is about 14.5 second; whenK= 6, the running time is about 22.1 second. The running time is about linear in the parameter K.
Fig. 3.Running time on different number of vulnerabilities
Fig. 4.Running time on different value of parameter K
6.
Conclusions
and the clarity of the results were all related to the parameter K and could be balanced by choosing appropriate value of K. Experimental results showed that the algorithm has good efficiency and scalability in computing those attack paths.
This algorithm assumed the probabilities of all the vulnerabilities were given as the in-put data of the algorithm and those probabilities did not change during analysis procedure. In our future work, we will study how to evaluate and adjust the probability of vulnera-bility according to system security monitoring and evaluation data in order to make those values more precise.
Acknowledgments.This work was partly supported by National Natural Science Foundation of China (No. 61373028 and No. 61070154), Science & Technology Program of Shanghai Maritime University (20130471) and Foundation for University Key Teacher of Shanghai Maritime University (11th).
Appendix A: Complexity of the Algorithm
In this section, we prove the time complexity of the algorithm isO(K·N2·M·log(K·N2· M)), whereN is the number of nodes in the network,M is the number of vulnerabilities in every node andKis the number of paths to be computed for every node. The details of the proof are as follows.
The maximum length of Q is noted asL. Step 1 is to input information.
Step 2 is to do initialization work and can be finished in a constant time.
Step 3 is to update Q. The total number of vulnerabilities to be queried in this step is no more thanN×M. The complexity of putting a vulnerability into Q isO(log(L)). So the complexity of this step isO(N·M·log(L)).
Next, we analyze the complexity of step 4. As shown in Algorithm 1, in line 8, the total number of the condition being true is no more thanK×N, so the total number of executing the codes from line 9 to line 11 is no more thanK×N. Line 11 is function Update(Q) and the total number of vulnerabilities to be queried in function Update(Q) is no more thanN×M, so the increment of the length of Q is no more thanN×M each time. The total number of vulnerabilities that can be added into Q during the running process is no more than((K×N)·(N×M)). Line 7 will remove one vulnerability from Q, so the total number of loops in line 4 is no more than((K×N)·(N×M)). The complexities of line 6, line 7 and line 8 areO(1),O(log(L))andO(1)separately, so the complexity from line 4 to line 8 isO((K×N)·(N×M)·log(L)) =O(K·N2·M·log(L)). The codes in line 9˜11 will only be executed when the statement condition in line 8 is true, so we analyze the complexity of line 9˜11 separately. The complexities of line 9, line 10 and line 11 are O(1),O(1) andO(N·M·log(L))separately. The codes in line 9˜11 will be executed no more than(K×N)times, so the total complexity of line 9˜11 is O((K·N)·(N·M·log(L))) =O(K·N2·M ·log(L)).
Step 5 is to output the results and the complexity of step 5 isO(K·N).
References
1. Almohri, H., Yao, D., Watson, L., Ou, X.: Security optimization of dynamic networks with probabilistic graph modeling and linear programming. IEEE Transactions on Dependable and Secure Computing (2015),http://dx.doi.org/10.1109/TDSC.2015.2411264
2. Ammann, P., Wijesekera, D., Kaushik, S.: Scalable, graph-based network vulnerability analy-sis. In: Proceedings of the 9th ACM Conference on Computer and Communications Security. pp. 217–224. ACM, New York, USA (2002)
3. Chen, F.: A Hierarchical Network Security Risk Evaluation Approach Based on Multi-goal At-tack Graph. Ph.D. thesis, Dissertation, National University of Defense Technology, Changsha, China (2009)
4. Chen, F., Su, J.S., Zhang, Y.: A scalable approach to full attack graphs generation. In: Engineer-ing Secure Software and Systems, Lecture Notes in Computer Science, vol. 5429, pp. 150–163. Springer-Verlag, Berlin Heidelberg New York (2009)
5. Chung, C.J., Khatkar, P., Xing, T., Lee, J., Huang, D.: Nice: Network intrusion detection and countermeasure selection in virtual network systems. IEEE Transactions on Dependable and Secure Computing 10(4), 198–211 (2013)
6. FIRST: Common vulnerability scoring system (2015), [Online]. Available: http://www.first.org/cvss
7. Ingols, K., Lippmann, R., Piwowarski, K.: Practical attack graph generation for network de-fense. In: Proceedings of the 22nd Annual Computer security Applications Conference. pp. 121–130. IEEE, Florida, USA, (2006)
8. Kaynar, K., Sivrikaya, F.: Distributed attack graph generation. IEEE Transactions on Depend-able and Secure Computing (2015), http://dx.doi.org/10.1109/TDSC.2015. 2423682
9. Kent, A.D., Liebrock, L.M., Neil, J.C.: Authentication graphs: Analyzing user behavior within an enterprise network. Computers & Security 48, 150–166 (2015)
10. Li, K., Gu, N.J., Bi, K., Ji, H.Z.: Network security evaluation algorithm based on access level vectors. In: Proceedings of the 9th International Conference for Young Computer Scientists. pp. 1538–1544. IEEE, Hunan, China (2008)
11. Lippmann, R., Ingols, K., Scott, C., Piwowarski, K., Kratkiewicz, K., Artz, M., Cunningham, R.: Validating and restoring defense in depth using attack graphs. In: Proceedings of Military Communications Conference. pp. 1–10. IEEE, Washington DC, USA (2006)
12. OU, X.M., Boyer, F.W., McQueen, A.: A scalable approach to attack graph generation. In: Proceedings of the 13th ACM Conference on Computer and Communications Security. pp. 336–345. ACM, Virginia, USA, (2006)
13. Phillips, C., Swiler, L.P.: A graph-based system for network-vulnerability analysis. In: Pro-ceedings of the 1998 workshop on New security paradigms. pp. 71–79. ACM, Virginia, USA (1998)
14. Poolsappasit, N., Dewri, R., Ray, I.: Dynamic security risk management using bayesian attack graphs. IEEE Transactions on Dependable and Secure Computing 9(1), 61–74 (Jan 2012) 15. Shameli-Sendi, A., Cheriet, M., Hamou-Lhadj, A.: Taxonomy of intrusion risk assessment and
response system. Computers & Security 45, 1–16 (2014)
16. Sheyner, O., Haines, J., Jha, S.: Automated generation and analysis of attack graphs. In: Pro-ceedings of the 2002 IEEE Symposium on Security and Privacy. pp. 273–284. IEEE, California, USA (2002)
17. Wang, S., Zhang, Z., Kadobayashi, Y.: Exploring attack graph for cost-benefit security harden-ing: A probabilistic approach. Computers & Security 32, 158–169 (2013)
19. Ye, Y., Xu, X.S., Qi, Z.C., Wu, X.Y.: Attack graph generation algorithm for large-scale network system. Journal of Computer Research and Development 50(10), 2133–2139 (2013)
Kun Bireceived the Ph.D. degree from University of Science and Technology of China. He is currently a lecture of computer science and engineering at Shanghai Maritime Uni-versity. His main research interests include network security, big data and cloud security.
Dezhi Han(corresponding author) received the Ph.D. degree from Huazhong University of Science and Technology. He is currently a professor of computer science and engi-neering at Shanghai Maritime University. His research interests include cloud computing, cloud security and cloud storage security technology.
Jun Wangreceived the PhD degree from the University of Cincinnati. He is a Charles N. Millican faculty fellow, IEEE senior member and an associate professor of computer engineering at the University of Central Florida, Orlando. His specific research interests include massive storage and file System in local, distributed and parallel systems environ-ment.