Available online on 30.08.2019 at http://jddtonline.info
Journal of Drug Delivery and Therapeutics
Open Access to Pharmaceutical and Medical Research© 2011-18, publisher and licensee JDDT, This is an Open Access article which permits unrestricted non-commercial use, provided the original work is properly cited
Open Access
Review Article
Stability Matrix Designs: A Boon for Stability Testing of Pharmaceutical
Drug Products
R. Santosh Kumar and P. Swetha
GITAM Institute of Pharmacy, GITAM (Deemed To Be University) Rushikonda, Visakhapatnam-530045, Andhra Pradesh, India.
ABSTRACT
Long term stability is done in a matrix approach after manufacturing of drug for ensuring the stability of drugs. Using the matrix basic design which is useful for testing 3 lots under one storage condition can be expanded to multiple presentation of products or multiple storage conditions. The design shows full testing at the end points (0 and 36 months) and shows partial testing at the interim time points (3, 6, 9, 12, 18 &24 min). With the assistance of a statistical search algorithm, the test points are selected . 37.5% reduction in analytical testing, while permitting a reliable interim expiry estimate. Based on 12 months stability data it is provided by the proposed matrix design. The matrix approach obtained by expiration dating periods is typically more conservative than the approaches derived from the full testing estimate. The comparison of expiration dating estimate for meter dose inhaler and capsules is presented using the matrixed and full testing approaches.
Keywords: Matrix Design, Stability, Expiration Dating
Article Info:Received 14 June 2019; Review Completed 21 August 2019; Accepted 26 August 2019; Available online 30 August 2019 Cite this article as:
Santosh Kumar R, Swetha P, Stability Matrix Designs: A Boon for Stability Testing of Pharmaceutical Drug Products,
Journal of Drug Delivery and Therapeutics. 2019; 9(4-s):839-843 http://dx.doi.org/10.22270/jddt.v9i4-s.3396
*Address for Correspondence:
R. Santosh Kumar, GITAM Institute of Pharmacy, GITAM (Deemed to be University), Gandhinagar, Visakhapatnam-530045, Andhra Pradesh, INDIA.
Introduction:
[1]Stability studies were managed to exhibit how the quality of drug substances varies with time under the capacity of different environmental factors like temperature, humidity , light etc to initiate and re-examine the drug substance to recommend strong conditions . the drug product is defined as the dosage form in the final package .stability studies must be applicable to all strengths and all packages. For new drug product accelerated testing is necessary for six months and long term testing is required to determine the shelf life . thus the cost of stability studies is essential leading to statistically designed stability studies ,which are called matrix design where “ a selected subject total number of possible samples for all combinations is tested at a specified time point
History:
Statistically in early 1980s designed stability studies were first used (E.Nordbrock,1981, stability protocols) and it was
accepted by US food and drug
administration.(W.Fairweather,1982,personal
communication). Nakagaki[4], who was first person to use
the terminologies matrix and bracket[9-28]. Nordbrock[2,3,5]
was the one who appeared in first journal articles in 1992
[6-8].Bracketting and matrixing guidance was issued in
2003[29].A guidance on evaluation of stability data was
issued in 2004[30].
Designs:
BackgroundBasic analysis which is applied to stability data is linear regression of the parameter of the time therefore the selection of observations in the slope is to take first half in beginning of the study which gives the minimum variance and second half is at the end. The statistically designed stability designs are analysed for several times either they can be during the new drug product or either can be yearly for market product.
Basic Matrix 2/3 on Time Design
months so that for complete study can be done, so each of the three batches was tested at 0,3,6,9,12,18,24 and 36 months(Table 1). This matrix 2/3 time design can be tested
only for the intermediated time points that are designed only for two of the three batches. This design can be tested for 18 months in all batches
Table. 1: Basic Matrix 2/3 on Time Design
Batch Test Times
A 0,3,9,12,24,36
B 0,3,6,12,18,36
C 0,6,9,18,24,36
Matrix 2/3 on Time Design With Multiple Package
In this designed a single strength is packed unto three packages with equal balance in each of three packages. Balance means each batch have been tested twice at
intermediate time point and analysis will be done after completion of eighteen months .These design can be modified by telling all package combinations at 18 months(Table 2).
Table 2 Matrix 2/3 on Time Design With Multiple Package
Batch Pkg 1 Pkg 2 Pkg 3
A T1 T2 T3
B T2 T3 T1
C T3 T1 T2
Pkg 1= package 1, etc
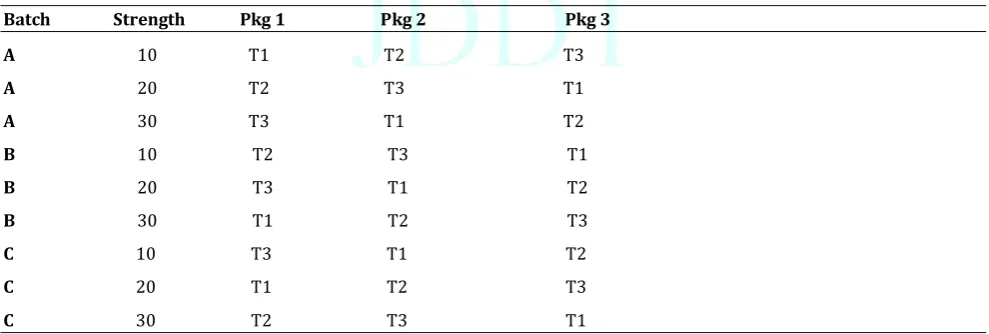
Matrix 2/3 on Time Design with Multiple Packages and Multiple Strengths
Further extension of the above is the three strengths are manufactured using same formula with different weights and divided into 9 sub batches and each strength consists of 3 packages. This design is applied for 9 sub batches in
balanced fashion. Each sub batch at the intermediate time point is tested twice in such a manner that each batch is tested 6 times during this intermediate interval and the analysis is done after 18 months. By testing all batches by strength by package combinations these design can be modified at 18 months(Table 3).
Table 3 Matrix 2/3 on Time Design with Multiple Packages and Multiple Strengths
Batch Strength Pkg 1 Pkg 2 Pkg 3
A 10 T1 T2 T3
A 20 T2 T3 T1
A 30 T3 T1 T2 B 10 T2 T3 T1 B 20 T3 T1 T2
B 30 T1 T2 T3
C 10 T3 T1 T2
C 20 T1 T2 T3
C 30 T2 T3 T1
Pkg 1= package 1, etc
Table 4 Test Code Definitions
Batch Test Times after Time 0
T1 3,9,12,24,36
Matrix 1/3 on Time Design:
The design forms are reduced from 2/3 to 1/3 by reduction in amount of testing. For example one of the 3 batches are
tested during intermediate time point during basic 1/3 time design and analysis is done after 18 months . these basic 1/3 design can be further modified by testing several batches at the time of completion of 18 months.(Table 5)
Table 5 Matrix 1/3 On Time Design
Batch Test Times A 0,3,12,36
B 0,6,18,36
C 0,9,24,36
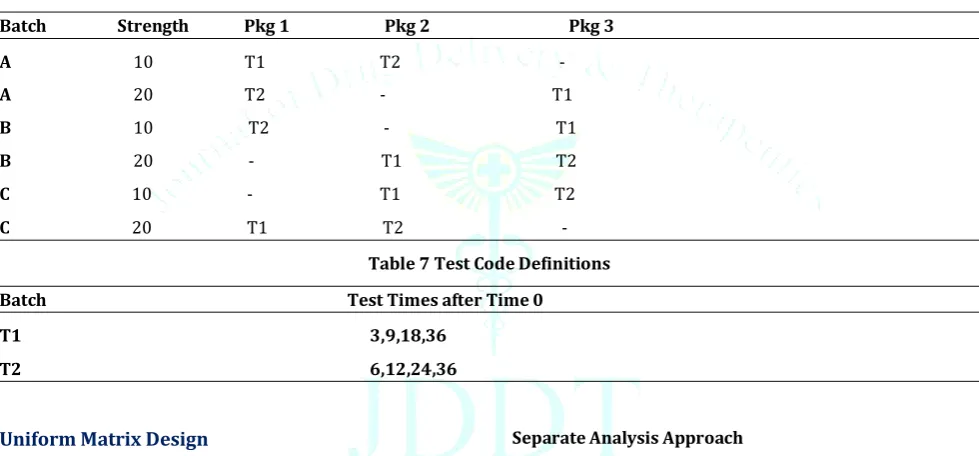
Matrix on Batch ×Strength×Package Combination:
This design is done for multiple strengths and multiple packages. To test the batch only single portion of the batch – by –strength by package combinations are taken . for
example ; in 3 batches it is divided to two strengths giving 6 sub batches, the batch size is small and only 2 packages can be manufactured in each sub batch . The design should be balanced because each of 2 packages of sub batch are tested(Table 6).
Table 6 Matrix on Batch ×Strength×Package Combination
Batch Strength Pkg 1 Pkg 2 Pkg 3
A 10 T1 T2 -
A 20 T2 - T1
B 10 T2 - T1
B 20 - T1 T2
C 10 - T1 T2
C 20 T1 T2 -
Table 7 Test Code Definitions
Batch Test Times after Time 0
T1 3,9,18,36
T2 6,12,24,36
Uniform Matrix Design
Another type of design is uniform matrix design “ the same time protocol is used for all combinations of the other design factors.” This testing is done only during 12 ,24 and 36 months. Advantage of this study design is this design is more simplified with reduced variability of slope of the regression line. Disadvantage is major stability problems . therefore this model is not acceptable majority of areas.
Analysis Background [30]
Long term based data the ich q1e guidance for single package and single strength specifies that 95% one sided lower confidence bound for the mean regression line must be according to ich q 1 e . in case of multiple strengths / multiple packages there are three possible approach for analysis
the first approach : package by strength combination separately
second approach : all data to model with one analysis with separate intercepts and slopes for each batch by its strength and package without poolability testing
third approach: model all data with one analysis and test for probability for selection of appropriate reduced model.
Separate Analysis Approach
Multiple analysis are conducted in first approach ,with separate analysis of each package- by-strength-by batch. For each of separate analyses shelf life is calculated and product shelf life minimum of all package by strength by batch shelf lives.
One Analysis Approach, Without Testing Poolability
It is a second approach, out of which one analysis is done that includes complete data by using individual intercepts a shelf life is estimated and pooled mean square error from the entire set. Shelf life for each batch by package by strength is taken as the time the batch by package by strength acceptable within limits .For multiple batches only one package and one strength the SAS model is
Where B is class term for batch ,p is class term for package and A is the covariate for age . This model consist of separate slopes for every batch by package . The shelf life of the product is the minimum of all batch by package shelf lifes.
One Analysis: Testing Poolability[14,27,28]
It is very important that full model reflects manufacturing process. For exact formulation by using different weights it is assumed that there are multiple strengths and multiple packages so granulation batches split into sub batches, where it is manufactured into a different strength of the product using different weights of granulation . Zero samples are collected from each sub batch of the tablet and every tablet is packaged into sub batch products. Process validation provides proof that entire tablet sub batch is uniform
SAS model is
With B as a class term for granulation batch, P= package
S= strength
A= covariate for time
This model testing begins the slope two way interactions determine by using a significance level of 0.25 when the batch is a part of the term and 0.05 otherwise .By using final model 95% one sided lower confidence bound to mean regression line and shelf life is assigned for each package by strength.
Factors Acceptable To Matrix
It is acceptable for NDA
Investigational new drug application studies
Supplements and marketed products
It is acceptable to matrix for product such as solids
It is acceptable to matrix for product such as
semisolids
It is acceptable to matrix for product such as liquids
It is acceptable to matrix for product such as aerosols
It is acceptable to matrix after bracketing
It is acceptable to matrix when there are multiple sources of raw material
It is acceptable to matrix if there are multiple sites of drug product manufacture
It is acceptable to matrix when identical formulations
are manufactured into several strengths
It is acceptable to matrix if formulation are cosely related
Matrixing is applicable to the orientation of container during storage
Matrixing may be applicable to in certain cases when closely related formulations are used in different strengths
Matrix across container and closure systems may be
applicable if justified
It is acceptable to matrix within a package composition
It is not acceptable to matrix across storage conditions
It is not acceptable to matrix across parameters , such
as dissolution and potency
General Rules
Matrix designs are balanced exactly
For each batch - by – strength – by – package
combination is not tested , strength – by-package combination should be tested at least for 2 batches
Unless there are manufacturing restrictions such as
batch ×strength×package combination only more than 3 strengths there is a combination.
CONCLUSION
In many situations matrix designs are applicable generally for stable products 1/3 matrix on time readily acceptable .2 basic approaches when analyzing data from a matrixed design . There are several methods used to evaluate and compare potential designs.
REFERENCES
1. Guidance for industry Q1A(R2) Stability Testing of New Drug substances and products; November,2003
2. Nordbrock, E.Statistical Study Design.Presentation at National Stability Discussion Group;October,1989
3. Wright, J.Use of factorial Designs in Stability Testing.Proceedings of stability Guidelines for Testing Pharmaceutical Products:Issues and alternatives.AAPS Meeting;December ,1989.
4. Nakagaki ,P.AAPS Annual Meeting;1990.
5. Nordbrock, E.Statistical Comparision of NDA Stability Study Designs.Midwest Biopharmaceutical Statistics Workshop;May,1991.
6. Nordbrock, E.Statistical Comparision of Stability Study Designs.J.Biopharm Stat.1992,2,91-113.
7. Helboe,P.New designs for stability testing programs:Matrix or factorial designs.Authorities viewpoint on the predictive value of each studies. Drug Inf.J.1992,26,629-634.
8. Carstenson,J.t;Franchini,M;Ertel,K.Statistical approaches to stability protocol design.J.Pharm . Sci.1992.81,303-308. 9. Chow,S.C. Statistical Design and analysis of Stability
studies.48th Annual Conference on Applied Statistics;1992. 10. Nordbrock, E. Design and analysis of Stability studies.ASA
Proceedings of Biopharmaceutical section;1994;291-294. 11. Nordbrock, E.Statistically Designed Stability Studies, an
Industry Perspective. Presentation at Biostatistics Subsection/ Clinical Data Management Group of Pharmaceutical Research and manufactures of America ;October,1994.
12. Lin,T.D.Applicability of Matrix and Bracket Approach to Stability Study Design.ASA Proceedings of Biopharmaceutical Section;1994;142-147.
13. Fairweather, W.R;Lin,T.D; Kelly,R.Regulatory and Design Aspects of Complex Stability studies.Presentation at Biostatistics Subsection/ Clinical Data Management Group of Pharmaceutical Resarch and Manufactures of America;October,1994.
14. Fairweather,W.R.;Lin. T.D.; Kelly, R. Regulatory, design, and analysis aspects of complex stability studies.J.Pharm. Sci. 1995,84,1322-1326.
15. Golden,M.H.;Cooper,D.c.;Riebe , M.T.; Carswell, K.E. A matrixed approach to long term stability of pharmaceutical products.J.Pharm.Sci>1996,85,240-245.
16. Murphy, J.R.Uniform matrix stability study designs.J.Biopharm.Stat. 1996,6,477-494.
17. DeWoody,K;raghavarao,D.Some optimal matrix designs in stability studies.J. Biopharm.Stat.1997,7,205-213.
18. Ju, H.L; Chow , S.C. On stability designs in drug shelf –life estimation. J. Biopharm. Stat.1995,5,210-214.
20. Nordbrock, E; Valvani, S. PhRMA Stability Working group. Guideline for Matrix Designs of Drug Product StabilityProtocols, January, 1995.
21. Chen,C.FDA’s Views on Bracketing and Matrixing.EPPIA Symposium: Advanced Topics in Pharmaceutical Stability Testing-Building in the ICH Guideline; October, 1996. 22. Lin , D. Stability Studies at the FDA. PERI Course: Non-Clinical
Statistics for Drug Discovery and Development; March, 1997. 23. Nordbrock, E. Computing Power Details.PERI; Training Course
in Non- Clinical Statistics; February, 1994
24. Pong,A.;Raghavarao,D.Comparision of bracketing and matrixing designs for a two- year stability study.j.Biopharm.Stat.2000,10,217-228.
25. Chow,S.-C.. Statistical Design and Analysis of Stability Studies;Chapman and Hall, New York,2007.
26. Nordbrock, E. Use of Statistics to Establish a Stability Trend: Matrixing. In Pharmaceutical Testing to Support Global Markets; Huynh-Ba,k.;Ed.;Springer, New York,2009.
27. Tsong,Y.;Chen, W.-J.; Chen,C.W. Ancova Approach for Shelf Life Analysis of Stability Study of Multiple Factor Designs. J.Biopharm.Stat. 2008,13(3),375-393.
28. Tsong,Y.Personal Communication,2008.
29. Guidance for Industry.Q1D Bracketing and Matrixing Designs for Stability Testing of New Drug Substances and Products; November,2003.