Available online on 15.07.2019 at http://jddtonline.info
Journal of Drug Delivery and Therapeutics
Open Access to Pharmaceutical and Medical Research© 2011-18, publisher and licensee JDDT, This is an Open Access article which permits unrestricted non-commercial use, provided the original work is properly cited
Open Access
Research Article
Development and Validation of Stability Indicating HPLC Method for
Estimation of Darunavir
Anurruddha R. Chabukswar
1, Ayushi S. Gadekar
2*
1 Professor - Pharmaceutical Chemistry, Dr. Vishwanath Karad MIT World Peace University, School of Pharmacy, Kothrud, Pune- 411038,
Maharashtra, India.
2 MAEERS Maharashtra Institute of Pharmacy, Kothrud, Pune -411038, Maharashtra, India
ABSTRACT
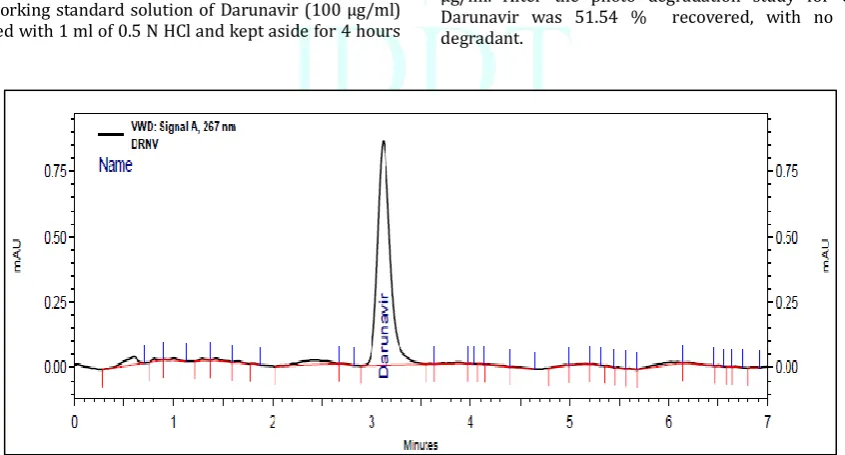
To develop a new simple, precise and accurate HPLC method for estimation of Darunavir in tablet formulation. An isocratic, HPLC method was developed using C-18, 50 x 3 mm, 3.5 µm (X-Terra MS, Waters) column 0.1 % Acetic acid in water: ACN (63:37 v/v) as mobile phase at flow rate of 1.0 ml/min at detection wavelength of 267 nm. The retention time (RT) of drug was 3.123± 0.034 min . The method was validated with respect to linearity, precision, assay, accuracy and robustness. The data of linear regression analysis indicated a good linear relationship over
the range of 5-30 μg/ml concentrations with a correlation coefficient(R 2) of 0.9995.The developed method was found to be simple, sensitive,
selective, accurate, and precise for analysis of Darunavir and can be adopted for routine analysis of drug in bulk and pharm aceutical dosage form.
Keywords: High performance liquid chromatography (HPLC), Darunavir, method development, Validation.
Article Info: Received 04 May 2019; Review Completed 12 June 2019; Accepted 21 June 2019; Available online 15 July 2019
Cite this article as:
Gadekar AS, Chabukswar AR, Development and Validation of Stability Indicating HPLC Method for Estimation of Darunavir
Journal of Drug Delivery and Therapeutics. 2019; 9(4):65-71 http://dx.doi.org/10.22270/jddt.v9i4.3148
*Address for Correspondence:
Mrs. Ayushi S. Gadekar, MAEERS Maharashtra Institute of Pharmacy, Kothrud, Pune -411038, Maharashtra, India
INTRODUCTION:
Darunavir is chemically
[(3aS,4R,6aR)-2,3,3a,4,5,6a-
hexahydrofuro[2,3-b]furan-4-yl]N-[(2S,3R)-4-[(4- aminophenyl)sulfonyl-(2-methylpropyl)amino]-3-hydroxy-1-phenylbutan-2-yl]carbamate it is HIV protease inhibitor that is used in the treatment of AIDS and HIV infections. Darunavir is an antiretroviral protease inhibitor that is used in the therapy and prevention of human immunodeficiency virus (HIV) infection and the acquired immunodeficiency syndrome (AIDS). Darunavir can cause transient and usually asymptomatic elevations in serum aminotransferase levels and has been linked to rare instances of clinically apparent, acute liver injury. In HBV or HCV coinfected patients, highly active antiretroviral therapy with darunavir may result of an exacerbation of the underlying chronic hepatitis B or C. Literature survey reveals that few analytical methods have been reported for the estimation of Darunavir including
UV-Vis spectroscopy(1,2), high performance liquid
chromatography (HPLC) (3,4), high performance thin layer
chromatography(HPTLC) (5,6), Infrared Spectroscopy(IR) (7) ,
Capillary Electrophoresis (8) , LC-MS/MS(9,10) .
MATERIALS AND METHODS:
Reagents and chemicals
20 tablets each containing 300 mg of Darunavir (Daruvir, Cipla Ltd.) was procured from local market. Acetonitritle (HPLC grade), Acetic acid in water, Hydrochloric acid (HCl), acetic acid (CH3COOH), hydrogen peroxide (H2O2), and
sodium hydroxide (NaOH).
Chromatographic condition
Fig 1 : Chromatogram of Darunavir (10 µg/ml)
Preparation of Standard stock solution:
Standard stock solution of drug was prepared by dissolving 10 mg of drug in 10 ml of Acetonitritle to get concentration of 1000 µg/ml (A). From this working standard solution was prepared containing 100 µg/ml of Darunavir in acetonitritle (B). From this further dilution was made in acetonitritle to get final solution of Darunavir.
Selection of detection wavelength:
From the standard stock solution further dilutions were done using ACN and scanned over the range of 200 - 800 nm and the spectrum was obtained. It was observed that the drug showed considerable absorbance at 267 nm. Representative UV Spectrum of Darunavir is shown in Fig 2.
Fig 2 : UV-VIS Spectra of DARUNAVIR (10 µg/ml)
Selection of mobile phase:
Chromatographic separation studies were carried out on the working standard solution of Darunavir 10 µg/ml. Initially, trials were carried out using Methanol and Acetonitrile in various proportions along with buffer of varying pH, to obtain the desired system suitability parameters. After few trials, 0.1 % Acetic acid in water: ACN (63:37 v/v) was chosen as the mobile phase, which gave good resolution and acceptable peak parameters.
Preparation of sample solution
20 tablets each containing 300 mg of Darunavir (Daruvir, Cipla Ltd.) was weighed and powdered. Powder equivalent to 10 mg of drug was transferred to 10 ml volumetric flask and volume was made up with acetonitrile to get concentration (1000 µg/ml) and was sonicated for 10 min. Solution was filtered, from this solution 1 ml of solution was taken in 10 ml volumetric flask and volume was made up with acetonitrile. Further dilution was done to get concentration 10 µg/ml.
Validation of Analytical Method: 11 Validation of Analytical Method Specificity
The specificity of the method was ascertained by peak purity profiling studies. The peak purity values were found to be more than 996 [Purity front 997.54 and Purity tail 996.12] indicating the no interference of any other peak of degradation product, impurity or matrix.
Linearity
From the standard stock solution (1000 µg/ml) of Darunavir, solution was prepared containing 100 µg/ml of Darunavir with acetonitritle. This solution was further used to prepare range of solution containing six different concentrations. The linearity (relationship between peak area and concentration) was determined by analyzing six solutions over the concentration range of 5-30 µg/ml of Darunavir. The results obtained are shown in Table 1. The peak area of drug was plotted against the corresponding concentrations to obtain the calibration curve as shown in Figure 3.
-0.1 1.1
0 0.5 1
200 400 600 800
Abs
Table 1: Linearity study of Darunavir
Replicates
Concentrations of DARUNAVIR
5μg/ml 10μg/ml 15μg/ml 20μg/ml 25μg/ml 30μg/ml
Peak Area
1 72301.4 184904.2 235901.5 300842.5 383554.8 425349.1
2 72633.2 184087.2 235864.9 306577.3 378338.4 424821.6
3 72035.82 183800.4 235791.9 304596.3 381071 426413.8
4 72356.3 186522.4 235882.7 303566.2 385172.9 424653.7
5 72725.53 181562.4 236859.6 306788.2 381573 424657.8
6 71464.99 184981.3 235119.6 300756.3 380427.1 424053.8
Mean 72252.87 184309.7 235903.4 303854.5 381689.5 424991.6
Std. Dev. 458.03 1646.36 555.51 2657.99 2401.3 810.47
%RSD 0.63 0.89 0.23 0.87 0.62 0.19
Figure 3: Calibration curve of Darunavir (5-30 µg/ml)
Range:
Darunavir = 5-30 µg/ml.
Precision:
The precision of the method was demonstrated by intra-day and inter-day variation studies. In the Intra-day studies, 3 different concentrations were analyzed in a day and percentage RSD was calculated. For the inter day variation studies, 3 different concentrations were analyzed on 3 consecutive days and percentage RSD were calculated. The results obtained for Intraday and Inter day variationsare shown in Table 2 and Table 3 respectively.
Table2: Intra-day precision study of Darunavir
Replicates 5 Conc. (µg/ml) 10 15
1 72301.4 184904.2 232901.3
2 72633.2 184087.2 231867.6
3 72035.8 183800.4 235791.9
Mean 72323.4 184263.9 232520.3
SD 299.30 572.72 2034.02
%RSD 0.41 0.31 0.87
Table 3: Inter-day precision of Darunavir
Replicates 5 Conc. (µg/ml) 10 15
1 72301.4 185004.3 235901.5
2 72725.3 184178.3 236859.6
3 71464.9 183810.3 235119.6
Mean 72163.9 185084 235960.2
SD 641.44 247.45 871.48
%RSD 0.88 0.13 0.36
Limit of Detection (LOD) andLimit of Quantification (LOQ)
LOD and LOQ are calculated from the formula: -
Where,
σ = standard deviation of Y intercept S = slope of the calibration curve
Table 4: LOD and LOQ of Darunavir
Method Avg. slope S.D LOQ (µg/ml) LOD (µg/ml)
S.D of y-intercept 13851.83 1886.22 0.44 1.36
y = 13850x + 24788 R² = 0.985
0 100000 200000 300000 400000 500000
Assay
Daruvir tablet formulation analysis was carried out as mentioned under section preparation of sample solution. Procedure was repeated for six times. Sample solution was injected and area was recorded for each drug. Concentration and % purity was determined from linear equation. The results obtained are shown in Table 5.
Table 5: Assay of marketed formulation
Sr. No. Peak area Recovered Amount (µg/ml)
% Recovery
1 156358.5 9.80 98.05
2 156531.6 9.81 98.18
3 157092.4 9.85 98.58
4 158555.4 9.96 99.64
5 157868.3 9.91 99.14
6 157986.3 9.92 99.23
Mean 157398.7 9.88 98.80
SD 875.38 0.063 0.630
% RSD 0.55 0.63 0.638
Stress Degradation Studies of Bulk Drug:
Stress degradation studies were carried under condition of acid as well base hydrolysis, oxidation and dry heat. Dry heat and photolytic degradation were carried out in solid state.
Preparation of standard stock solution
Accurately weighed 5 mg of Darunavir was transferred to the 5 ml pre-calibrated volumetric flask. Darunavir was dissolved in small quantity of water. Volume was made up to 5 ml with water to achieve a stock solution of 1000 μg/ml 1) which was further diluted to get 100 μg/ml (Stock-2)
Preparation of sample: Acid hydrolysis
2.5 ml working standard solution of Darunavir (100 µg/ml) was mixed with 1 ml of 0.5 N HCl and kept aside for 4 hours
at room temperature. After exposure the solution was neutralized with 0.5 N NaOH and volume was made up to 10 ml with Mobile phase and injected. After acid hydrolysis, Darunavir showed no peak of degradation product. The percent recovery of Darunavir was found to be. 17.10 %
Alkaline hydrolysis
2.5 ml of working standard solution of Darunavir (100 µg/ml) was mixed with 1 ml of 0.5 N NaOH and kept aside for 4 hours at room temperature. After exposure the solution was neutralized with 0.5 N HCl and the volume was made up to 10 ml with mobile phase and injected; After Alkaline hydrolysis, Darunavir showed no peak of degradation product. The percent recovery of Darunavir was found to be 13.28 %
Oxidation
2.5 ml working standard solution of Darunavir (100 µg/ml) was mixed with 1 ml of 10 % solution of H2O2 and was kept
aside for 4 hours at room temperature. After exposure the volume was made upto 10 ml with mobile phase and injected. In the oxidative condition, percent recovery obtained for Darunavir was 29.29 % with no peaks of degradant.
Degradation under dry heat
Dry heat studies were performed by keeping drug sample in oven (800 C) for a period of 4 hours. A sample was
withdrawn after 4 hour, dissolved in acetonitritle to get solution of 1000 µg/ml and further diluted with acetonitritle to get 25 µg/ml as final concentration and was injected. In the dry heat degradation condition, percent recovery obtained for Darunavir was 69.73 % with no peak of degradant.
Photo-degradation studies.
Photolytic studies were carried out by exposure of drug to UV light up to 200 watt hours/square meter Sample was weighed, dissolved in and diluted with acetonitritle to get 25 µg/ml. After the photo degradation study for UV light Darunavir was 51.54 % recovered, with no peak of degradant.
Figure 5: Chromatograph of HCl mediated degradation of Darunavir
Figure 6: Chromatograph of NaOH mediated degradation of Darunavir
Figure 7: Chromatograph of Hydrogen peroxide mediated degradation of Darunavir
Figure 9: Chromatograph of Degradation under UV light of Darunavir
Table 6: Summary of degradation parameters:
Sr. Stress Condition % Assay of Darunavir
1. Acid (0.1 N HCl) 17.10
2. Alkali (0.1 N NaOH) 13.28
3. Oxidation (10 % H2O2) 29.29
4. Heat (80oC) 69.73
5. UV Exposure 51.54
Accuracy
To check accuracy of the method, recovery studies were carried by spiking the standard drug to the Daruvir Tablet sample solution, at three different levels around 50, 100 and 150 %. Basic concentration of sample solution chosen was 10 µg/ml of Darunavir and recovery was determined from linearity equation. The results obtained are shown in Table 7.
Table 7: Recovery studies of Darunavir
Level Conc. of Sample solution (µg/ml)
Conc. of Standard solution spiked
(µg/ml) Area
Amount
recovered(µg/ml) % recovery
50 % 10 5
226920.4 14.88
98.56
225013.3 14.75
224523.5 14.71
100 %
10 10
292556.3 19.61
98.22
293655.2 19.69
292655.53 19.62
150 % 10 15 364552.3 365875.3 99.21 99.59 99.58
367052.3 99.93
Robustness
Robustness of the method was determined by carrying out the analysis under conditions during which mobile phase
composition, detection wavelength, flow rate were altered and the effects on the area were noted. The method was found to be robust. The results obtained are shown in Table 8.
Table 8: Robustness study
% RSD Found For Robustness Study(peak area)
MP COMPOSITION DETECTION WAVELENGTH
(± 1 nm) (± 0.05 ml/min) FLOW RATE
61:39 63:37 65:35 266 267 268 0.95 1 1.05
Summary of validation study:
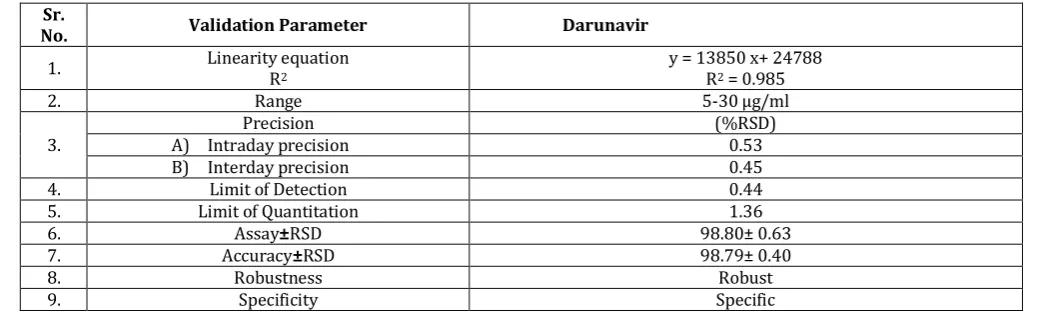
Table 9: Summary of validation study by HPLC method Sr.
No. Validation Parameter Darunavir
1. Linearity equation R2 y = 13850 x+ 24788 R2 = 0.985
2. Range 5-30 µg/ml
3.
Precision (%RSD)
A) Intraday precision 0.53
B) Interday precision 0.45
4. Limit of Detection 0.44
5. Limit of Quantitation 1.36
6. Assay±RSD 98.80± 0.63
7. Accuracy±RSD 98.79± 0.40
8. Robustness Robust
9. Specificity Specific
REFERENCES:
1. Ghante MR, Shelar RS, Sawant SD, Kadam MM, Development
and Validation of UV spectrophotometric method for estimation of Darunavir ethanolate in bulk and tablet dosage
form, International Journal of Pharmacy and Pharmaceutical
Sciences, 2014; 6(7): 240-242.
2. Vanukuri SS, Mastanamma Sk, Alekhya G, Validated UV
Spectrophotometric methods for the estimation of Darunavir by absorption maxima, first order derivative and area under curve in bulk and its tablet dosage form, International Journal of Pharmacy and Pharmaceutical sciences, 2013; 6(1): 568-571.
3. Rami Reddy BV, Jyothi G, Reddy BS, Raman N.V.V.S.S, Reddy
SC, C Rambabu, Stability-Indicating HPLC Method for the
Determination of Darunavir Ethanolate.Journal of
Chromatographic Science, 2012; 6: 1-6.
4. Patel BN, Suhagia BN, Patel CN,RP-HPLC Method
Development and Validation for estimation of darunavir ethanolate in tablet dosage form, International Journal of Pharmacy and Pharmaceutical Sciences, 2012;4(3): 270-273.
5. Patel BN, Suhagia BN, PatelCN, Panchal HJ,A simple and
sensitive HPTLC Method for quantitative analysis of darunavir ethanolate tablets, Journal of Planer Chromatography, 2011; 3: 292-295.
6. Bokka R , Sisla R , Rentam KKR, Kothapalli HB, Vanka UMS,
Potturi SD, HPTLC Method for determination of darunavir in
rat plasma and its application pharmacokinetic Studies, Journal of Liquid Chromatography & Related Technologies, 2014;36(2) :167-179.
7. Ana Carolina Kogawa, Hérida Regina Nunes Salgado.
Development and validation of infrared spectroscopy method for the determination of darunavir in tablets. Physical Chemistry 2013, 3(1): 1-6.
8. Kogawa1 AC, Aguiar FA, Gaitani CS, Salgado HRN, Validation
of a stability indicating capillary electrophoresis method for the determination of darunavir in tablets and comparison with the of infrared absorption spectroscopic method,World Journal of Pharmacy and Pharmaceutical Sciences,2014, 3(6): 283-297.
9. Rao RN, Ramachandra B, Sravan B, Khalid S, LC–
MS/MSStructural characterization of stress degradation productsincluding the development of a stability indicating
assay ofdarunavir, an anti-HIV drug, Journal of
Pharmaceutical and Biomedical Analysis, 2014 (89): 28-33.
10. Rezk NL, White NR, Jennings SH, Kashuba ADM, A novel LC–
ESI-MS Method for the simultaneous determination of etravirine, darunavir and ritonavir in human blood plasma, Talanta, 2009 (79): 1372-1378.
11. ICH guidelines for validation of analytical procedures: text