Available online on 15.11.2018 at http://jddtonline.info
Journal of Drug Delivery and Therapeutics
Open Access to Pharmaceutical and Medical Research© 2011-18, publisher and licensee JDDT, This is an Open Access article which permits unrestricted non-commercial use, provided the original work is properly cited
Open Access
Research Article
Development and validation of novel HPLC method for the estimation of
Rutin in crude hydromethanolic leaf extract of
Prosopis cineraria
Ram Singh Bishnoi*, Manish Kumar, Ajay Kumar Shukla, C.P. Jain Department of Pharmaceutical Sciences, Mohanlal Sukhadia University, Udaipur, India
ABSTRACT
A simple, specific, accurate and precise high performance liquid chromatography method has developed for the estimation of rutin in Prosopis cineraria. The chromatographic separation was achieved by using C18 column, 150 x 4.6mm i.d., 5µ bonded phase
octadecylsilane (Thermo Labs Hypersil). Mobile phase was composed of 80 parts of methanol & 20 parts of 0.05% formic acid. The pH of the mobile phase was 3.2.The retention time of rutin was found 5.7 min with 1 mL/min flow rate at ambient temperature. The estimation was performed on PDA detector at 281 nm. In this study, an excellent linearity was obtained with r2 0.999. Besides, the
chromatographic peak was found sharp & symmetric. The proposed method was validated in terms of the analytical parameters such as accuracy, linearity, precision, robustness, limit of detection (LOD), limit of quantification (LOQ) were determined based on the International Conference on Harmonization (ICH) guidelines. The detector response was linear in the range of 2-10 µg/mL. The proposed method was successfully applied for the estimation of the constituents in crude extract of Prosopis cineraria. This study established a quantitative method for the determination of rutin from Prosopis cineraria.
Keywords: Prosopis cineraria, HPLC, Validation, Rutin.
Article Info:Received 27 Sep 2018; Review Completed 25 Oct 2018; Accepted 27 Oct 2018; Available online 15 Nov 2018 Cite this article as:
Bishnoi RS, Kumar M, Shukla AK, Jain CP, Development and validation of novel HPLC method for the estimation of Rutin in crude hydromethanolic leaf extract of Prosopis cineraria, Journal of Drug Delivery and Therapeutics. 2018; 8(6):68-73 DOI: http://dx.doi.org/10.22270/jddt.v8i6.2016
*Address for Correspondence:
Ram Singh Bishnoi, Research Scholar, Department of Pharmaceutical Sciences, Mohanlal Sukhadia University, Udaipur-313001, Rajasthan, India
1. INTRODUCTION
The plant Prosopis cineraria (Khejri) is a flowering tree in the leguminous family Fabaceae. It is a small to medium size thorny, irregularly branched flowering tree, found widely in the Thar desert of Rajasthan, India and plays a vital role in preserving the ecosystem1.
It is one of the most important natural resources of arid regions of India because of its economic values (fuel, fodder), ecological role in preventing soil erosion. Prosopis cineraria have also been used in indigenous system of medicine as a folk medicine for various ailments. The bark is dry, acrid, bitter, with sharp taste; cooling anthelmintic, tonic; cures leprosy dysentery, asthma, leucoderma, piles, tremors of the muscle, wandering of the mind. The flowers are grounded mixed with sugar and used during pregnancy as safeguard against miscarriage. The ashes of bark are rubbed over the skin to remove hair. The smoke of the leaves is good for eye troubles. Fresh Leaves juice mixed with lemon juice is used for dyspepsia; extract of crushed pods is used for earache, toothache, pain relief from fractured bones. Aqueous extract of bark and leaves
applied externally to treat skin diseasedisinfects wounds and promotes healing2-3.
Prosopis cineraria is mostly used as a folk medicine due to
the presence numerous phytoconstituents like alkaloids (Spicigerine, Prosophylline), steroids (Campesterol, stigmasterol, sitosterol), tannins, phenolic compound (Gallic acid), flavone derivatives (Prosogerin A, B, C, D, and E), etc has been isolated. In this respect, polyphenolic compounds, like flavonoids and phenolic acids, commonly found in plants have been reported to have multiple biological effects, including antioxidant and anti inflammatory activity. Synthetic antioxidants have toxicity, Thus interest in natural antioxidant, especially of plant origin, has greatly increased in recent years3.
organisms are incapable of synthesizing rutin. Therefore, it can only be ingested with plant products. Rutin and its aglycones were observed in various fruits, vegetables, tea leaves, coffee grains, etc8- 9.
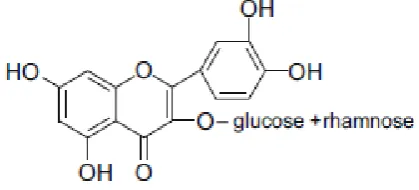
Figure 1: Structure of rutin
Identification of major and unique compounds in herbs as markers and development of analytical methodologies for monitoring them are the key steps involved in marker-based standardization10. High performance layer chromatography (HPLC) has recently emerged as a preferred analytical tool for fingerprints and quantification of marker compounds in herbal drugs because of its simplicity, sensitivity, accuracy, suitability for high throughput screening. HPLC method is a suitable method for estimation of chemical constituents present in plant materials11-14. The proposed method is optimized and validated as per the International Conference on Harmonization (ICH) guidelines15.
The literature survey showed that there was no report about the estimation of rutin constituent in leaf extract of
Prosopis cineraria. Quantitative estimation of this
compound is important for current research and a variety of methods are required for this and in the present study the quantification of rutin was done by HPLC method. A sensitive, accurate and specific HPLC method was developed and validated for the estimation of rutin in the hydro alcoholic and methanolic leaf extract of Prosopis cineraria.
2. MATERIALS AND METHODS
2.1 Materials and reagents
Rutin (98%) was purchased from Sigma-Aldrich, Bangalore, India. Methanol and acetonitrile were of HPLC grade from Qualigens fine chemicals, Mumbai, India. All the reagents and chemicals used were of analytical and HPLC grade. Water (HPLC grade) was obtained from Milli Q RO system.
2.2 Plant Material
Fresh leaves of Prosopis cineraria were collected in month of November from Artiya Khurd village of Jodhpur
Rajasthan. A voucher specimen (JJ No. 847889) was submitted in the herbarium of Botanical Survey of India Jodhpur for authentication. BSI issued a certificate of authentication with ref no. BSI/AZRC/1.12014/Tech/ 2016-17-(Pl. Id)/1062. Leaves were collected in bulk, washed, shade dried & coarsely powdered. Defated with petroleum ether & macerated 70 % methanol, the filtrated extract was then concentrated by using rotary evaporator and stored at 40C prior to use.
2.3Preparation of standard solution
The standard stock solution of 1000 µg/mL rutin was prepared by 70% methanol. This stock solution was stored in light resistant containers. The dilute standard solutions of concentration 2-10 μg/mL of rutin were prepared from above stock solution and used for calibration curve of rutin.
2.4Preparation of sample solution
About 30 g of the powdered sample was weighed and defatted with the selected solvents by Soxhlet apparatus for 72 h. The defatted residue was dried & macerated with 70 % methanol; the filtrate was dried at 500C under reduced pressure in a rotary evaporator (Heidolph instrument GmbH & Co.kg, Germany). The sample solution of extract of 1000 µg/mL was prepared by 70% methanol. After filtering through 0.45 μm nylon filter paper, the extract was diluted with mobile phase injected directly.
2.5Instrumentation and Chromatographic conditions
The estimation of rutin was performed on a Shimadzu liquid chromatographic system equipped with LC-10AT VP solvent delivery system (pumps), SPD M-10A VP photodiode array detector and Rheodyne 7725i injector with 20 μl loop volume, LC Solution for data collection and processing (Shimadzu technologies, Japan). The mobile phase, MeOH: 0.05% Formic acid pH 3.2 (80:20 v/v) was pumped with a flow rate of 1 mL/min. The elution was monitored at 281 nm. Peak identity was confirmed by retention time and spectrum comparison. All the analysis was performed at ambient temperature.
3. RESULTS AND DISCUSSION
3.1 Method development and validation
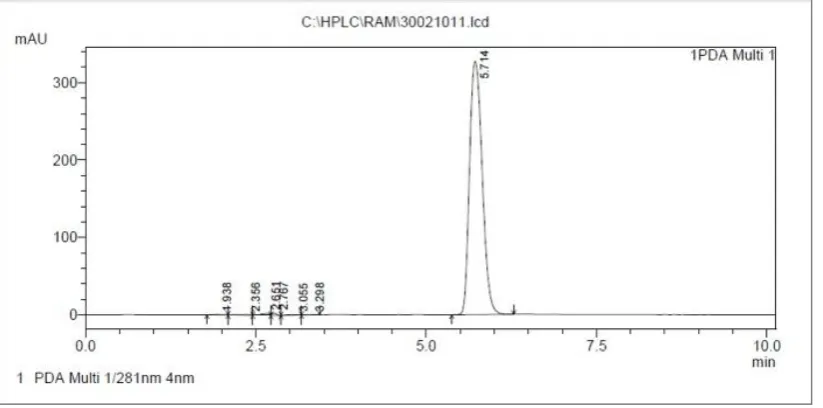
Upon application of the developed method, single specific peak was obtained for rutin (Figure 2). Rutin was identified
in Prosopis cineraria hydro-methanolic extract. The
Figure 2: HPLC Chromatogram of standard Rutin
Figure 3: Peak purity of Rutin Figure 4: 3D-HPLC Chromatogram of standard Rutin
3.2 Linearity and range of the developed method
For linearity study, five solutions in the range of 2-10 μg/mL for rutin were analyzed. Each concentration was made and analyzed in triplicate. The peak areas obtained against each concentration of the analytes were used to build a linear regression equation and to determine value
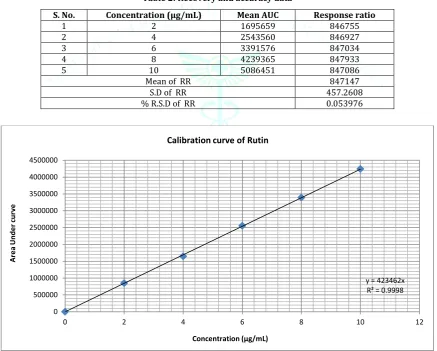
of correlation coefficient (Table 1). Good linearity was observed over the above-mentioned range with linear regression equation Y= 423462x for rutin (x is concentration of analytes in μg/mL and Y is peak area). The value of correlation coefficient was found to be 0.999 for rutin. The results indicate that the method is linear over the concentration range studied.
Table 1: Linearity data of Rutin
Conc. (µg/mL)
Area under curve (AUC) Replicates
Mean S.D. R.S.D (%)
Rep-1 Rep-2 Rep-3
2 849193 849893 849493 849526.33 351.1884 0.04133 4 1647586 1647086 1647044 1647238.67 301.5316 0.01830 6 2553479 2550690 2553268 2552479.00 1732.050 0.06785 8 3391572 3394572 3392572 3392905.33 1527.525 0.04502 10 4239465 4243588 4243140 4242064.33 2262.206 0.05332
3.3 Accuracy of the developed method
This study was performed by adding known amounts of rutin to the all dilution of linearity (2-10 μg/mL) in three
replicates. The recovery range for rutin was found to be 99.67 to 99.81 %. The % relative standard deviation was found 0.0539 % for rutin (Table 2).
Table 2: Recovery and accuracy data
S. No. Concentration (µg/mL) Mean AUC Response ratio
1 2 1695659 846755
2 4 2543560 846927
3 6 3391576 847034
4 8 4239365 847933
5 10 5086451 847086
Mean of RR 847147
S.D of RR 457.2608
% R.S.D of RR 0.053976
Figure 6: Calibration curve of Rutin
3.4 Precision of the developed method
Repeatability (Intra-day precision) was studied by calculating the relative standard deviation (RSD) for nine replicates of the concentration of 10 µg/mL, performed on the same day and under same experimental conditions. The results of rutin determinations in the working standard
solution with the relative standard deviation were calculated (Table 3). Inter-day precision studies include the estimation of variations in analysis when a method is used within laboratories, on different day. The RSD values obtained for intraday & inter-day precision rutin were 0.03527 & 0.026154906respectively.
y = 423462x R² = 0.9998
0 500000 1000000 1500000 2000000 2500000 3000000 3500000 4000000 4500000
0 2 4 6 8 10 12
A
re
a
U
nde
r
cur
ve
Table 3 Precision data
S. No. Concentration (µg/mL) (Same day) AUC (Different day) AUC
1 10 4243588 4240725
2 10 4239365 4240440
3 10 4243140 4241232
4 10 4241572 4241426
5 10 4242064 4241995
6 10 4240228 4242352
7 10 4241934 4243728
8 10 4242782 4242506
9 10 4239884 4243232
Mean of AUC 4241617.444 4241959.556
S.D. of AUC 1494.491143 1109.480521
% R.S.D of RR 0.035233992 0.026154906
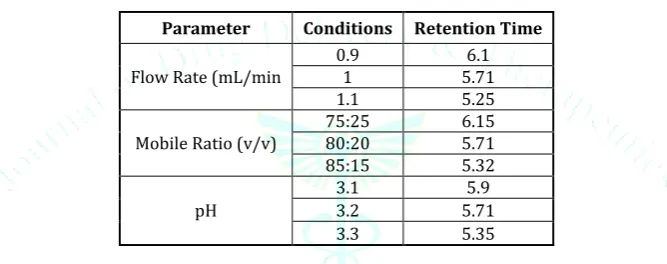
3.5 Robustness of the developed method
The robustness of the proposed method was evaluated by deliberately changing the chromatographic conditions such
as flow rate, solvent ratio and pH. The results showed that varying the chromatographic conditions had no appreciable effects on the chromatographic parameters (Table 4)
Table 4 Robustness study of the proposed HPLC method
Parameter Conditions Retention Time
Flow Rate (mL/min 0.9 1 5.71 6.1
1.1 5.25
Mobile Ratio (v/v) 75:25 80:20 6.15 5.71
85:15 5.32
pH
3.1 5.9
3.2 5.71
3.3 5.35
Table 5: System suitability studies for estimation of rutin by HPLC
S. No. Parameters Inference
1 Linearity range 2 µg/mL -10 µg/mL
2 Regression equation y=42346x
3 Correlation coefficient 0.999
4 Asymmetric factor 1.948
5 Tailing factor 1.277
6 Theoretical plates 7134.155
7 Resolution 6.457
8 LOD (ng/mL) 100 ng/mL
9 LOQ (ng/mL) ng/mL
3.6 Limit of detection and quantification
LOD & LOQ were calculated by using the following equations.
And
Where SD = the standard deviation of the response, S = Slope of the calibration curve.
The LOD value was found to be 100 ng/mL and the LOQ value was found to be 300 ng/mL for the rutin.
4. CONCLUSIONS
The proposed analytical method for estimation of rutin in the extracts of Prosopis cineraria is accurate, precise, linear, robust, reproducible and within the range. The results show that Prosopis cineraria contain considerable amounts of flavonoids which demonstrate that the plant could be considered as a potential source of natural health-promoting antioxidants for medicinal and food applications. This study established a quantitative method for the determination of rutin from Prosopis cineraria.
REFERENCES
1. Liu Y, Singh D, Nair M, Pods of Khejri (Prosopis cineraria) consumed as a vegetable showed functional food properties. Journal of Functional Foods, 2012; 4(1):116-121. doi: 10.1016/j.jff.2011.08.006
2. Anand S, Thakur S, Gargi M, Choudhary S, Bhardwaj P, Development and characterization of genomic microsatellite markers in Prosopis cineraria. Current Plant Biology, 2017; 9-10:37-42. doi: 10.1016/j.cpb.2017.03.001
3. Garg A, Mittal S, Review on Prosopis cineraria: A potential herb of Thar desert. Drug Invention Today, 2013; 5(1):60-65. doi: 10.1016/j.dit.2013.03.002
4. Ross J, Kasum C, Dietary Flavonoids: Bioavailability, Metabolic Effects, and Safety. Annual Review of Nutrition,
2002; 22(1):19-34. doi:
10.1146/annurev.nutr.22.111401.144957
5. Cody V, ChemInform Abstract: Crystal and Molecular Structures of Flavonoids. Cheminform, 1989; 20(12). doi: 10.1002/chin.198912363
6. Cao J, Zhang Y, Chen W, Zhao X, The relationship between fasting plasma concentrations of selected flavonoids and their ordinary dietary intake. British Journal Of Nutrition, 2009; 103(02):249. doi: 10.1017/s000711450999170x 7. Hakkinen S, Kärenlampi S, Heinonen I, Mykkanen H,
Torronen A, Content of the Flavonols Quercetin, Myricetin, and Kaempferol in 25 Edible Berries. Journal of Agricultural And Food Chemistry, 1999; 47(6):2274-2279. doi: 10.1021/jf9811065
8. Scholz, Williamson, Interactions Affecting the Bioavailability of Dietary Polyphenols in Vivo. International Journal For
Vitamin And Nutrition Research, 2007; 77(3):224-235. doi: 10.1024/0300-9831.77.3.224
9. Manach C, Williamson G, Morand C, Scalbert A, Rémésy C, Bioavailability and bioefficacy of polyphenols in humans. I. Review of 97 bioavailability studies. The American Journal Of Clinical Nutrition, 2005; 81(1):230S-242S. doi: 10.1093/ajcn/81.1.230s
10. Shah W, Rane N, Kekare MB, Vaidya V, Estimation of two bioactive compounds from Azadiracta indica A.Juss. leaves using HPLC. International Journal of Pharma and Bio Sciences; 2010; 1(2):1-7.
11. Behnaz M, Davood E A, Atena A, Simultaneous determination of rutin and quercetin in different parts of Capparis spinosa, Bulletin of environment, Pharmacology and Life Sciences 2013; 2(2):35-38.
12. Crozier, A, Jensen E, Lean M, McDonald M, Quantitative analysis of flavonoids by reversed-phase high-performance liquid chromatography. Journal Of Chromatography A, 1997; 761(1-2):315-321. doi: 10.1016/s0021-9673(96)00826-6 13. Wang S, Huang K, Determination of flavonoids by
high-performance liquid chromatography and capillary electrophoresis. Journal of Chromatography A, 2004; 1032(1-2):273-279. doi: 10.1016/j.chroma.2003.11.099
14. Ashok Kumar BS, Lakshman K, Jayaveera KN, Vamshi Krishna N, Manjunath M, Suresh MV, Estimation of rutin and quercetin in Amaranthus viridis Linn by HPLC, Asian Journal of Experimental Sciences, 2009; 23:51-54.