SLA-Driven Adaptive Monitoring of Distributed
Applications for Performance Problem Localization
Dušan Okanović1, André van Hoorn2, Zora Konjović1, and Milan Vidaković1
1 Faculty of Technical Sciences, University of Novi Sad, Trg D. Obradovića 6,
21000 Novi Sad, Serbia {oki, ftn_zora, minja}@uns.ac.rs 2 Software Engineering Group, University of Kiel,
Christian-Albrechts-Platz 4, 24098 Kiel, Germany [email protected]
Abstract. Continuous monitoring of software systems under production workload provides valuable data about application runtime behavior and usage. An adaptive monitoring infrastructure allows controlling, for instance, the overhead as well as the granularity and quality of collected data at runtime. Focusing on application-level monitoring, this paper presents the DProf approach which allows changing the instrumentation of software operations in monitored distributed applications at runtime. It simulates the process human testers employ–monitoring only such parts of an application that cause problems. DProf uses performance objectives specified in service level agreements (SLAs), along with call tree information, to detect and localize problems in application performance. As a proof-of-concept, DProf was used for adaptive monitoring of a sample distributed application.
Keywords: continuous monitoring, adaptive monitoring, aspect-oriented programming, service level agreements.
1.
Introduction
Localization
standard testing, e.g., using debuggers and profilers, hardly allows detecting all errors and unpredicted events that occur in production or during operation. Also, it is a common phenomenon that software performance and quality of service (QoS) degrade over time [2]–which calls for continuous monitoring of applications in order to determine whether QoS is kept on a satisfactory level. Continuous monitoring of software is a technique that provides a picture of dynamic software behavior under real exploitation circumstances. The data obtained through the monitoring process can, for instance, be used as a basis for architecture-based software optimization, visualization, and reconstruction [3].
An important issue of software monitoring is imposed performance overhead, since the monitoring system shares common resources with the monitored system. Therefore, the monitoring system has to perform using a minimal amount of resources. In a testing phase, software developers commonly use tools such as profilers and debuggers. These tools induce significant performance overhead, and therefore, they are not suitable for monitoring during the operation phase. Monitoring code can only be optimized up to a certain extent. In order to achieve an even higher reduction of monitoring overhead, it would be beneficial to automatically adapt monitoring to only monitor selected parts of the system.
The DProf system proposed in this paper has been developed for adaptive monitoring of distributed enterprise applications with a low overhead. In order to do that, the Kieker [3] framework, which yields low overhead, is used for collecting the monitoring data. Additional components support changing of monitoring parameters at application runtime. These additional components have been developed using Java Management Extensions (JMX) [4]. The system analyzes call trees (as described in the following paragraph) reconstructed from the gathered data and automatically creates a new monitoring configuration if needed.
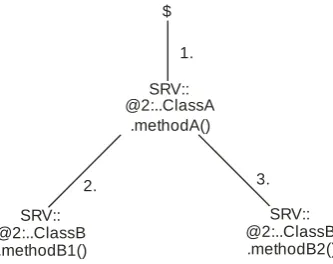
A call tree represents calling relationships between software methods [5]. It contains the control-flow of method executions invoked by a client request. The first method is called the "root". For example, consider the simplified call tree in Fig. 1. This call tree represents a situation where a client invokes methodA() from ClassA. This method in turn, invokes two methods from ClassB: first methodB1() and then methodB2(). SRVX and SRVY are the names of servers on which the methods are being executed.
$
3. 2.
1. SRV:: @2:..ClassA
.methodA()
SRV:: @2:..ClassB .methodB2() SRV::
@2:..ClassB .methodB1()
Fig. 1. An example call tree
DProf can be configured to work in different modes, e.g., for the following purposes: 1) locating software components causing deviations between obtained results and values required by service level agreements (SLAs), 2) detecting bottlenecks, or 3) collecting performance data for post-mortem analysis. The first two modes are usually used for problem detection and localization, while the third mode is used when software performance ought to be evaluated in general. DProf uses SLAs that are defined in an XML document, for which we propose an XML schema, called DProfSLA. The schema is compliant to existing SLA standards in the field.
The idea behind our approach is to reduce monitoring overhead by only monitoring parts of software suspected of containing problems or deviating from expected behavior. In the problem localization process, the system starts by monitoring methods that are at the root of call trees. If the deviation from expected results in one of the trees is detected, the DProf incrementally turns on monitoring in lower levels of that particular tree. This is repeated successively, until the method that is causing the problem is determined. DProf adapts without human intervention to find the cause of the problem.
This simulates the manual procedure typically employed for localizing the root cause of performance problems. Other systems perform monitor the whole software, regardless of the fact that other parts (other call trees) are working fine. Since DProf’s additional monitoring components are implemented using JMX technology, reconfiguration of the DProf monitoring parameters can still be performed manually by system administrators using any JMX console.
Localization
In our earlier work we presented some parts of the monitoring subsystem of the DProf system [6, 7]. In this paper, we further extend those results with automatic adaptation of the monitoring process. We presented the DProfSLA XML schema in [8]. This paper presents an enhanced version of the schema, which contains support for the latest DProf features. A more detailed evaluation of the system is also presented.
The remainder of the paper is organized as follows. In Section 2 we present the DProf monitoring system, including its components, architecture and functions provided. Section 3 presents an evaluation of the DProf monitoring system. Section 4 discusses related work. It contains an example of the continuous and adaptive monitoring of a real application and presents a discussion of the obtained monitoring results. Finally, Section 5 draws concluding remarks and outlines directions for future work.
2.
DProf System
The DProf system enables adaptive monitoring of distributed enterprise applications with a low overhead. It performs automatic analysis of obtained data based on call tree analysis and automatically reconfigures the monitoring instrumentation in order to reduce performance overhead or to provide more detailed data. The system configuration specifies which parts of the application are going to be monitored by selecting an application's call trees and levels within these call trees.
DProf is based on the Kieker framework and the JMX technology. It can be used for adaptive and reconfigurable continuous monitoring of Java EE applications, as presented in this paper. Use of Kieker grants low overhead. Separation of monitoring code from application code and source code instrumentation is performed by using aspect-oriented programming (AOP) [9]. We have developed additional components in order to allow an adaptive reconfiguration of monitoring parameters at runtime, i.e., while the application is running. JMX is used for controlling the monitoring process at runtime. Together with the DProfSLA schema, DProf can be used to monitor SLAs compliance and to localize the root cause of problems.
Details of our approach are presented in Section 2.1. In Section 2.2 we describe the DProfSLA XML schema. An overview of the underlying Kieker framework is given in Section 2.3. Section 2.4 presents architecture and some implementation details of the DProf system.
2.1. The DProf Approach
User Analyzer AnalyzerThread Kieker+DProf
[no]
[yes]
[no]
[yes]
Application start
Analyzer configuration
and start
Call tree creation
Call tree analysis call tree
anomaly number to large
results in accordance with
SLA
New parameters creation and sending Analyzer thread
creation and configuration
Data gathering monitoring records
Monitoring with old parameters
Monitoring with new parameters
monitoring parameters
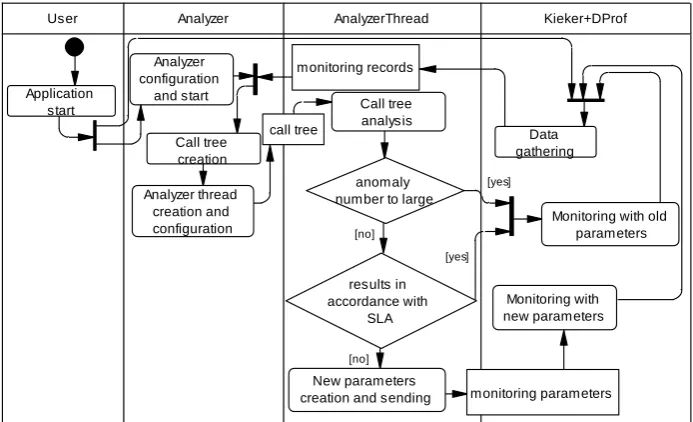
Fig. 2. Activity diagram of the DProf monitoring system
On application startup, with the initial monitoring parameters specified in the aop.xml, the DProf system is started simultaneously. It gathers monitoring data during application execution. Periodically, obtained performance data is being sent for analysis. The Analyzer reconstructs call trees based on monitoring data. These trees are analyzed by the AnalyzerThreads, each thread analyzing one tree in parallel to speed up analysis. A call tree represents methods that are invoked after one client call to the application. Each method invocation in the stack trace is represented with one node of the tree.
For the analysis we use the R [10] programming language and environment for statistical computing. We use the extremevalues [11] package to detect and remove outliers that we consider temporary effects caused by various external factors: class loading, starting of some resource-consuming process in the background while the monitored application is running, hardware glitches, etc. After outlier removal, the remaining values are processed using the specified statistical function and compared to the required value as defined in the SLA. Depending on the result of the comparison, new monitoring parameters are generated. If the number of outliers exceeds the value defined in DProfSLA, monitoring is repeated with old parameters.
Localization
1. Recording normal results – this is used to determine nominal values for SLAs. No changes in monitoring parameters are assumed in this case.
2. Finding which software component does not conform to the SLAs – in the SLAs we provide nominal values for nodes in call trees we want to be monitored.
3. Finding which software component consumes the largest amount of resources.
Using the DProf system, developers cannot only find which method causes problems, but also in which context the problems occur. Since the communication between the Analyzer and the components that are gathering the data is implemented using web services, this component can be used for receiving and analyzing monitoring records from applications developed for platforms other than Java/Java EE. In order to use this system with some other platform, such as .NET, adapters for the monitoring subsystem and the management interface are required.
SLA Compliance Monitoring and Problem Localization
In order to provide desired values for SLA, the application is monitored using the first configuration from the previous section (recording of normal results). Branches omitted from the SLAs are not monitored.
DProf starts with monitoring the top levels specified. If a problem is detected in one of the call trees, DProf triggers a reconfiguration to include monitoring of the next level of that tree. It will proceed down the tree as long as there is a discord with SLAs. The last node with values higher than those in SLA is declared the source of the problem.
Localization of Increased Resource Consumption
In the DProfSLA document we specify which call trees are to be monitored. For each call tree, the Analyzer configures the monitoring system to gather data only from the top level. In the next iteration, it finds the tree with the highest observed value (that is a root element of that tree). In the next iteration, the monitoring system is reconfigured to monitor only that call tree's first two levels. This process is repeated further down the tree (if those levels exist). Through the process, DProf selects the branches with the highest observed values. The process ends as soon as the instrumentation reaches the bottom of the call-tree, or when observed values for the node on the higher level are greater than the values for its child nodes.
2.2. DProfSLA Schema
agreement), CallTreeNode (call-traces to be monitored) and Timing (time constraints of this agreement).
The Parties element represents the parties involved in the agreement. This element has two sub elements: service provider (Provider) and service consumer (Consumer). Both of these sub elements contain contact data regarding the service provider and service consumer respectively. Each sub element is represented using the OrganizationType complex type (not detailed here).
Fig. 3. A part of the DProfSLA schema with the root element
Selection of Call Trees to be Monitored
Each CallTreeNode element represents performance information for a single node in the call tree to be monitored. It is of the CallTreeNodeType complex type shown in Fig. 4.
CallTreeNodeType elements have two mandatory attributes, a name and a metric. The name attribute is used to specify a part of the application to be monitored. The string representation of a call tree is used for this purpose. The metric attribute specifies the performance metric to be used, i.e., which aspect of application performance is going to be monitored (e.g., response time, memory consumption). Sub elements of this element are other sub call trees, e.g., sub traces that are invoked from the parent CallTreeNode element.
Localization
Fig. 4.CallTreeNodeType complex type defined in the DProfSLA schema
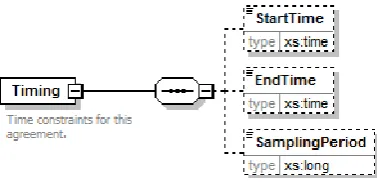
Fig. 5.Timing sub element in the DProfSLA schema
Specification of Timing Constraints
The Timing element (Fig. 5) is used to specify time constraints for this agreement. The sub elements StartTime and EndTime define the period this document applies to. The SamplingPeriod element denotes the time period (in milliseconds) between two analyses runs, possibly resulting in a reconfiguration of monitoring parameters.
Example DProfSLA Document
1 <DProfSLA>
2 <Parties><Provider name="Org1" />
3 <Consumer name="Org2" /></Parties> 4 <CallTreeNode metric="avgExecutionTime"
5 name="ClassA.methodA,[{ ClassB.methodB1,[]} ,
6 {ClassB.methodB2,[]}]" upperThreshold="350"> 7 <CallTreeNode metric="avgExecutionTime" name="[{ 8 ClassB.methodB1,[]}]" upperThreshold="150"/> 9 <CallTreeNode metric="avgExecutionTime" name="[{ 10 ClassB.methodB2,[]}]" upperThreshold="150"/> 11 </CallTreeNode>
12 <Timing><SamplingPeriod>600000</SamplingPeriod></Timing>
13 </DProfSLA>
Listing 1. DProfSLA document for this example
It represents an agreement between the parties Org1 and Org2. Response times are monitored to detect values exceeding the specified upperThreshold attribute. Every 10 minutes (600,000 ms), an analysis of the obtained results is performed.
In the first iteration the system only monitors monitorA(). If the obtained results show that the response times of methodA() exceed the upper threshold, monitoring of methodB1() and methodB2() is turned on. After the next 10 minutes, if results show that either methodB1() or methodB2() takes too long, it will have to be analyzed manually. Otherwise, the program code in methodA() is assumed to be the cause of the problem.
2.3. Kieker Framework
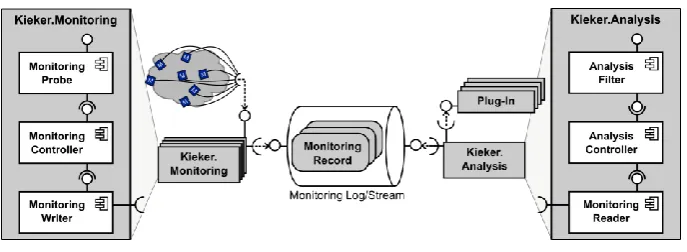
The Kieker framework is structured into the Kieker.Monitoring and the Kieker.Analysis components [3]. The Kieker.Monitoring component collects and stores monitoring data. The Kieker.Analysis component performs analysis and visualization of the monitoring data. The core components of the Kieker framework are depicted in Fig. 6, and described in the remainder of this section.
Localization
[13]. Additionally, users can implement and use their own writers, as we did for DProf. The Monitoring Controller component controls the work of this part of the framework.
The data in the Monitoring Log/Stream is analyzed by the Kieker.Analysis component. A Monitoring Reader reads records from the Monitoring Log/Stream and forwards them to a pipe-and-filter configuration of Analysis Filters. Filters may, for example, analyze and visualize gathered data. Control of all components in this part of the Kieker framework is performed by the Analysis Controller component.
Fig. 6. Component diagram of the Kieker monitoring framework
2.4. DProf System Architecture
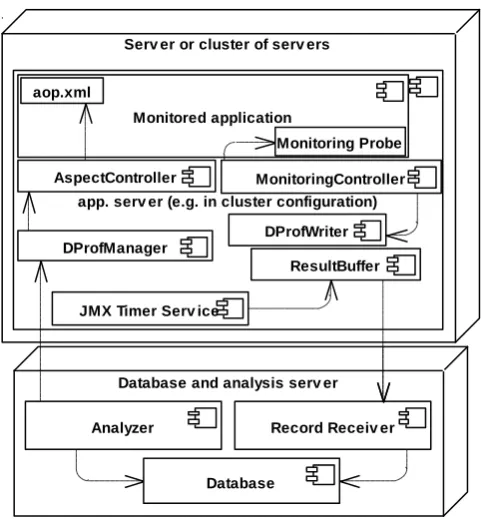
We have implemented our approach using Java technology. The DProf system uses Kieker's infrastructure for data acquisition, extended by some additional components. The architecture of DProf system and its integration with Kieker are shown in Fig. 7.
The DProf components are divided into two groups: i) components that participate in recording monitoring data; and ii) components that analyze the obtained data and control the reconfiguration of monitoring parameters.
The DProfWriter is the new Monitoring Writer used. It sends Monitoring Records to the ResultBuffer component. The ResultBuffer periodically sends data to the RecordReceiver component, which, in turn, stores data into the relational database. The combination of ResultBuffer, RecordReceiver, and database plays the role of the Monitoring Log/Stream (Section 2.3).
Serv er or cluster of serv ers
app. serv er (e.g. in cluster configuration) Monitored application
Database and analysis serv er
Database
Record Receiv er Analyzer
JMX Timer Serv ice aop.xml
Monitoring Probe
DProfManager
AspectController MonitoringController
DProfWriter
ResultBuffer
Fig. 7. Deployment diagram of the DProf system
Kieker includes the monitoring record type OperationExecutionRecord that is used to store timing and trace information for method executions. We have developed the new Monitoring Record type DProfMonitoringRecord, which extends Kieker's original OperationExecutionRecord and additionally provides the otherData attribute. This attribute is used to store additional information, e.g. CPU utilization and memory consumption. When the record is created in the probe, the attribute is filled with comma-separated key-value pairs, depending on what the given monitoring aspect measures. Keys in this list correspond to metrics defined in the SLA document. This allows us to use this single Monitoring Record class for monitoring different metrics.
The RecordReceiver receives the data from the ResultBuffer. It is implemented as a web-service, and it stores records into a database table.
Localization
Code instrumentation can be performed by hard-coding instrumentation routines into program code, but a more elegant way is AOP . AOP provides developers with separation of concerns: monitoring aspects are developed separately from application code.
Using AOP, we can choose to weave aspects with code upon compilation or to let the aspect runtime weave aspects into classes upon class loading. These processes are known as compile-time-weaving and load-time-weaving. When using DProf, we usually want to change monitoring parameters at runtime, so we use load-time-weaving. If we monitor, without having to change monitoring parameters at runtime, we can use compile-time weaving. The advantage of using compile-time-weaving is only a faster application start; afterwards both compile- and load-time-weaved applications behave the same.
The DProf system uses the AspectJ AOP implementation for Java [14], for instrumentation. Initially, the AspectJ configuration file (aop.xml) specifies which parts of the application are to be included/excluded from monitoring, and which aspect to use as monitoring probes. During monitoring with the DProf system, additional clauses will be placed in this configuration file for the purpose of monitoring adaptation.
In the Java environment, time is usually measured using either System.currentTimeMillis() or System.nanoTime() calls [15]. Measuring of system-level metrics (such as memory consumption and CPU utilization), can be performed using platform MXBeans [4] or some third-party tools such asSIGAR [16].
3.
Evaluation of the DProf System
The application of the DProf system will be demonstrated using the software configuration management (SCM) application described in our previous work [17]. SCM is a Java EE application responsible for tracking of applications and application versions in a company.
The goal is to monitor method response times and to localize the root cause of performance problems. Initially, DProf is configured to monitor only methods at the root of call trees. If an increase in method response times is detected, DProf will, potentially successively, reconfigure the instrumentation to monitor other levels, until it localizes the method that causes the problem.
3.1. Setting
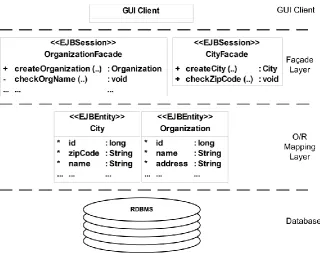
The application is implemented using Enterprise JavaBeans (EJB) [18] technology. Entity EJBs are used for communication with databases, i.e., for object/relational (O/R) mapping [19]. They are accessed through stateless session EJBs (SLSB), modeled according to the façade design pattern [20]. SLSBs are annotated to work as JAX-WS [21] web services as well. We deployed SCM on a cluster of servers. The application client is a Java Swing [22] application.
Figure 8. shows a part of the application's architecture.
Fig. 8. A part of the monitored SCM application's architecture
Methods that are to be monitored are annotated with Kieker's @OperationExecutionMonitoringProbe. As a monitoring probe we used a Kieker's original OperationExecutionAspectAnnotation probe. It intercepts executions of annotated methods.
Localization
$
3. 2.
4. 5.
1. SRV::
@3:..OrganizationFacade .createOrganization()
SRV::
@2:..OrganizationFacade .checkOrgName() SRV::
@2:..City .getId()
SRV:: @1:..Organization
.getId()
SRV:: @1:..Organization
.getAddress()
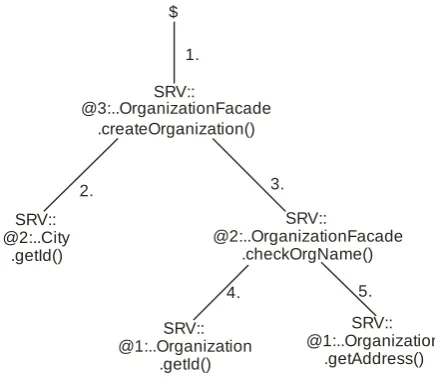
Fig. 9. The call tree monitored in this example
The testing was performed by repeatedly invoking the OrganizationFacade.createOrganization() method from 100 concurrent threads, with equally distributed think times between 0 and 10 seconds.
The analysis of the obtained data is performed every hour. Initially, only the createOrganization(..) method is monitored. After a deviation from values specified in the DProfSLA (last row in Table 1.) is detected, the methods invoked from this one are monitored additionally. If these methods do not violate the SLAs, the problem is assumed to be in the createOrganization(..) method. If the results for the checkOrgName(..) show deviations, monitoring is
reconfigured to include the Organization.getId() and
Organization.getAddress() methods, and to exclude the method City.getId(). The most likely cause of the problem is the method whose results do show deviation from expected response times, while methods invoked from it do not.
Within the checkOrgName() method, we purposly inserted a delay of 1 ms, to simulate a problem. In order to determine the impact of DProf on the monitored application, we measured response times on the client computer.
3.2. Analysis of Results
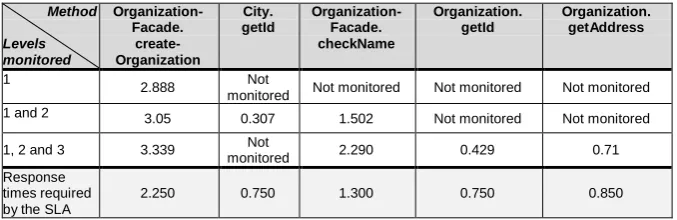
The analysis of the gathered data, one hour after the previous analysis, showed that an response time of the checkOrgName(..) method rose over designated values. The Analyzer then included the monitoring in the third level, i.e., the methods Organization.getId() and Organization.getAddress(). The obtained results are shown in Table 1.
Table 1. The average response times of monitored methods in milliseconds
Method
Levels monitored
Organization-Facade.
create-Organization
City. getId
Organization-Facade. checkName
Organization. getId
Organization. getAddress
1
2.888 Not
monitored Not monitored Not monitored Not monitored
1 and 2 3.05 0.307 1.502 Not monitored Not monitored
1, 2 and 3 3.339 Not
monitored 2.290 0.429 0.71
Response times required by the SLA
2.250 0.750 1.300 0.750 0.850
Organization.createOrganization(..) has increased response time because of the OrganizationFacade.checkOrgName(..). In turn, increased results of OrganizationFacade.checkOrgName(..) are not caused by the executions of the Organization.getId(...) and Organization.getAddress(...) methods.
Based on these results, it can be concluded that the checkOrgName(...) method requires further inspection in order to be made compliant in accordance to the SLA. This means that our system has been able to localize the method which causes the problem.
Overhead analysis
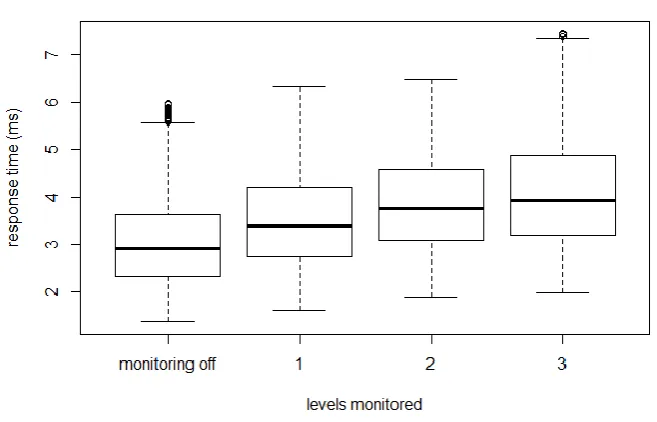
In order to estimate overhead we measured response times on the client side. A comparison of these times is shown in Fig. 10. The median response time of the monitored method, when monitoring is disabled, was 3.078 ms. By enabling monitoring of the call tree's first level, it increased to 3.535 ms. Monitoring of the second level generated additional 0.344 ms (it increased to 3.879 ms). Inclusion of monitoring of the third level led to average response time of 4.133 ms.
Localization
Fig. 10. Comparison of response times of the Organisation.createOrganisation(…) method in different scenarios
The obtained results are also in accordance to Kieker overhead analysis shown in [3]. Further comparison with Kieker's writers is shown in Fig. 11. We compared response times of the monitored application in different monitoring configurations: with no monitoring, when using DProf with and without sending data to the ResultBuffer, and when Kieker's original SyncFSWriter and SyncDBWriter are used.
The DProf system has lower overhead than Kieker's original SyncFSWriter and SyncDBWriter, which write records into file system and database, respectively. This is because in DProf, communication between the writer and the buffer is performed within one JVM.
Based on these results, it can be concluded that this system is suitable for continuous monitoring of all kinds Java applications. It provides valuable data on application execution with very small impact on application performance.
4.
Related Work
For the research presented in this paper two fields are of particular importance: monitoring tools (which are presented in Section 4.1) and existing standards for SLA documents definition (Section 4.2).
4.1. Application Monitoring and Profiling Tools
Monitoring and profiling tools have been in use since the early 1970s. The UNIX operating system includes the prof tool [23] since 1979. It can record execution times for each program function. ATOM [24] was one of the first to use source code instrumentation and it appeared in the 1990s. Before application deployment, ATOM combines the instrumentation and the application code. The application executes normally, with additional output containing monitoring data.
Localization
A number of commercial application monitoring tools exist, but implementation details of these tools are scarce at best, if available at all. DynaTrace [33] uses its own PurePath technology which captures timing and context information for transactions across all application tiers. It has support for both Java and .NET environments. JXInsight [34] is designed for monitoring applications in JEE environments. It offers automatic performance analysis and problem detection. IBM's Tivoli Management Framework [35] is a system management platform. It is CORBA-based and allows remote management of software. IBM Tivoli Monitoring, which uses the Tivoli framework, is a set of tools which can be used for problem detection in various environments. Tivoli supports monitoring of JavaEE (WebSphere server), .NET, network (DNS, DHCP) and others. Both agent and agentless monitoring are supported. AppDynamics provides solutions for monitoring on different platforms, with low overhead [36]. It supports the automatic localization of problem root causes. Monitoring tools for other purposes exist as well, e.g., Nagios [37] for infrastructure monitoring, CA Unicenter [38] for infrastructure and application performance monitoring and management, or HP's Insight [39] for monitoring and problem localization on some specific platforms.
Newman et al. present the MonALISA system [40] which constitutes a distributed monitoring service. It is implemented using Java and WSDL/SOAP technologies. MonALISA allows for monitoring of heterogeneous systems using autonomous agent based sub-systems. A graphical user interface visualizes complex gathered data. MonALISA includes a library of APIs that can be used to send data to MonALISA services. Using these APIs, other systems, such as DProf can be included in the monitoring process.
AOP can be used for instrumentation of code. Separation of concerns allows for monitoring code to be separated from application code. There are several monitoring tools based on AOP.
The concept of manageable aspects–a combination of aspects and JMX MBeans–is proposed by Liu et al. [41]. It can be used as monitoring probes, for instrumentation and collecting runtime data during software execution. They can be accessed and controlled using any JMX console. Although this approach would present an excellent platform for adaptive monitoring, no implementation of this concept has been provided, yet.
The HotWave framework [42], which is still in development phase, allows run-time reweaving of aspects and the creation of adaptive monitoring scenarios. It allows for a development of adaptable monitoring solutions, as presented by the authors. Users can choose parts of the application to be monitored, and later reconfigure the system to monitor other parts, without having to restart the system. Unfortunately, no implementation of this framework is currently available.
to specify rules for adapting the instrumentation based on the anomaly scores and the current instrumentation. In our earlier work [45], we presented an approach for automatic problem localization based on a correlation of anomaly scores with architectural calling dependencies. Kieker was also used in this approach. However, the monitoring was not adaptive.
Yu et al. [46] present the RaceTrack tool for race detection in .NET applications. This tool monitors program activity and looks for suspicious patterns in program execution. It has great accuracy because it monitors memory access at both object and field level. It starts by monitoring at object level, and only if unusual patterns are detected, it switches to field level. This way, performance overhead is reduced. The RaceTrack is implemented by modifying .NET’s virtual machine CLR (common language runtime). Such modification requires great understanding of how CLR works. If some changes are made in the future, it would probably require modifications on this tool. Also, the modified CLR has to be distributed with the application that is to be monitored, instead of, for example, just starting a tool within existing CLR.
Chen et al. [47] propose the Pinpoint system that locates components most likely to cause a fault. The approach is based on finding correlations between low-level faults and high-level problems. Data is gathered by collecting client traces using a modified Java EE platform. Unlike our approach, this approach focuses more on problem localization and less on performance problems.
A black box approach to problem localization is applied by some of the authors. This approach usually finds a component that is causing problems, but does not locate the problem within component. Aguilera et al. [48] use an approach that monitors message communication between components and tries to find causal paths between messages and performance problems. The PeerPressure tool presented by Wang et al. [49] compares "healthy" and "suspicious" machines using statistical methods to locate problems.
Very few papers provide actual numbers regarding overhead. Dimitriev [29] tested JFluid’s performance with SPECjvm98 tool [50]. Results show that overhead ranges from 1% for time consuming tasks like database access, to 5000% for compress tasks. JFluid allows users to reduce overhead by selecting the parts of an application to monitor. Govindraj et al. [51] discuss a possibility of using AOP for monitoring and they show the overhead ranges from 1-10%. For DynaTrace the monitoring overhead is reported to be less than 5%. However, these percentages are hardly comparable because they heavily depend on hardware and software used in the benchmarks, and especially they depend on the granularity of instrumentation and the usage profile.
4.2. SLA Standards
Localization
informal language. Tebbani et al. propose the GSLA (Generalized Service Level Agreement) language. A GSLA document constitutes a contract signed between two or more parties designed to create a measurable common understanding of each party’s role. The role is nothing but the set of rules which defines the minimal service level expectations and obligations the party has. GXLA is the XML schema which implements the GSLA information model. GXLA documents are composed of the following sections: schedule (temporal parameters of the contract), party (models involved parties), service package (an abstraction used to describe services) and role (as described). The use of GXLA supports an automation of the service management process.
WSLA [53] is a language to specify service levels for web services. XML-based WSLA documents define the involved parties, metrics, measuring techniques, responsibilities, and courses of action. The authors state that every SLA language, such as WSLA, should support contain 1) information regarding the agreeing parties and their roles, 2) SLA parameters and a measurement specification as well as 3) obligations for each party.
SLAng [54] is a language for specifying SLAs based on the Meta Object Facility [55]. It can use different languages for describing constraints, e.g., utilizing OCL [44] or HUTN [56].
The WS-Agreement specification language [57] has been approved by the Open Grid Forum. It defines a language for service providers to offer capabilities and resources, and clients to create an agreement with that provider.
Paschke et al. [58] propose a categorization scheme for SLA metrics with the goal to support the design and implementation of SLAs that can be monitored and enforced automatically. Standard elements of each SLA are categorized as: technical (service descriptions, service objects, metrics, and actions), organizational (roles, monitoring parameters, reporting, and change management), and legal (legal obligations, payment, additional rights, etc.). Paschke et al. categorized service metrics in accordance with standard IT objects: hardware, software, network, storage, and help desk. SLAs are grouped according to their intended purpose, scope of application, or versatility.
5.
Conclusion
This paper presented the DProf approach for continuous and adaptive monitoring of distributed software systems and automatic evaluation of software performance against expected values defined in service level agreements (SLAs). The DProf system gathers data from application execution, compares these measurements with the SLAs and, based on call tree analysis, aims it localizes application components causing possible SLA violations. Expected values are defined in a document based on the described DProfSLA XML schema. The schema is designed with existing SLA schemas, such as GXLA and WSLA, and their categorizations of contained information in mind. DProfSLA’s intended use is for standard intra-organizational agreements, but it may be used for inter-intra-organizational agreements, too. The schema supports various metrics and additional metrics can be added as needed.
The DProf monitoring system is mainly designed for continuous monitoring of JEE applications, but with minor modifications it can be used to monitor applications developed for other platforms. We described the architecture of our DProf prototype, whose implementation is based on the Kieker framework with additional JMX-based components.
As a proof-of-concept, the DProf system was used for adaptive monitoring of a sample Java EE application. The analysis of obtained results shows low monitoring overhead, and reduced overhead by enabling monitoring on-demand.
Our system is not able to differentiate between call trees with the same root element, that can have different lower nodes. In this case the system could report incorrect results. In order to confront this issue, developers should choose to monitor only one of these trees, and exclude the other using an appropriate aop.xml configuration file.
Our future work regarding DProf will focus on the implementation of the DProf Analyzer as a Kieker plugin and an integration of the DProf component into the Kieker distribution. We also plan to further extend the system by additional monitoring probes for different and more complex measures. Furthermore, we will work on more advanced algorithms for the Analyzer component, enabling it to change monitoring parameters on different computers in distributed environments.
References
1. Benyon, R.: Service Agreements: A Management Guide. Van Haren Publishing, Netherlands. (2006)
Localization
3. Hoorn, A. v., Hasselbring, W., Waller, J.: Kieker: A Framework for Application Performance Monitoring and Dynamic Software Analysis. Proceedings of the 3rd ACM/SPEC International Conference on Performance Engineering (ICPE 2012). ACM, Boston, Massachusetts, USA. To appear. (2012)
4. Ammons, G., Ball, T., Larus, J. R.: Exploiting Hardware Performance Counters With Flow and Context Sensitive Profiling. In Proceedings of the ACM SIGPLAN Conference on Programming Language Design and Implementation (PLDI '97). ACM, Las Vegas, Nevada, USA. 85-96. (1997)
5. Sullins, B. G., Whipple, M. B.: JMX in Action. Manning Publications, USA. (2002) 6. Okanović, D., van Hoorn, A., Konjović, Z., Vidaković, M..: Towards Adaptive
Monitoring of Java EE Applications. In Proceedings of the 5th International Conference on Information Technology (ICIT 2011). Al-Zaytoonah University of Jordan, Amman, Jordan. CD. (2011)
7. Okanović, D., Vidaković, M. : Performance Profiling of Java Enterprise Applications. In Proceedings of the International Conference on Internet Society Technology and Management (ICIST 2011). Information Society of Serbia, Kopaonik, Serbia. CD. (2011)
8. Okanović, D., Konjović, Z., Vidaković, M.: Continuous Monitoring System For Software Quality Assurance. In Proceedings of XV International Conference on Industrial Systems (IS'11). University of Novi Sad, Novi Sad, Serbia, 193-198. (2011)
9. Kiczales, G., Lamping, J., Mendhekar, A., Maeda, C., Lopes, C., Loingtier, J-M., Irwin, J., Aspect-Oriented Programming. In Proceedings of the European Conference on Object-Oriented Programming. Springer, Jyväskylä, Finland. 220– 242. (1997)
10. R Development Core Team. R: A language and Environment for Statistical Computing. R Foundation for Statistical Computing, Vienna, Austria. (2010) 11. extremevalues: Univariate Outlier Detection. Mark van der Loo. (2011) [Online]
Available: http://cran.r-project.org/web/packages/extremevalues/ (current September 2011)
12. XMLSpy. Altova. [Online] Available: www.altova.com/xmlspy.html (current April 2012)
13. JSR-000914 JavaTM Message Service (JMS) API. Java Community Process. [Online] http://jcp.org/aboutJava/communityprocess/final/jsr914/index.html (current March 2012)
14. The AspectJ Project. Eclipse Foundation. [Online] http://www.eclipse.org/aspectj/ (current April 2012)
15. Lambert, J. M., Power, J. F.: Platform Independent Timing of Java Virtual Machine Bytecode Instructions. Electronic Notes in Theoretical Computer Science, Vol. 220. Elsevier Science Publishers, Amsterdam, Netherlands, 97-113.(2008) 16. Hyperic SIGAR API. Hyperic. [Online] http://www.hyperic.com/products/sigar
(current April 2012)
17. Okanović, D., Vidaković, M.: One Implementation of the System for Application Version Tracking and Automatic Updating. In Proceedings of the IASTED International Conference on Software Engineering 2008. ACTA Press, Innsbruck, Austria. 62–67. (2008)
18. EJB 3.0. [Online] Available: http://java.sun.com/products/ejb/ (current April 2012) 19. Barry, D., Stanienda, T.: Solving the Java Object Storage Problem. Computer, Vol.
31, No.11, 33-40. (1998)
21. Kalin, M.: Java Web Services: Up and Running. O'Reilly Media, Sebastopol, California, USA. (2009)
22. Java Swing. Oracle. [Online] Available: http://java.sun.com/javase/ 6/docs/technotes/guides/swing (current April 2012)
23. Unix Programmer's Manual. Section 1, Bell Laboratories, Murray Hill, NJ. (1979) 24. Srivastava, A., Eustace, A.: ATOM: A System for Building Customized Program
Analysis Tools. In Proceedings of the ACM SIGPLAN 1994 Conference on Programming Language Design and Implementation. ACM, Orlando, Florida,USA. 196-205. (1994)
25. Snatzke, R. G.: Performance survey 2008. (2008). [Online]. Available: http://www.codecentric.de/export/sites/homepage/__resources/pdf/studien/perform ance-studie.pdf (current April 2012)
26. Java Virtual Machine Tool Interface (JVMTI). Oracle. [Online] Available: http://download.oracle.com/javase/6/docs/technotes/guides/jvmti/ (current April 2012)
27. Java Virtual Machine Profiler Interface (JVMPI). Oracle. [Online] Available: http://download.oracle.com/javase/1.4.2/docs/guide/jvmpi/jvmpi.html (current April 2012)
28. JBoss Profiler. JBoss Community team. [Online] Available: www.jboss.org/jbossprofiler (current April 2012)
29. Dimitriev, M.: Design of JFluid. Technical Report SERIES13103, Sun Microsystems Inc., USA. (2003)
30. JBoss Application Server. JBoss Community team. [Online] http://www.jboss.org/jbossas (current April 2012)
31. NetBeans. [Online] Available: http://netbeans.org/index.html (current September 2011)
32. Parsons, T., Mos, A., Murphy, J.: Non-Intrusive End-to-End Runtime Path Tracing for J2EE Systems. IEEE Proceedings – Software, Vol. 153, No. 4, 149–161. (2006)
33. dynaTrace – Continuous application performance management. dynaTrace software Inc. [Online] Available: http://www.dynatrace.com/ (current April 2012) 34. JXInsight. JInspired. [Online] Available: http://www.jinspired.com/
products/jxinsight/ (current April 2012)
35. IBM - Monitoring Software - Tivoli Monitoring. IBM. [Online] http://www-01.ibm.com/software/tivoli/products/monitor/ (current April 2012)
36. AppDynamics. [Online] Available: http://www.appdynamics.com (current March 2012)
37. Nagios. [Online] Available: http://www.nagios.org (current March 2012)
38. Application Performance Management. CA Technologies. [Online] Available: http://www.ca.com/us/application-performance-management.aspx (current April 2012)
39. HP Systems Insight Manager. Hewlett-Packard. [Online] Available: http://h18013.www1.hp.com/products/servers/management/hpsim/index.html?jum pid=go/hpsim (current April 2012)
40. Newman, H. B., Legrand, I. C., Galvez, P., Voicu, R., Cirstoiu, C.: MonALISA : A Distributed Monitoring Service Architecture. In Proceedings of the Conference for Computing in High-Energy and Nuclear Physics. La Jolla, California, USA. 8pp. (2003)
Localization
42. Villazón, A., Binder, W., Ansaloni, D., Moret, P.: HotWave: Creating Adaptive Tools With Dynamic Aspect-Oriented Programming in Java. In Proceedings of the 8th International Conference on Generative Programming and Component Engineering (GPCE ’09). ACM, Denver, Colorado, USA. 95–98. (2009)
43. Ehlers, J., van Hoorn, A., Waller, J., Hasselbring, W.: Self-Adaptive Software System Monitoring for Performance Anomaly Localization. In Proceedings of the 8th IEEE/ACM International Conference on Autonomic Computing (ICAC 2011). ACM, Karlsruhe, Germany. 197-200. (2011)
44. Object Constraint Language (OCL) 2.0. OMG. [Online] Available: http://www.omg.org/spec/MOF/2.0 (September 2011)
45. Marwede, N., Rohr, M., van Hoorn, A., Hasselbring, W.: Automatic Failure Diagnosis Support in Distributed Large-Scale Software Systems Based on Timing Behavior Anomaly Correlation. In Proceedings of the 2009 European Conference on Software Maintenance and Reengineering (CSMR '09). IEEE Computer Society, Kaiserslautern, Germany. 47-58. (2009)
46. Yu, Y., Rodeheffer, T., Chen, W.: RaceTrack: Efficient Detection of Data Race Conditions via Adaptive Tracking. In Proceedings of the ACM Symposium on Operating Systems Principles. ACM, Brighton, UK. 221-234. (2005)
47. Chen, M., Kiciman, E., Fratkin, E.., Fox, A., Brewer, E.: Pinpoint: Problem Determination in Large Dynamic Systems. In Proceedings of 2002. International Conference on Dependable Systems and Networks. IEEE Computer Society, Washington DC, USA. 595-604. (2002)
48. Aguilera, Mogul, J., Wiener, J., Reynolds, P., Muthitacharoen, A.: Performance Debugging for Distributed Systems of Black Boxes. In Proceedings of the 19th ACM symposium on Operating systems principles. ACM, Bolton Landing, New York, USA. 74-89. 2003.
49. Wang, H., Platt, J., Chen, Y., Zhang, R., Wang, Y.: PeerPressure for Automatic Troubleshooting. In Proceedings of the Joint International Conference on Measurement and Modeling of Computer Systems. ACM, New York, New York, USA. 398-399. (2004)
50. SPECjvm98. Standard Performance Evaluation Corporation. (1998) [Online] Available: http://www.spec.org/jvm98/ (current 12 September 2011)
51. Govindraj, K., Narayanan, S., Thomas, B., Nair, P., Peeru, S.: On using AOP for Application Performance Management. In Industry Track Proceedings of the 5th International Conference on Aspect-Oriented Software Development. ACM, Bonn, Germany. (2006)
52. Tebbani, B., Aib, I.: GXLA a Language for the Specification of Service Level Agreements. Lecture Notes in Computer Science, Vol. 4195. Springer-Verlag, Berlin Heidelberg New York, 201-214. (2006)
53. Keller, A., Ludwig, H.:The WSLA Framework: Specifying and Monitoring Service Level Agreements for Web Services. Journal of Network and Systems Management, Vol. 11, No. 1, 57-81. (2003)
54. Lamanna, D., Skene, J., Emmerich, W.: SLAng: A Language for Defining Service Level Agreements. In Proceedings of the 9th IEEE Workshop on Future Trends of Distributed Computer Systems (FTDCS '03). IEEE Computer Society, San Juan, Puerto Rico. 100-107. (2003)
55. Meta Object Facility (MOF) 2.0 Core Specification. OMG. [Online] Available: http://www.omg.org/spec/MOF/2.0 (current September 2011)
57. Oldham, N., Verma, K., Sheth, A., Hakimpour, F.: Semantic WS-agreement partner selection. In Proceedings of the 15th International Conference on World Wide Web. ACM, Edinburgh, Scotland, UK. 697-706. (2006)
58. Paschke, A., Schnappinger-Gerull, E.: A Categorization Scheme for SLA Metrics. In Proceedings of Multi-Conference Information Systems. Passau, Germany. (2006)
Dušan Okanović is a teaching assistant and PhD student atthe Faculty of
Technical Sciences, Novi Sad, Serbia. He received his Bachelor degree (2002) and Masters degree (2006), both in Computer Science from the University of Novi Sad, Faculty of Technical Sciences. His research interests include application management, performance management and distributed applications development. Since 2003 he has been with Faculty of Technical Sciences where he was teaching where he participated in several science projects and published 25 scientific papers. His research interests are web and internet programming, distributed applications, application management, and performance management. He can be contacted at: [email protected].
André van Hoorn is a research assistant and PhD student with the Software
Engineering Group at the University of Kiel, Germany. He received his Diploma (Master equivalent) degree in Computer Science from the University of Oldenburg, Germany (2007). From 2008 to 2010, André was member of the Graduate School on Trustworthy Software Systems (TrustSoft) at the University of Oldenburg, where he was holding a PhD scholarship from the German Research Foundation (DFG). Since 2011, he works in the collaborative research project DynaMod on dynamic analysis for model-driven software modernization. His research interests include architecture-based and model-driven software performance engineering, self-adaptation, and reengineering. He published more than 20 scientific papers. André can be contacted at: [email protected].
Zora Konjović has been holding the full professor position at the Faculty of
Localization
Milan Vidakovic received the BSc, MSc and PhD degrees in electrical
engineering from the Faculty of Technical Sciences, University of Novi Sad, in 1995, 1998 and 2003 respectively. He is a professor at Computing and Control Department, University of Novi Sad. He participated in several science projects and published more than 60 scientific and professional papers. His research interest covers web and internet programming, distributed computing, software agents, embedded systems, and language
internationalization and localization. He can be contacted
at: [email protected].