Bansode et al Journal of Drug Delivery & Therapeutics. 2019; 9(2-s):451-461
Available online on 15.04.2019 at http://jddtonline.info
Journal of Drug Delivery and Therapeutics
Open Access to Pharmaceutical and Medical Research
© 2011-18, publisher and licensee JDDT, This is an Open Access article which permits unrestricted non-commercial use, provided the original work is properly cited
Open Access
Research Article
Formulation, development and evaluation of Microsponge loaded Topical
Gel of Nystatin
* Ashwini S Bansode
1, Vaishnavi B Kute
1, Komal S Vethekar
1, Priyanka S Kote
1, Monika K Varhadi
1, Ajit S
Bansode
1, Suresh L Jadhav
1, Nitin V Devhadrao
2.
VJSM’S Vishal Institute of pharmaceutical Education & Research, Ale, Junnar, (Pune), 412411, India Shadradchandra Pawar College of Pharmacy, Dumbarwadi, Otur, Pune.412409, India
ABSTRACT
Nystatin containing microsponge as active constituent (API) in different formulations by changing the proportions of drug (Nystatin), polymer (ethyl cellulose), emulsifier (Poly vinyl alcohol) were obtained successfully using quasi-emulsion solvent diffusion method. These formulations were studied for particle size and physical characterization. Scanning electron microscopy (SEM) images showed the microspong es porous and spherical in shape. The physical characterization showed that microsponge formulation coded by P6 showed a better loading efficiency and production yield. This microsponge formulation was prepared as gel in carbopol and studied for pH, viscosity, spreadability, drug content, in-vitro release. The microsponge formulation gel, F3 showed viscosity3465.84cps, spreadability of 26.22g cm/s and drug content of 89.65%. The nystatin microsponge gel formulations showed an appropriate drug release profile. F3 released 81.03% of drug at 12 hours.
Keywords: Microsponge, Solvent diffusion method, Scanning electron microscope, Nystatin microsponge gel.
Article Info:Received 28 Feb 2019; Review Completed 09 April 2019; Accepted 13 April 2019; Available online 15 April 2019
Cite this article as:
Bansode Ashwini S, Jadhav SL, Kute VB, Vethekar KS, Kote PS, Varhadi MK, Bansode Ajit S, Formulation, development and
evaluation of microsponge loaded topical gel of nystatin, Journal of Drug Delivery and Therapeutics. 2019; 9(2-s):451-461
http://dx.doi.org/10.22270/jddt.v9i2-s.2567
*Address for Correspondence:
Ashwini S Bansode, VJSM’S Vishal Institute of pharmaceutical Education & Research Ale, Junnar, (Pune), 412411
INTRODUCTION
A microsponge delivery system (MDS) is, highly cross-linked, porous, polymeric system consisting of porous microspheres that can entrap wide range of actives and then release them over a time and in response to trigger.1,2,3 Moreover, they
may enhance stability, reduce side effect and modify drugrelease favorably. Microsponges are polymeric delivery systems composed of porous microspheres of an inert polymer that can entrap active ingredients and control their delivery rate. The size of these microsponges can be varied, usually from 5 to 300μm in diameter depending on the degree of smoothness1. However by optimizing formulation
parameters such as drug: polymer ratio and agitation/ stirring rate it might be possible to manufacture microsponge.4
The microsponges behave like a reservoir of the active ingredients. These can potentially be used for the controlled delivery of a large variety of substances such as fragrances, emollients, sunscreens, anti-inflammatory, antifungal, antimicrobial agents A microsponge system offers the potential to hold active ingredients in a protected environment and provide controlled delivery onto the skin over a time as well as oral medication to the lower gastrointestinal (GI) tract, where it will be released upon exposure to specific enzymes in the colon.5-8
Nystatin is a polyene antifungal characterized by a potent broad-spectrum antifungal action including a wide range of pathogenic and non-pathogenic yeasts and fungi. The Nystatin is active against a variety of fungal pathogens including: Candida, Aspergillus, Nystatin exerts its antifungal activity by binding to sterols in the fungal cell membrane. When present in sufficient concentrations, it forms pores in the membrane that lead to K+ leakage, acidification, and death of the fungus.9-13
MATERIAL AND METHODS
Nystatin is a gift sample from Glenmark Pharmaceuticals Ltd.Carbapol 974P, HPMC K4, Propylene glycol, Triethano lamine. From Research-Lab Fine Chem, Mumbai
Method of Preparation:
Formulation of Nystatin loaded Microsponge
Microsponge was prepared by quasi-emulsion solvent diffusion method.
then poured into 0.5 % w/v polyvinyl alcohol (PVA, molecular weight 30,000-70,000) solution in water, the external phase. After 8 hour of stirring the microsponges
were formed due to removal of dichloromethane from the system. The microsponges were filtered and dried at 40°C for 12 hours.2, 14-19
Preliminary studies
Table no 1: Preliminary studies on formulation of Microsponge: Sr
No. Ingredient P1 P2 P3 Quantity in % (w/v) P4 P5 P6 P7 P8
1 Nystatin(gm) 1 1.5 2 2.5 3 3.5 4 4.5 2 Ethyl cellulose(gm) 1 1 1 1 1 1 1 1 3 Polyvinyl alcohol (mg) 50 50 50 50 50 50 50 50 4 Dichloromethane(ml) 10 10 10 10 10 10 10 10 5 Distilled water 200 200 200 200 200 200 200 200
Preliminary studies for formulation of microsponge were carried out as follows. ethyl cellulose was selected as a polymer and used for the sustained release mechanism for preparation of microsponge. DMSO is used as solvent and polyvinyl alcohol is used as cross linking agent. Preliminary studies on formulation of microsponges were carried out by taking various concentrations shown
Evaluation of drug loaded microsponge:20-31
The prepared microsponges were evaluated for the following parameter:
Drug content:
Entrapment efficiency:
Partical size and size distribution analysis:
Angle of repose
Determination of Density: i. Bulk Density
ii. Tapped Density:
Compressibility index :( Carr’s Index)
Hausners ratio
7.6.7. In-Vitro Drug Release Studies
In-vitro Dissolution Studies:
Nystatin (Pure Drug) & Nystatin loaded Microsponges were subjected to dissolution test using in-vitro dissolution rate USP Apparatus-II. (Paddle method). This test was performed using 900 ml of dissolution medium buffer solution PH 6.8 at 37±2ºC. Accurately weighed samples (plain drug and Nystatin loaded microsponges) approx. 20mg of drug were added in 900 ml capacity jar of dissolution apparatus which paddle was rotated at 50 rpm. A 5ml aliquot of dissolution medium was withdrawn at appropriate time intervals. An equal volume of fresh dissolution medium was immediately replaced. It was suitably diluted and analyzed spectrophotometrically by measuring absorbance at 305nm. The experiments were performed in triplicate.
X-ray powder diffraction (XRD):
To understand XRD pattern of pure drug and optimized formulation, a Philips 1710 X-ray Defractometer (XRD) with a copper target and nickel filter was used to obtain XRD result for the samples. Powder were mounted on aluminium stages with glass bottoms and smoothed to a level surface. The XRD pattern of each sample was measured from 10- 500
(2θ) using a step increment of 0.10 (2θ) and a dwell time of 1
second at each step.
Differential scanning calorimetry (DSC):
Thermogram of Nystatin, and Drug: SSG formulations were recorded by using “Miller Star sw 9.01” differential scanning calorimeter. Thermal behaviour of the samples was investigated under a scanning rate of 10ºC/ min, covering a temperaturerange of 100- 300ºC. The heat flow as a function of temperature was measured for both the drug and Microsponge.
Preparation of a Nystatin gel:
Nystatin, an antifungal drug was selected as a drug model in this study. The drug concentration in all formulations was kept constant at 1.72% w/w. and the concentration of dimethyl sulphoxide was also kept constant at 5% w/w. dimethyl sulphoxide was used as co-solvent and as a dispersion medium for the nystatin. Four formulations like F1,F2,F3,F4 containing 0.5, 1, 1.5, 2 %w/w(Raymond Rowe) polymer (carbopol ) Triethanolamine was used to neutralize and adjust the pH of the gel systems.
Carbopol was accurately weighed and dissolved in half quantity of distilled water and left for 2 hrs to swell and form gel. Solvent blend of dimethyl sulphoxide which contain microsponges equivalent to 1.72%w/w Nystatin with constant stirring. To the whole mixture added triethanolamine dropwise until transparent gel was obtained. Stirring was stopped to escape entrapped air;further formed gel was stored in air tight container for further study.
Table 2: Preparation of a Nystatin gel
Ingredient Nystatin gel Microsponge loaded Batch
F1 F2 F3 F4
Nystatin 1.72gm 1.90gm 1.90gm 1.90gm 1.90gm
Carbapol(%w/w) 1.5 0.5 1 1.5 2
DMSO(%w/w) 5 5 5 5 5
Triethanolamine(ml) 1 1 1 1 1
Bansode et al Journal of Drug Delivery & Therapeutics. 2019; 9(2-s):451-461
7.11. Physicochemical evaluations 7.11. 1. Physical
appearance:-The prepared Nystatin formulations containing Nystatin were inspected visually for their colour, homogeneity, consistency and phase separation.
7.11. 2. Measurement of pH:-
The pH of developed Nystatin formulations was determined using digital pH meter
7.11.3.
Spreadability:-Spreading coefficient was determined by apparatus suggested by Lalit Kumar et.al.,2010. It consists of a wooden block, which is attached to a pulley at one end. Spreading coefficient was measured on the basis of ‘Slip’ and ‘Drag’ characteristics of Nystatins. Spreadabilityis calculated by using the formula.
S = M. L / T Where, M = wt. tied to upper slide
L = length of glass slides, T = time taken to separate the slides
Rheological Study:
The viscosity of the developed Nystatin formulations was determined by using a Brookfield viscometer
Drug Content Determination:
Nystatin was measured by dissolving known quantity of Nystatin in solvent (DMSO) by Sonication. Absorbance was measured after suitable dilution at 305 nm using UV spectrophotometer.
7.11.6. In Vitro Diffusion Studies:
The in vitro drug release studies were carried out using a modified Franz diffusion cell. The formulation was applied on rat skin (which was previously soaked in Phosphate buffer pH 6.8 for 24 hours) which was sandwiched between donor and receptor compartment of the Franz diffusion cell. Phosphate buffer pH 6.8 was used as a dissolution media. The temperature of the cell was maintained at 34±0.2 0C by
kept it in water bath. This whole assembly was kept on a magnetic stirrer and the solution was stirred continuously using a magnetic bead at 50 rpm. The samples were withdrawn at suitable time interval and analysed for drug content by UV visible spectrophotometer at 305 nm after appropriate dilutions.
RESULT
Evaluation of Nystatin microsponge:
During Preliminary studies for the formulation of Nystatin microsponge, different parameters were studied in different range like, drug to polymer ratio, stirring speed, stirring time, internal volume, and surfactant concentration.
8.4: Evaluation of optimized microsponge:32-40
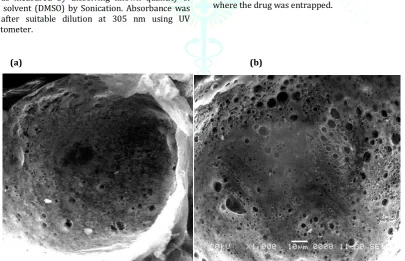
8.4.1: Scanning electron microscopy:
Morphology of microsponges was examined by scanning electron microscopy. As it can be seen from the SEM images (Figure.8.6) the microsponge presented a rough surface with characteristic large wrinkles and micropores. microsponge were spherical shape and showed sponge like structure where the drug was entrapped.
(a) (b)
8.4.2. FTIR Spectroscopy:-
FTIR Spectra of Surface solid dispersion of Nystatin in comparison with pure drug was done to determine the interaction between drug and polymer. Result of FTIR graph is shown in following figure.
Nystatin
Nystatin microsponge
Figure 8.7: Comparative FTIR Spectra of Nystatin µsponge
From the FTIR spectrum of the microsponge of Nystatin in Comparison with Pure drug (Nystatin) it was concluded that there was no any Change in the position of peak of microsponge. So there is no any Interaction between drug and polymer used in the Microsponge formulation.
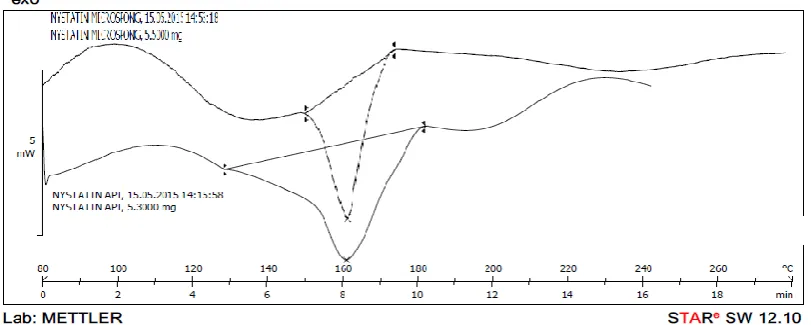
8.4.3: Diffrential scanning calorimetry:
Differential Scanning Calorimetry (DSC) study was carried out for Microsponge Of Nystatin. The obtained result is
shown in Fig.No.8.8. DSC Studies indicate the endothermic peak at 160°C which of the melting point of Nystatin drug. There was no any major change in the position of peak in Comparison with pure drug (Nystatin). The decrease in the sharpness of the peak in the Microsponge was the indication of drug convert from crystalline to Disorder crystalline or amorphous form & which was confirm by the XRD study. There was no change in melting point is indication of the drug is in the stable form in the microsponge formulation.
Figure 8.8: Comparative DSC graph of Microsponge of Nystatin
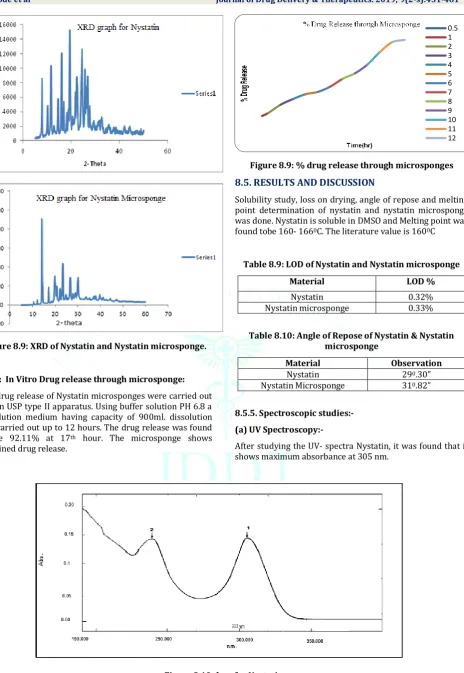
8.4.4 X-ray diffractometry:
Powder X ray diffraction analysis was carrie;d out for Microsponge of Nystatin. Powder X ray diffraction study indicates the number of peaks and peak height was reduced in microsponge which was the indication of change in crystal
habits. There was also change in Diffraction angle (2θ) value indicate change in crystal lattice of Nystatin. These findings suggest that the Nystatin crystals get converted to disorder crystalline form or amorphous form in surface solid dispersion. XRD graph of microsponge of Nystatin is shown in fig. No.8.9.
nyst ati n
Name Description
4000 3500 3000 2500 2000 1500 1000 500450 121
9 20 30 40 50 60 70 80 90 100 110
cm-1 %T
1069.22c m- 1, 11.36%T1008.39c m- 1, 15.07%T 3367.56c m- 1, 20.99%T 2931.30c m- 1, 25.17%T 1399.33c m- 1, 24.81%T
1185.31c m- 1, 26.95%T 1575.80c m- 1, 27.53%T
1448.18c m- 1, 30.14%T 1322.55c m- 1, 33.94%T 1702.36c m- 1, 34.72%T
1282.70c m- 1, 40.44%T1261.70c m- 1, 43.48%T
3012.85c m- 1, 43.59%T 846. 36c m-1, 44. 02%T
527. 48c m-1, 49. 06%T 916. 19c m-1, 56. 78%T
884. 79c m-1, 56. 78%T 903. 50c m-1, 57. 15%T
795. 05c m-1, 61. 35%T
692. 39c m-1, 61. 92%T 737. 32c m-1, 62. 07%T
710. 00c m-1, 62. 32%T
nyst ati n microspong e
Name Description
4000 3500 3000 2500 2000 1500 1000 500450 81
23 25 30 35 40 45 50 55 60 65 70 75
cm-1 %T
1111. 23c m-1, 24. 58% T1055.03c m- 1, 24.89%T 2974. 78c m-1, 25. 03% T
2872. 50c m-1, 26. 90% T 2930. 09c m-1, 27. 74% T 3479. 88c m-1, 30. 35% T
1376. 92c m-1, 34. 62% T 1355. 22c m-1, 39. 50% T 1445. 01c m-1, 41. 80% T
1311.21c m- 1, 42.14%T 1281. 20c m-1, 43. 42% T 1731. 84c m-1, 49. 19% T
919.8 1cm -1, 55.0 2% T 882.8 1cm -1, 57.8 4% T
Bansode et al Journal of Drug Delivery & Therapeutics. 2019; 9(2-s):451-461
Figure 8.9: XRD of Nystatin and Nystatin microsponge.
8.4.4: In Vitro Drug release through microsponge:
The drug release of Nystatin microsponges were carried out into in USP type II apparatus. Using buffer solution PH 6.8 a dissolution medium having capacity of 900ml. dissolution was carried out up to 12 hours. The drug release was found to be 92.11% at 17th hour. The microsponge shows
sustained drug release.
Figure 8.9: % drug release through microsponges
8.5. RESULTS AND DISCUSSION
Solubility study, loss on drying, angle of repose and melting point determination of nystatin and nystatin microsponge was done. Nystatin is soluble in DMSO and Melting point was found tobe 160- 1660C. The literature value is 1600C
Table 8.9: LOD of Nystatin and Nystatin microsponge
Material LOD %
Nystatin 0.32% Nystatin microsponge 0.33%
Table 8.10: Angle of Repose of Nystatin & Nystatin microsponge
Material Observation
Nystatin 290.30”
Nystatin Microsponge 310.82”
8.5.5. Spectroscopic studies:- (a) UV Spectroscopy:-
After studying the UV- spectra Nystatin, it was found that it shows maximum absorbance at 305 nm.
Figure 8.10: λmax for Nystatin
(b) DSC Thermogram:-
The DSC thermogram of Nystatin Microsponge was recorded using Differential Scanning Calorimeter. The DSC thermogram shows melting endothermic at160 °C.
Figure 8.11: DSC Thermo gram of Nystatin 8.5.6. Calibration Curve:
λmax value for Nystatin Microsponge was found to be 305 nm from UV spectra. The solvent used for the preparation of
calibration curve for Nystatin Microsponge are phosphate buffer pH 6.8solution. The regression coefficient value was found to be 0.996.
Figure 8.12: Calibration of Nystatin Microsponge 8.5.7. Compatibility Studies:
After 30 days of drug with excipient in various ratio storage at room temperature, samples were observed for physical changes but there were no physical changes observed in the mixture of Nystatin Microsponge and polymer combination.
Compatibility Studies BY FTIR
Figure 8.13(A): FTIR of Nystatin
y = 0.0292x - 0.016
R² = 0.9963
0
0.05
0.1
0.15
0.2
0.25
0.3
0
2
4
6
8
10
12
nyst ati n
Name Description
4000 3500 3000 2500 2000 1500 1000 500450 121
9 20 30 40 50 60 70 80 90 100 110
cm-1 %T
1069.22c m- 1, 11.36%T1008.39c m- 1, 15.07%T 3367.56c m- 1, 20.99%T
1399.33c m- 1, 24.81%T 2931.30c m- 1, 25.17%T 1575.80c m- 1, 27.53%T 1185.31c m- 1, 26.95%T
1448.18c m- 1, 30.14%T 1322.55c m- 1, 33.94%T 1702.36c m- 1, 34.72%T
1282.70c m- 1, 40.44%T1261.70c m- 1, 43.48%T
3012.85c m- 1, 43.59%T 846. 36c m-1, 44. 02%T
527. 48c m-1, 49. 06%T 916. 19c m-1, 56. 78%T
884. 79c m-1, 56. 78%T 903. 50c m-1, 57. 15%T
795. 05c m-1, 61. 35%T
692. 39c m-1, 61. 92%T 737. 32c m-1, 62. 07%T
Bansode et al Journal of Drug Delivery & Therapeutics. 2019; 9(2-s):451-461
Figure 8.13(B):FTIR of Nystatin microsponge
Figure 8.13(C): FTIR of Nystatin microsponge + Carbapol A- Nystatin.
Table 8.13: Functional group of FTIR
8.5.8. Differential Scanning Calorimetriy (DSC)
The DSC analysis of pure drug, polymer and mixture were carried using DSC to evaluate any possible drug polymer interaction. All the prominent thermograms of the drug and polymer were retained. Thus, no interactions were observed between the drug and excipients. Hence drug excipients compatibility was established shows DSC of drug, polymer and drug-polymer mixture.
Figure 8.14: DSC Thermogram of Nystatin nyastatin microsponge + carbapol
Name
Sample 009 By Administrator Date Sunday, February 08 2015 Description
4000 3500 3000 2500 2000 1500 1000 500450
59
-1 5 10 15 20 25 30 35 40 45 50 55
cm-1
%T
1711.57cm-1, 0.87%T
1167.75cm-1, 2.57%T
2974.27cm-1, 3.97%T 1242.87cm-1, 4.28%T
2931.84cm-1, 4.51%T
1111.99cm-1, 5.92%T 1454.71cm-1, 7.42%T 1056.09cm-1, 7.45%T
1411.91cm-1, 9.49%T 1375.89cm-1, 9.65%T 3474.76cm-1, 10.27%T
1354.86cm-1, 10.33%T
802.26cm-1, 16.56%T 918.33cm-1, 17.41%T
882.87cm-1, 17.67%T 609.09cm-1, 23.57%T
516.72cm-1, 25.35%T
Functional group IR value cm-1
N-H Str 3429.44
C=O 1815.15
C-H Str 3063.17
C-CL 863.96
C=C 1433.39
nyst ati n microspong e
Name Description
4000 3500 3000 2500 2000 1500 1000 500450 81
23 25 30 35 40 45 50 55 60 65 70 75
cm-1 %T
1111. 23c m-1, 24. 58% T1055.03c m- 1, 24.89%T 2974. 78c m-1, 25. 03% T
2872. 50c m-1, 26. 90% T 2930. 09c m-1, 27. 74% T 3479. 88c m-1, 30. 35% T
1376. 92c m-1, 34. 62% T 1355. 22c m-1, 39. 50% T 1445. 01c m-1, 41. 80% T
1311.21c m- 1, 42.14%T 1281. 20c m-1, 43. 42% T 1731. 84c m-1, 49. 19% T
919.8 1cm -1, 55.0 2% T 882.8 1cm -1, 57.8 4% T
Figure 8.15: DSC Thermogram of Mixture Nystatin +Nystatin Microsponge 8.5.10. Formulation table
Table 8.14: Formulation table for Nystatin gel & Nystatin Microsponge Gel.
Ingredient Nystatin gel Microsponge loaded Batch
F1 F2 F3 F4
Nystatin 1.72gm 1.90gm 1.90gm 1.90gm 1.90gm
Carbapol (%w/w) 1.5 0.5 1 1.5 2
DMSO (%w/w) 5 5 5 5 5
Triethanolamine (ml) 1 1 1 1 1
Distilled water q.s. q.s. q.s. q.s. q.s.
8.6. Physicochemical evaluation: 8.6.1. Physical appearance:-
The prepared Nystatin micropsonge gel formulations were A gel is a solid, jelly-like material that can have properties ranging from soft and weak to hard and tough. Gels are defined as a substantially dilute cross-linked system, which exhibits no flow when in the steady-state. All gel found to be transparent.
8.6.2. Measurement of
pH:-The pH values of all prepared formulation ranged from which are.
Table 8.15: pH of Nystatin &Nystatinmicropsonge gel formulation
8.6.3. Spreadability:-
The spreadability of various gel formulations is depicted in graph it was concluded that all the developed formulation showed acceptable spreadability
Table 8.16: Spreadability of Nystatin formulation
Batch Nystatin gel F1 F2 F3 F4
Spreadability (gm.cm/sec.) 19.60 22.66 16.66 26.22 19.06
Figure 8.16: spreadability of Nystatin micropsonge gel formulation
Batch Nystatin gel F1 F2 F3 F4
Bansode et al Journal of Drug Delivery & Therapeutics. 2019; 9(2-s):451-461
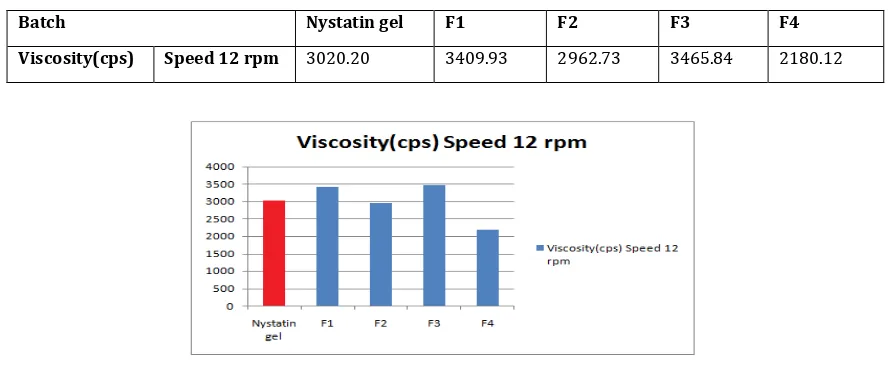
8.6.4. Rheological
Study:-The measurement of viscosity of the prepared Nystatin was done with Brookfield viscometer. Study:-The highest viscosity was found in formulation it may be due to low level of the liquid paraffin concentration and emulsifying agent concentration. The lowest viscosity was found in formulation f1.
Table 8.16: Viscosity of Nystatin microsponge gel formulation
Batch Nystatin gel F1 F2 F3 F4
Viscosity(cps) Speed 12 rpm 3020.20 3409.93 2962.73 3465.84 2180.12
Figure 8.17: Viscosity of gel formulation 8.6.5. Drug Content Determination:-
Drug content was calculated using the equation, which was obtained by linear regression analysis of calibration curve. The drug content of all gel formulation is given in table. Y = 0.024x - 0.004 R² = 0.996.
Table 8.17: Drug content of Nystatin micropsonge gel formulation
Batch Nystatin gel F1 F2 F3 F4
Drug content (%) 65.18 87.56 84.93 89.65 86.93
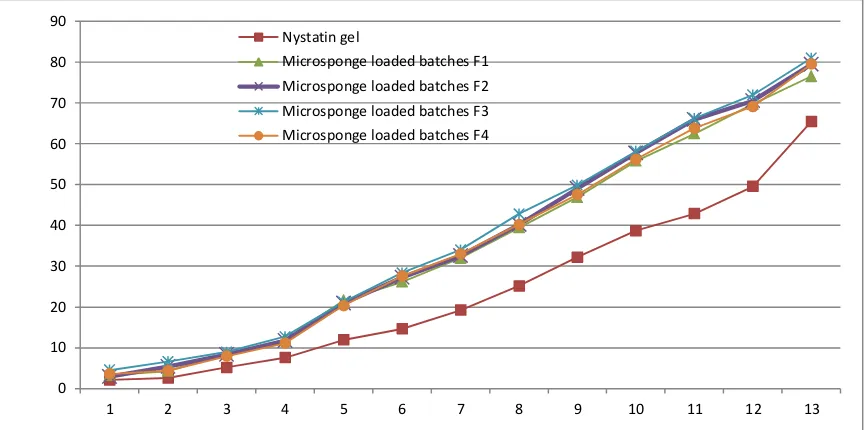
Figure 8.18: Drug content of Nystatin micropsonge gel formulation 8.7. In Vitro Diffusion Studies
The in vitro release profiles of Nystatin micropsonge from its various gel formulations
Table 8.18: In-vitro diffusion studies
Time(hrs)
Nystatin gel Microsponge loaded batches
F1 F2 F3 F4
0.5 2.125 3.258 2.855 4.528 3.569
1 2.577 4.256 5.365 6.568 4.365
2 5.155 8.547 8.355 8.927 7.934
Figure 6.19: In-vitro drug release from Nystatin micropsonge gel formulation
CONCLUSION
Microsponges containing Nystatin were prepared by quasi emulsion solvent diffusion method using ethyl cellulose and PVA. By considering the solubility study of the drug, polymer and the rate of diffusion of the solvent used. The internal phase suitable for the preparation of microsponges to be dichloromethane and the external phase was found to be water. Mixture of Ethyl cellulose and drug in dichloromethane served as internal phase &Solution of PVA in water served as external phase. DSC studies of pure drug and excipients and their mixtures show that there is no interaction between drug and excipients.
All the microsponge formulations were subjected to drug content estimation, the low SD values indicates drug content was uniform and reproducible in all the formulations. All the microsponge formulations were subjected for loading efficiency and the results were found to be reproducible.The IR spectral analysis suggested that there was no interaction between the drug and formulation additive. The drug exists in original form and available for the biological action.From dissolution studies it was found out that microsponge batch no. F3 gave maximum drug release.
The comparative study of Nystatin gel and Nystatin microsponge loaded gel was performed. The release profile of both the formulation was studied using franz diffusion cell, From the results it can be concluded that microsponge loaded gel shows good release of drug as compare to nystatin gel.
REFERENCES
1. Nokhodchi A, Jelvehgari M, Siahi MR, Mozafari MR. Factors affecting the morphology of benzoyl peroxide microsponges. Micron 2007; 38:834–840.
2. Orlu M, Cevher E, Araman A. Design and evaluation of colon specific drug delivery system containing flurbiprofen microsponges. Int. J. Pharm. 2006; 318:103-117.
3. Emanuele AD, Dinarvand R. Preparation, characterization and drug release From thermo responsive microspheres, Int. J. Pharm.; 1995, 237-242.
4. Jones DS, Pearce KJ. Investigation of the effects of some process variables on, microencapsulation of propranolol HCl by solvent evaporation method. Int. J.Pharm. 1995; 118:99-205.
5. Vyas SP, Khar RK, Targeted and Controlled Drug Delivery-Novel Carrier System: New Delhi: CBS Publication, 2002, p. 453-95.
6. Nacht V. Katz M. The microsponge: a novel topical programmable delivery system, in: D.W. Osborne, A.H. Amman (Eds.), Topical Drug Delivery Formulations, Marcel Dekker: New York, Basel; 1990:299-325.
7. Patel G, Patel JK. Use of a Microsponge in Drug Delivery
Systems. Available
from:URL:http:www.pharmpro.com/ShowPR.aspx?PUBCODE =021&ACCT=0000100&ISSUE=0602&RELTYPE=PR&ORIGRE LTYPE=ATO&PROCODE=0
000&PRODLETT=B&CommonCount=0.
8. Garg R., Kumar S, Gupta G. Topical Gel: A Review, http://www.pharmainfo.net. 2008,63.
9. Sharma S, Goswami J, Gupta G, Mustafa A, Topical Drug Delivery Systems: A Review, http://www.pharmainfo.net. 2008.6 (5).
10. Banker, Rhodes P. Modern Pharmaceutics. edited by Gilberts Banker, Mercel Dekker, New York, 4thEdn 2000,189-191.
11. Howard C, Nicholas G., Ointments, creams and gels. In: Pharmaceutical dosage forms and drug delivery system. in editors loyd V. Allen , Nicholas,G.popovich, Howard C Ansel 7thEdn, New Delhi ,2000, 2.44-250
12. Waugh A, Grant A, Ross and Wilson. Anatomy & Physiology in Health & Illness. Elsevier Science Ltd , 9thEdn . New York, 2003
361-372.
13. Jain A, Gautam S, Gupta Y, Khambete H, Jain S. Development and characterization of ketoconazole emulgel for topical drug delivery. Pelagia Research Library. 2010; 1:221-231. 14. Lachman L, Lieberman HA, Kanig JL. The Theory and Practice
Of Industrial Pharmacy..Varghese Publishing House, 3rd Ed.
Bombay; 1987:293-345
15. Laithy HM. and El shaboury KMF. Thedevelopment of CutinaLipogels and gelmicroemulsion for topical administration offluconazole. AAPS PharmSciTech. 2003; 3:25.
16. Eccleston GM. Emulsions. In: Swarbrick J, Boylan JC, eds.Encyclopedia of Pharmaceutical Technology,: Marcel Dekker Inc; New York 1992:137-188.
17. Clyde MO, Cathy MK. Gels and Jellies., In Swarbrick J, Boylan JC, editors. Encyclopedia of Pharmaceutical Technology. Marcel Dekker. 3rdEdn. New York. 1875-1889. 2007
18. Mohamed M I, Optimization of Chlorphen esinEmulgel Formulation. AAPS PharmSciTech. 2004, 6:26.
19. Vijaya Bhanu P, Shanmugam V,Lakshmi PK, Development And Optimization Of Novel Diclofenac EmulgelFor Topical Drug Delivery International Journal Of Comprehensive Pharmacy 2011, 9(10). 0 10 20 30 40 50 60 70 80 90
1 2 3 4 5 6 7 8 9 10 11 12 13
Nystatin gel
Bansode et al Journal of Drug Delivery & Therapeutics. 2019; 9(2-s):451-461 20. Kappor D., Patel M., Vyas R., Lad C., & Tyagi B. A review on
microsponge drug delivery system. Journal of Drug Delivery and Therapeutics, 2014; 4(5):29-35.
21. Khullar R , Kumar D, Seth N, Saini S. Formulation and evaluation of mefenamic acid emulgel for topical delivery. Saudi Pharmaceutical Journal. 2012; 20:63-67
22. Jelvehgari M, Siahi-Shadbad M.R., Azarmi S., Gary P.Martin, Ali Nokhodchi. The microsponge delivery system of benzoyl peroxide preparation, characterization and release studies. International Journal of Pharmaceutics, 2006; 308:124–132. 23. Orlu M, Cevher E, Araman A. Design and evaluation of colon
specific drug delivery system containing flurbiprofen microsponges. Int. J. Pharm. 2006; 318: 103-117.
24. Jelvehgari M, Siahi-Shadbad M.R., Azarmi S., Gary P. Martin, Ali Nokhodchi. The microsponge delivery system of benzoyl peroxide preparation, characterization and release studies. International Journal of Pharmaceutics, 2007; 308:124–132. 25. Nacht V. Katz M. The microsponge: a novel topical
programmable delivery system, in: D.W. Osborne, A.H. Amman (Eds.), Topical Drug Delivery Formulations, Marcel Dekker: New York, Basel; 1990: 299-325.
26. Madan M, Bajaj A, Amrutiya N. Formulation and in vitro evaluation of topical emulgel containing combination of a local anaesthetic and an anti-inflammatory drug. Indian Journal of Pharmaceutical Education and Research. 2009; 43:351.
27. Mehta M, Panchal A, Shah VH, Upadhyay Uprepared and
evaluated controlled release microsponge gel for topical
delivery of Clotrimazole International Journal of
Biopharmaceutics. 2013; 4(3):225-230.
28. Quiñones D., Ms; Evone S. Ghaly., Formulation and characterization of Nystatin gel. PRHSJ 2008; 27(1):61-67. 29. Kaur R., Kaur S. Role of Polymers in Drug Delivery. Journal of
Drug Delivery and Therapeutics, 2014; 4(3):32-36.
30. Chandramouli Y., Shaik F., RajalakshmiR.,Yasmeen R.B. Preparation and evaluation of microsponge loaded controlled release topical gel of acyclovir sodium. International Journal of Biopharmaceutics. 2012; 3(2): 96-102.
31. Raymond C., Paul J., Paul J. W. Handbook of Pharmaceutical Excipients.5thedition.Published by Pharm. press. New York;
2006.P.89, 90,159,160,317-322,622-624.
32. Indian Pharmacopoeia: Controller of Publications, Govt. of India, Ministry of
33. Health & Family Welfare, New Delhi, vol.1, 1996:7: 511-513 34. Indian Pharmacopoeia: Government of India, Ministry of
Health & Family welfare, New Delhi, Vol. 1, 2007: 134 35. Jagdale S. C. Jadhav V. N, Chabukswar A. N, Kuchekar B. S,
Solubility enhancement, physicochemical characterization and formulation of fast-dissolving tablet of Nifedipine-Betacyclodextrin complexes, Brazilian Journal of Pharmaceutical Sciences 2012: vol. 48, jan./mar:131-145. 36. Patil A, Madgulkar A.Surface Morphology and Drug Release
Studies on Repaglinide Controlled Release Pellets Prepared by Solution Layering Method with Blend of PEG - HPMC - EC Polymers .Pharma Tutor article.2010.
37. Jaiswal, P., Kesharwani S., Kesharwani R., Patel D. Ethosome: A New Technology used as Topical & Transdermal Delivery System. Journal of Drug Delivery and Therapeutics, 2016;
6(3):7-17.
38. Rastogi V., Shukla S., Singh R., Lal N., & Yadav P. Microspheres: A Promising Drug Carrier. Journal of Drug Delivery and Therapeutics, 2016; 6(3):18-26.
39. Bhatt P, Gananaranjan G. Emulgel :A novel formulation approach for topical delivery of Hydrophobic drugs.IRJP,2013 4(2).