ISSN: 2149-214X
Evaluation of Students' Use of Visual
Learning Representations in Science
Classes: A Case Study from Turkey
Tufan Inaltekin, Volkan Goksu Kafkas University
To cite this article:
Inaltekin, T. & Goksu, V. (2019). Evaluation of students' use of visual learning
representations in science classes: A case study from Turkey.
Journal of Education in
Science, Environment and Health (JESEH), 5
(2), 244-265.
DOI:10.21891/jeseh.541917
This article may be used for research, teaching, and private study purposes.
Any substantial or systematic reproduction, redistribution, reselling, loan, sub-licensing,
systematic supply, or distribution in any form to anyone is expressly forbidden.
Authors alone are responsible for the contents of their articles. The journal owns the
copyright of the articles.
DOI:10.21891/jeseh.541917
Evaluation of Students' Use of Visual Learning Representations in Science
Classes: A Case Study from Turkey
Tufan Inaltekin, Volkan Goksu
Article Info
Abstract
Article History
Received: 02 February 2019
The aim of this study was to analyse the kinds and frequency of visual learning representations within 8th grade students’ notebooks for science classes. As part of the research, 93 science notebooks which belonged to students from 13 secondary schools in Kars Province (the east of Turkey) were collected at the end of the academic year in 2018. Document analysis, a qualitative research strategy, has been adopted and content analysis technique was used to analyse the collected documents. The results showed that the visual learning representations recorded on students’ notebooks were notably different from one unit to another and from one school to another. Moreover, it has been observed that students did not make frequent use of visual representations whilst learning the content. Additionally, the visual learning representations in students’ notebooks mostly consisted of the representations used by teachers during classes. These findings suggest that science teachers might have not been successful enough in guiding students to incorporate different visual representations into their learning processes for a better understanding of science subjects.
Accepted: 22 June 2019
Keywords
Science notebooks Visual representations Science Learning
Introduction
In today’s world, the decision makers, who decide on educational policies, put the question of “How can we increase student’s academic success in science education?” at the top of their agendas. Reaching the standards which could be the answer to this question can, in fact, be described as achieving the learning outcomes which would respond to the requirements of the 21st century. And it is necessary to evaluate the kind and quality of teaching activities utilized in science classrooms in order to remove the obstacles of achieving those outcomes. In relation to this, the written documents that include the records of teaching activities in science classrooms (i.e. notebooks, lab reports, activity forms, and diaries) are one of the most effective means of interpreting students’ performance and learning outcomes (Ruiz-Primo, Li, Shavelson, 2001). This is because such documents are fundamental sources in which students keep records of their own learning processes and representations. In line with this, we should identify students’ strengths and weaknesses in order to be able to increase their success rates in science subjects. On a different note, in science classes, students’ academic performance is generally assessed based on exams, homework, and classroom observations. More specifically, traditional assessment methods that are based on written exams are prominent. The most important issue in assessment, on the other hand, is to be able to define what the evidence that can reveal students’ performance is. Because, evidence that reflects students’ comprehension levels should be collected in order to introduce and integrate quality education designs into teaching/learning processes (Wilson, 2008). Based on such evidence, assessments with regards to students’ learning behaviours can also provide a opportunity to science teachers to develop their practice, as teachers would have an opportunity to evaluate the outcomes of their efforts in the form of student success (Forsberg & Wermke, 2012).
opportunity to better analyse the barriers to learning in science subjects have different characteristics from traditional assessments. Such methods allow the collection of information, which has more explanatory power, from teachers and students. Furthermore, such evaluation are focused on analysing students’ thinking about science subjects at a deeper level unlike traditional methods which simply define student thinking as “right” or “wrong” (Ruiz-Primo et al., 2001). It has been asserted that one of the most effective innovative assessment tools for developing students’ comprehension of science subjects and realizing the 21st century learning goals are the student notebooks (Reed, 2012). Science notebooks are crucial sources in which in and out of class pedagogical and content interactions are recorded during teaching/learning processes. This is because notebooks are the most concrete records of the scientific facts that students learn and the learning processes they have been through whilst learning those facts (NSTA, 2008).
National Research Council (NRC, 2007, 2012) emphasizes the importance of students’ recording their observations, opinions, views, and models in their notebooks for a better learning from the moment they start learning within the framework of K-12 education. Moreover, the importance of encouraging students to create diagrams and visualise data and their observations via tables in addition to the texts recorded in their notebooks is highlighted (Lee & Jones, 2017). Notebooks depict students’ work in relation to their learning and classroom experiences over the course of their education. Moreover, those notebooks are valuable records that contain reflections of teachers’ teaching practices and define students’ science learning (Campbell & Fulton, 2003; Madden & Wiebe, 2013). Information included in students’ notebooks, depending on attendance to classes, can be traced back to course books or teachers’ improvisations (Yau & Mok, 2016). According to Ruiz-Primo, Li, Ayala, & Shavelson (2004), examination of the information within student notebooks is one of the most effective assessment methods that can be used to select activities that would increase student performance. Moreover, Baxter, Bass and Glaser (2000) found that science notebooks reflect what students do and what teachers focus on during classes. More specifically, the notebooks contain the evidence in relation to teachers’ progress in terms of the curriculum as well as the pedagogical interactions with their students (Ruiz-Primo & Li, 2013). The work contained in science notebooks is a rich source of assessment that can provide information on students’ scientific thinking and practice (Aschbachar & Alonzo, 2006; Ruiz-Primo, Shavelson, Hamilton & Klein, 2002). Akaygun and Jones (2014) have highlighted that the texts and/or drawings in students’ notebooks represent the most practical form of communication to express student’s understanding of science subjects. In addition to written proofs that represent students’ understanding of science, notebooks are also considered as the most valuable source that can be used as an indicator of the opportunities for students’ visual learning practices (Gilbert, 2010; Ruiz-Primo & Li, 2004).
Notebooks help students to individually reflect student thinking via visual learning tools such as drawings, diagrams, tables, and graphics (Nesbit, Hargrove, Harrelson, & Maxey, 2004). As noted in the Next Generation Science Standards (NGSS), in addition to writing, the use of drawings, models, diagrams, and tables are critical to allowing students have a more effective scientific communication (NGSS, 2013). The review of related literature suggests that visual representations are described as figurative representations. Those figurative representations include learning artefacts such as pictures, schemata, graphics, photos, colouring, concept maps, diagrams, tables, and various symbols (Moline, 1995; Petterson, 2002; Vekeri, 2002). Coleman, McTigue and Smolkin (2011) point out that the use of visual representations for teaching purposes can play an important role in correctly explaining and exemplifying/illustrating new and abstract concepts in science. For example, the use of visuals in teaching about bacteria which are microscopic living organisms can facilitate student understanding. Therefore, the use of visual representations can be considered as a teaching strategy which develops children’s scientific communication skills (Mishra, 1999). Researchers note that the integration of visual representations (picture, diagram, drawing, table, graphic, map, models, and so on) into the curriculum can help students to relate new knowledge to a structured product, thereby, facilitating the comprehension of content (Chang, 2012; Cox, 2005; Danish & Enyedy, 2007; Van Meter & Garner, 2005; Van Meter et al., 2006; Wilson & Bradbury, 2016).
class. Despite this significance to been expressed, studies which search case of usage of visual learning means have specially sighted to not be located in science class at Turkey. With this in mind, the current study aimed to analyse the visual learning practices within the science notebooks of 8th grade students at the end of the academic year. Moreover, the authors focused on the kinds and frequencies of the visuals within 8th grade students’ science notebooks. This study provided an opportunity to explore the extent and kind of visual learning artefacts within 8th grade students’ notebooks in secondary schools in Kars, a province located in North East of Turkey.
Science Notebooks as an Assessment Tool: Review of Literature
Writing is not only an important means of communication, but it also helps people develop, regulate, and strengthen their ideas. In science, writing serves as a tool to communicate scientific ideas and findings to others. Most importantly, writing is a fundamental part of scientific processes (Morris et al. 2007). The adventure of science notebooks has started in medieval ages, at that time, the notebooks were tools in which, especially, alchemists have noted down their discoveries about mystical stones using drawings (Crosland, 2004). The analysis of scientists’ research notebooks has revealed valuable information regarding how science was done (Holmes, Renn, & Rheinberger, 2003). Since those times, notebooks have become sources to understand science and record and interpret ideas. Throughout the history, scientists have used science notebooks to record their ideas and experiments. Those notebooks revealed information about their authors’ thinking and the scientific processes they followed (Tweney, 1991). In time, science notebooks have become tools that have been used by not only scientists but also students-inexperienced researchers- who develop their scientific understanding in classes. Similar to scientists, students use their notebooks to record problems, laboratory activities, their observations, and the outcomes (Baxter, Bass, & Glaser, 2000). Like scientists, students are responsible for taking notes in order to guide their learning and they should be encouraged to learn by recording their ideas, procedures, and results on their notebooks, just like scientists (Cole, Wilhelm, & Yang, 2015).
Shepardson and Britsch (1997) have noted that written reflections are an important tool to develop students’ learning processes and their opinions. Students’ written thoughts open a window into their thinking processes (NSTA, 2008). In this sense, it is important to support various note taking techniques to allow students develop skills necessary to regulate information. In this sense, student notebooks play a central role in allowing students develop such skills (Eddy, 2018). The notebook writing is one of the factors that support student learning in science classes. Writing represents a source that allows students display individual learning products in science subjects (Glen, 2008; Glen & Dotger, 2013). For deep learning to occur, students should be involved in processes in which they create learning products through writing (Prain & Tytler, 2012). The texts in students’ science notebooks characterize the processes resulting in conceptual understanding. Furthermore, the writing procedures in science are considered as knowledge building processes (Gunel, Hand, & Prain, 2007; Hand, 2017; Hand, Gunel, & Ulu, 2009; Hand, Wallace, & Yang, 2004; Huerta & Garza, 2019; Huerta, Lara-Alecio, Tong, & Irby, 2014; Pelger & Nilsson, 2016; Rouse, Graham, & Compton, 2017; Ruiz-Primo et al. 2004; Yore, 2003). Additionally, many researchers highlight the importance of writing on notebooks in order to support the development of students’ academic writing and language skills (Butler & Nesbit, 2008; Grimberg & Hand, 2009; Keys, Hand, Prain, & Collins, 1999; Morrison, 2008; Rivard & Straw, 2000).
Science notebooks are records of students’ written opinions and visual artefacts such as tables, models, diagrams, and graphics. Moreover the notebooks include student reflections, questions, hypotheses, claims based on evidence and –most importantly- the new concepts that they learned. Student notebooks make significant contributions to the development of students’ conceptual understanding and communication skills during learning processes (Morrison, 2008; Reed, 2012). Therefore, a science notebook is a central location where language, knowledge, and experience are brought together to create understanding. If a science notebook is used effectively, then, it can serve as an important source of data both for the student and the teacher. Moreover, science notebooks could become a direct measurement as well as a formative assessment tool of student understanding. Science notebooks are also individual records in which student questions are formulized and serve the aim of reflecting the level of progression of research. Student notebooks record the scientific procedures such as installing hypothesis, developing an action plan, recording observations and data, proving claims, and creating a report of findings (NSTA, 2008). Recent studies point out to the necessity of approaching language and writing as inseparable parts of inquiry-based learning in science (Jang & Hand, 2017; Pelger & Nilsson, 2016; Seah, 2016; Williams, Tang, & Won, 2019).
data, documenting activities, organizing information, presenting results, and reflection which are crucial in science. Notebooks encourage students in applying, making sense of, explaining, and developing recently learned knowledge. Moreover, notebooks play an important role in learning processes since they reflect students’ individual understanding, opinions, and/ or feelings (Reed, 2012; Ruiz-Primo et al., 2004). Science notebooks are defined as a rich portfolio of information that consists of recordings of students’ answered or unanswered questions, procedures that were followed, materials used, the data that was collected and organized, and other data collected from different sources (Nesbit, Hargrove, & Fox, 2003). Many studies in the last two decades have suggested that student notebooks should be used effectively as part of science teaching (Ruiz-Primo & Li, 2004; Ruiz‐(Ruiz-Primo et al., 2004; Aschbacher & Alonzo, 2006). The science notebooks of the 21st century are a popular source for documenting student work and ideas at secondary school level (Fulton & Campbell, 2014; Fulton, Peak, & Taoka, 2017). Furthermore, quite a few number of researchers and educators believe that the use of students’ science notebooks as an assessment tool to measure academic success and form educational strategies is more effective compared to traditional assessment tools (Nesbit, Hargrove, Harrelson, & Maxey, 2004; Ruiz-Primo & Li, 2013). According to Aschbacher and Alonzo (2006), science notebooks should be considered as important assessment tools for at least two reasons:
1. Notebooks are an embedded part of the curriculum. Therefore, they are a source of data readily available to teachers. Teachers, in order to be able to make judgements relating to their teaching practices, can gain information from student notebooks at any given time without the need for extra time or expertise.
2. Notebooks are a direct measurement of students’ understanding of the science curriculum and, therefore, are especially important for the goals of formative assessment.
Ruiz-Primo and Li (2013) define teacher feedback as an important component of formative assessment practices in classrooms. In order to be able to give effective feedback, teachers should firstly understand where they stand in terms of realizing learning objectives and science notebooks can provide such valuable information. The interpretation of the information within those books provides clues for teachers that can facilitate student learning. Student work on science subjects in their notebooks is a rich form of formative assessment that reflects their scientific thinking and practices (Aschbachar & Alonzo, 2006). Formative assessments are strong tools that can guide students. Therefore, student notebooks are rich sources of data for formative assessment (Shelton et al., 2016). As an assessment tool, student notebooks can be used at two levels: a) at individual level, the notebooks can provide evidence of students’ performances during the class and b) at class level, the notebooks can provide evidence of opportunities for student learning (Ruiz-Primo et al., 2002; Ruiz-Primo & Li, 2004).
The strongest quality of science notebooks is the fact that they provide real records of students’ scientific thinking and provide accurate feedback regarding their learning. Information gathered from science notebooks provide an accurate record of each student’s level of understanding during thinking and research processes. Teachers can use such information in order to understand what students think, identify their strengths and weaknesses, and why they make mistakes. The information collected from notebooks should be used to develop classroom practices, correct misconceptions, and allow students develop a deeper understanding of the content. Another advantage of the information collected from students’ science notebooks is that it includes clues regarding students’ success in other subjects. That is to say, students’ science notebooks can also be used as assessment tools to measure students’ mathematics and language (i.e. written language) skills (Huerta, Tong, Irby, & Lara-Alecio, 2016; Nesbit et al. 2004). Although it is commonly believed that science and writing are two separate subjects, writing is considered to be the basis for most scientific practices (Fulton, Paek, & Taoka, 2017; Paek & Fulton, 2017). Effective use of science notebooks does not only facilitate students’ development of a deeper conceptual understanding, but it can also facilitate the development of academic writing skills- one of the problems teachers are faced with nowadays- by combining science and language skills (Klentschy, 2006). There are many research studies which present the value of student notebooks as an assessment tool in science (Aschbacher & Alonzo, 2006; Huerta, Lara-Alecio, Tong, & Irby, 2014; Huerta, Irby, Lara-Alecio, & Tong, 2016; Ruiz-Primo et al., 2004; Shelton et al., 2016).
potentially rich sources including student artefacts. The notebooks allow students to record their experiences of science classes throughout the term. Those experiences in science are shaped by teaching practices. Therefore, the notebooks can serve as a useful tool to investigate how students interpret teaching activities throughout science classes during the term. The analysis of international research on students’ science notebooks reveal that studies have generally focused on the texts within students’ notebooks (Huerta et al., 2016; Ruiz-Primo & Li, 2013; Shelton et al., 2016; Wickman, 2010). On the other hand, there seems to be a scarcity of research on the visual learning elements within students’ science notebooks (Cole, Wilhelm, & Yang, 2015; Fulton et al., 2017; Nesbit et al., 2004). To the best of our knowledge, there has not been any study conducted on visual representations located in students’ science notebooks in Turkey. There are only a few studies which focused on pre-service science teachers’ notebooks (Calıskan, 2014) and diaries (Toman & Odabası Cimer, 2014).
Research Questions
The need of the current study arises considering the importance of science notebooks providing written and visual support to learning processes. As such, the research questions that guided the present study were:
1- What kinds of visual representations are used in 8th grade student science notebooks? What are their frequencies of use?
2- Do visual representations change from one class unit to another? 3- Do visual representations change from one school to another?
Method
Research Design
The present study is a case study that was conducted in primary schools in the Kars Province in eastern Turkey. The aim of the study was to investigate the contents of 8th grade students’ science notebooks which were accumulated throughout an academic year. Case studies focus on a deeper analysis and description of everyday life phenomena and/or events (Merriam, 2002; Yin, 2009). The present study adopted an “embedded multiple case study” design. Embedded multiple case study designs investigate multiple cases each of which may include multiple sub-units of analysis. Such designs allow for comparison and contrast between cases (Creswell, 2013; Simsek & Yıldırım, 2008). In this context, the study is have analyzed case of usage visual learning means of middle school 8th grade students visual learning means both at school more than one and in terms of different students in this school.
Materials and Data Collection
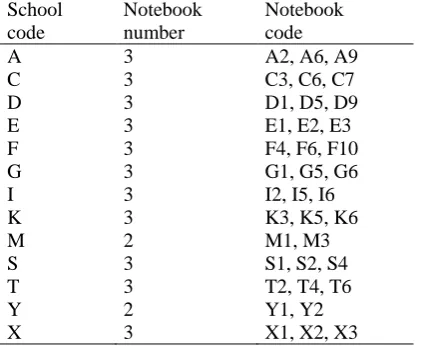
The data analysis technique utilised in the present study was document analysis which is qualitative in nature. The literature defines documents as “physical data”. Documents represent objects that have been created by people. Therefore, documents can contain important information about individuals. Analysing written and visual documents regarding the research questions can provide an opportunity to make rich and comprehensive interpretation (Bas & Akturan, 2008). The documents analysed in the present study were selected from 93 8th grade student notebooks that were collected voluntarily from 13 different secondary schools located in the Kars Province in the east of Turkey in 2018. Although the total number of secondary schools in Kars city centre is 22, nine of those schools did not provide us with student notebooks, and were not included in this study. However, different school profiles (i.e. low, medium, and high achieving schools) were all represented in this study.
Table 1. Schools participating in the study and the distribution of the notebooks School
code
Notebook number
Notebook code
A 3 A2, A6, A9
C 3 C3, C6, C7
D 3 D1, D5, D9
E 3 E1, E2, E3
F 3 F4, F6, F10
G 3 G1, G5, G6
I 3 I2, I5, I6
K 3 K3, K5, K6
M 2 M1, M3
S 3 S1, S2, S4
T 3 T2, T4, T6
Y 2 Y1, Y2
X 3 X1, X2, X3
Data Analysis
The analysis of documents is a crucial stage in a study since the researcher(s) should interpret the contents of the collected document(s). The contents of a document should be coded into appropriate categories (Harris, 2001; Bas & Akturan, 2008). Each of the notebooks included in the study was analysed in terms of the types and frequencies of the visual representations used in each unit of the 8th grade science curriculum. Furthermore, the analysis also aimed to identify the differences between visual learning representations utilised in science classes across the schools included in the study.
Table 2. Sample coding categories of the visual representations in students’ science notebooks Code Description of the code
Diagram
A visual representation that establishes connections between the parts or branches of a mechanism within a schema (i.e. water cycle)
A visual representation that helps us understand the working principles of an objects or see within it (Moline, 1995)
Table A visual that generally does not include pictorials and represents a structure that consists of rows and columns (Moline, 1995)
Graphic A visual representation used to present data that has been measured (Moline, 1995) Drawing Visualising an idea on a two-dimensional background
Picture Visuals that represent how things look like in nature (Turkish Language Association [TLA], 2019)
Model Visual representations that are made to look like a certain artefact
Concept Map A two-dimensional visual representation of the relationship among concepts (Novak 1990; Novak & Cañas, 2008)
Highlighter Markings that are made using highlighters
Box A visual representation that looks like a square or rectangle and used to highlight the importance of scientific ideas
Tag A small piece of paper that is used to summarize the features of an object or idea Scribble Notes that are not in an orderly fashion and that have been recorded randomly
Acronym A visual which utilises the first letters of texts or concepts to create a word that makes the text or concept easier to remember.
Star A visual representation that is used to highlight the importance of an idea and placed at the beginning of that idea
Bubble Circling an idea in order to highlight it
Scale A graph that is used to show measurements (TLA, 2019)
Pyramid An object that consists of a number of triangles the tops of which merge on a shared point and the bottoms of which comprise one side of a polygon (TLA, 2019)
Flow Chart A chart that is used to show the relationship between each step as well as show the direction of the relationship in order to describe a process
A total of 2889 pages in 37 notebooks were analysed for their visual content. A number of coding categories were pre-determined and based on the related literature that had previously content analysed student notebooks for the visuals used (Moline, 1995; Vekeri, 2002; Coleman & Dantzler, 2016; Tippett, 2016). Other coding categories emerged whilst previewing the data and initial visual representation codes were created. Those coding categories were further developed during the analysis. The resulting coding included a total of 18 categories (table, graphic, formula, drawing, picture, pyramid, diagram, scribble, model, scale, acronym, tag, bubble, box, highlighter, star, concept map and flow chart) for visual representations (see Table 2). Afterwards, we investigated to previous studies that focused on analysing student notebooks (Danish & Saleh, 2014; Huerta, Lara-Alecio, Tong, & Irby, 2014; Ruiz-Primo et al., 2004; Ruiz-Primo & Li, 2013). Coding examples of students’ visual representations are provided in Appendix C.
Contents relating to each unit of the science curriculum in students’ notebooks were separately analysed by both authors. All notebooks were coded by both authors and the frequency of the codes which emerged in the data has been represented with numbers. The comparison between the coding completed by both authors on the unit of “Light and Sound” revealed that one of the authors did not recognize the bubble visual used in one of the students’ notebooks to highlight important information. Following this, the codes that both authors created for the unit of “Light and Sound” were all compared to confirm that coding. The interrater reliability index for the whole set of codes was calculated as 86 %. Moreover, another researcher independently coded the unit of “Simple Machines” for 14 notebooks and that coding was compared to the authors coding and the interrater reliability for that comparison was found to be 90 %.
Findings
This section presents details regarding the distribution of visuals in 8th grade students’ science notebooks in different curriculum units, schools, and students’ notebooks. The tables were created considering the visual codes that were present in students’ notebooks. The findings, which were based on the analysis of the data through a total of 18 visual representation codes, differed in terms of frequency from one unit to another. The tables included visual representation codes that were only present in the related curriculum unit. Details relating to visual representations that were not available in any students’ notebooks in a specific unit were added as a note under related tables.
Findings on the kinds and frequency of visual representations in student notebooks at school and unit level
Main findings about the visual representations used in 8th grade student science notebooks have been presented under the unit headings of the science curriculum. Each of the tables presented below include details regarding the schools (i.e. school codes), gender of the students who owned the notebook, number of pages that the notes cover for the unit, and the kinds of visual representations. The tables below are prepared in accordance with the units covered in the 8th grade science curriculum: Human Reproduction, Growth, and Development (Table 3); Simple Machines (Table 4), Structure and Characteristics of Matter (Table 5), Light and Sound (Table 6), Living Organisms and Energy Relationships (Table 7), States and Characteristics of Matter (Table 8), Electricity in Our Lives (Table 9), and Earthquakes and Weather Events (Table 10).
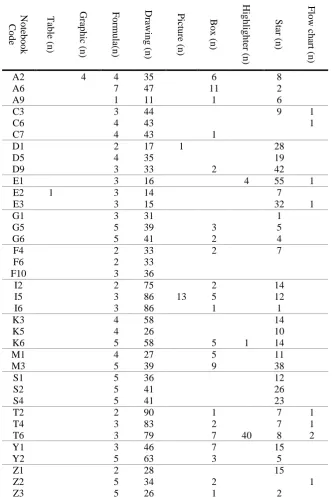
Table 3. Frequencies of the visual representations in student notebooks for the “Human Reproduction, Growth, and Development” unit
No te book Cod e Table ( n) Gr aphic (n ) Fo rm ula(n) Dr awing (n) Pict ur e (n) M odel (n) Acro nym (n ) Box ( n) Highli gh te r (n) Star (n ) Con ce pt map (n) Flow cha rt (n )
A2 1 2 4 1 10
A6 1 12 1 2 39
A9 2 5 1 2 11
C3 1 4 2 15 8 1
C6 1 4 2 12 9 1
C7 1 4 2 12 5 1
D1 1 1 4 13 3 85 4
D5 1 2 8 4 3 66 2
D9 1 2 12 2 2 1 2 110 3
E1 3 2 6 1 32
E2 2 2 13 1 10
E3 2 2 6 35
G1 5 2 12 2
G5 5 2 12 2 2 1 2
G6 5 2 13 2 2 1 1 2
F4 1 2 10
F6 1 2 9 1 1
F10 1 2 12 1
İ2 1 1 1 13 1 61 1
İ5 1 1 13 2 1 65 1
İ6 1 1 1 9 2 1 1 9 1
K3 1 1 2 17 1 1 2 5 1
K5 1 1 2 10 1 59
K6 1 1 2 14 1 1 8 1
M1 2 1 2 12 1 2 19
M3 1 2 14 1 62 1 1
S1 1 2 2 13 6 33
S2 2 2 2 13 1 1 46 1
S4 2 2 2 13 1 8 55 1
T2 2 1 14 1 72 5
T4 1 5 2 9 1 70 1
T6 2 2 6 1 20 48
Y1 2 2 5 3 14 1
Y2 3 2 10 1 2 7
Z1 1 1 2 9 1 1 14
Z2 3 1 2 11 1 7
Z3 2 1 2 8 2
Note: The following visual representations were not present in any students’ notebooks for this curriculum unit and, thus, were not presented in the table; pyramid, diagram, scribble, tag, scale, and bubble.
Table 4. Frequencies of the visual representations in student notebooks for the “Simple Machines” unit
No
te
book
Cod
e
Table (
n)
Gr
aphic
(n)
Fo
rm
ula(n)
Dr
awing
(n)
Pict
ur
e
(n)
Box (
n)
Highli
gh
te
r
(n)
Star (n
)
Flow cha
rt (n
)
A2 4 4 35 6 8
A6 7 47 11 2
A9 1 11 1 6
C3 3 44 9 1
C6 4 43 1
C7 4 43 1
D1 2 17 1 28
D5 4 35 19
D9 3 33 2 42
E1 3 16 4 55 1
E2 1 3 14 7
E3 3 15 32 1
G1 3 31 1
G5 5 39 3 5
G6 5 41 2 4
F4 2 33 2 7
F6 2 33
F10 3 36
I2 2 75 2 14
I5 3 86 13 5 12
I6 3 86 1 1
K3 4 58 14
K5 4 26 10
K6 5 58 5 1 14
M1 4 27 5 11
M3 5 39 9 38
S1 5 36 12
S2 5 41 26
S4 5 41 23
T2 2 90 1 7 1
T4 3 83 2 7 1
T6 3 79 7 40 8 2
Y1 3 46 7 15
Y2 5 63 3 5
Z1 2 28 15
Z2 5 34 2 1
Z3 5 26 1 2
Note: The following visual representations were not present in any students’ notebooks for this curriculum unit and, thus, were not presented in the table; pyramid, diagram, scribble, model, scale, acronym, tag, bubble and concept map.
of School E and S. On the other hand, it was found that students did not make any use of pyramids, diagrams, scrabbling, models, scales, acronyms, tags, or bubbles in the “Simple Machines” unit.
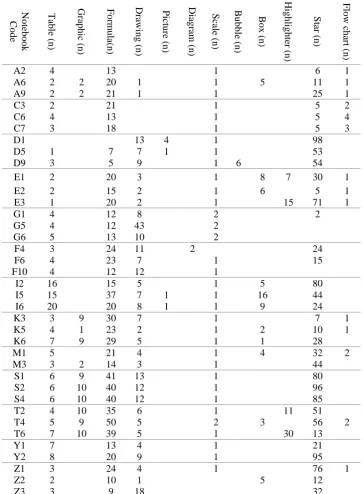
Table 5. Frequencies of the visual representations in student notebooks for the “Structure and Characteristics of Matter” unit
No
te
book
Co
de
Table (
n)
Gr
aphic
(n)
Fo
rm
ula(n)
Dr
awing
(n)
Pict
ur
e
(n)
Diag
ram (n
)
Scal
e (
n)
Bubble (
n)
Box (
n)
Highli
g
hte
r
(n)
Star (n
)
Flow cha
rt (n
)
A2 4 13 1 6 1
A6 2 2 20 1 1 5 11 1
A9 2 2 21 1 1 25 1
C3 2 21 1 5 2
C6 4 13 1 5 4
C7 3 18 1 5 3
D1 13 4 1 98
D5 1 7 7 1 1 53
D9 3 5 9 1 6 54
E1 2 20 3 1 8 7 30 1
E2 2 15 2 1 6 5 1
E3 1 20 2 1 15 71 1
G1 4 12 8 2 2
G5 4 12 43 2
G6 5 13 10 2
F4 3 24 11 2 24
F6 4 23 7 1 15
F10 4 12 12 1
I2 16 15 5 1 5 80
I5 15 37 7 1 1 16 44
I6 20 20 8 1 1 9 24
K3 3 9 30 7 1 7 1
K5 4 1 23 2 1 2 10 1
K6 7 9 29 5 1 1 28
M1 5 21 4 1 4 32 2
M3 3 2 14 3 1 44
S1 6 9 41 13 1 80
S2 6 10 40 12 1 96
S4 6 10 40 12 1 85
T2 4 10 35 6 1 11 51
T4 5 9 50 5 2 3 56 2
T6 7 10 39 5 1 30 13
Y1 7 13 4 1 21
Y2 8 20 9 1 95
Z1 3 24 4 1 76 1
Z2 2 10 1 5 12
Z3 3 9 18 32
Note: The following visual representations were not present in any students’ notebooks for this curriculum unit and, thus, were not presented in the table; scribble, model, pyramid, acronym, tag and concept map.
On the other hand, boxes, used by students to remark important information were frequently used by students in Schools I and E, but were not used by students in other schools. Flow charts were mostly present in student notebooks in School C, but they were infrequent or did not exist at all in notebooks collected from the remaining schools. In addition, pyramids, models, acronyms, tags, bubbles, and concept maps were not used by students in student notes for this unit.
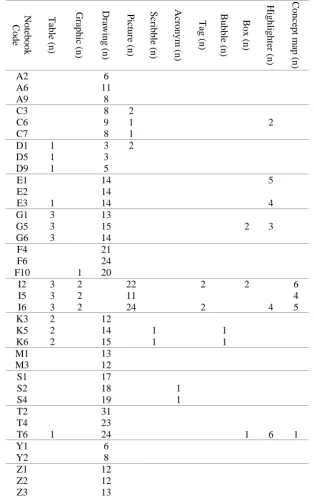
Table 6. Frequencies of the visual representations in student notebooks for the “Light and Sound” unit
No te book Cod e Table ( n) Gr aphic (n) Dr awing (n) Pict ur e (n) Scrib ble (n ) Acro nym (n ) Tag (n ) Bubble ( n) Box ( n) Highli gh te r (n) Con ce pt ma p ( n)
A2 6
A6 11
A9 8
C3 8 2
C6 9 1 2
C7 8 1
D1 1 3 2
D5 1 3
D9 1 5
E1 14 5
E2 14
E3 1 14 4
G1 3 13
G5 3 15 2 3
G6 3 14
F4 21
F6 24
F10 1 20
I2 3 2 22 2 2 6
I5 3 2 11 4
I6 3 2 24 2 4 5
K3 2 12
K5 2 14 1 1
K6 2 15 1 1
M1 13
M3 12
S1 17
S2 18 1
S4 19 1
T2 31
T4 23
T6 1 24 1 6 1
Y1 6
Y2 8
Z1 12
Z2 12
Z3 13
Note: The following visual representations were not present in any students’ notebooks for this curriculum unit and, thus, were not presented in the table; formula, pyramid, diagram, scales, model, star and flow chart.
The analysis of the visual representations in students’ notebooks showed that the most frequently used visual representations in the “Light and Sound” unit was drawing (Table 6). There were plenty of drawings in student notebooks with the exception of School D. Another interesting point was that stars, which were used by students to highlight important definitions and explanations, were not used at all in this unit.
concept maps, on the other hand, were only used by students in School T. Bubbles were only used by students in Schools K and I, though infrequently. Formulas, pyramids, diagrams, scales, model, star and flow charts were not used by students in this unit.
Table 7. Frequencies of the visual representations in student notebooks for the “Living Organisms and Energy Relationships” unit No te book Cod e Table ( n) Gr aphic (n) Fo rm ula(n) Dr awing (n) Pict ur e (n) Py ramid (n) Box ( n) Highli g hte r (n) Star (n ) Con ce pt map (n) Fl ow ch art (n )
A2 5 2 1 1 6 1
A6 5 1 1 1 4 1
A9 5 2 1 1 2 1
C3 4 2 2 2 1
C6 4 2 2 1 1
C7 4 2 2 1 1
D1 1 3 1
D5 13 1 3 1 5 1
D9 13 1 3 1 10 1
E1 1 2 1 1
E2 1 2 1 1
E3 1 2 1 4
G1 2 1 1 1 1
G5 1 1 1
G6 2 1 1 1 1 1
F4 12 2 13 4 11 1
F6 8 2 2 3 1
F10 12 2 3 2 1
I2 1 4 2 9 1 1 8
I5 4 2 9 1 2 7
I6 4 2 9 1 1 5
K3 5 2 8 2 11 2
K5 5 2 8 2 1 2 12 2
K6 5 2 8 2 14 1 2
M1 2 8 2 1 2 16 1
M3 1 7 2 5 1 36 1
S1 5 2 1 2 17 1 1
S2 5 2 1 2 23 1 1
S4 5 2 1 2 20 1 1
T2 6 2 4 3 20 1
T4 5 2 2 2 2 15 1
T6 5 2 4 2 2 19 1
Y1 2 4 9
Y2 2 4
Z1 2 8 2 1 2 44 1
Z2 4 1
Z3 2 12
Note: The following visual representations were not present in any students’ notebooks for this curriculum unit and, thus, were not presented in the table; diagram, model, scale, scribble, acronym, bubble and tag.
diagrams, scribbles, models, scales, acronyms, tags, and bubbles were not present in any of the notebooks collected.
Table 8. Frequencies of the visual representations in student notebooks for the “States of the Matter and Heat” unit
No
te
book
Cod
e
Table (
n)
Gr
aphic
(n)
Fo
rm
ula(n)
Dr
awing
(n)
Bubble (
n)
Box (
n)
Star (n
)
Flow cha
rt (n
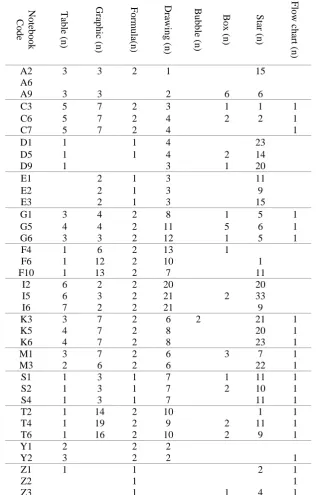
)
A2 3 3 2 1 15
A6
A9 3 3 2 6 6
C3 5 7 2 3 1 1 1
C6 5 7 2 4 2 2 1
C7 5 7 2 4 1
D1 1 1 4 23
D5 1 1 4 2 14
D9 1 3 1 20
E1 2 1 3 11
E2 2 1 3 9
E3 2 1 3 15
G1 3 4 2 8 1 5 1
G5 4 4 2 11 5 6 1
G6 3 3 2 12 1 5 1
F4 1 6 2 13 1
F6 1 12 2 10 1
F10 1 13 2 7 11
I2 6 2 2 20 20
I5 6 3 2 21 2 33
I6 7 2 2 21 9
K3 3 7 2 6 2 21 1
K5 4 7 2 8 20 1
K6 4 7 2 8 23 1
M1 3 7 2 6 3 7 1
M3 2 6 2 6 22 1
S1 1 3 1 7 1 11 1
S2 1 3 1 7 2 10 1
S4 1 3 1 7 11 1
T2 1 14 2 10 1 1
T4 1 19 2 9 2 11 1
T6 1 16 2 10 2 9 1
Y1 2 2 2
Y2 3 2 2 1
Z1 1 1 2 1
Z2 1 1
Z3 1 1 4 1
Note: The following visual representations were not present in any students’ notebooks for this curriculum unit and, thus, were not presented in the table; picture, pyramid, diagram, scribble, model, scale, acronym, tag, highlighter and concept map.
almost half of the schools. Moreover, it was found that one of the students in School A did not have any notes whatsoever on this unit (see Student A6). In addition, pictures, pyramids, diagrams, scribbles, models, scales, acronyms, tags, highlighters and concept map were not used at all by students in this unit.
Table 9. Frequencies of the visual representations in student notebooks for the “Electricity in Our Lives” unit
No
te
book
Cod
e
Dr
awing
(n)
Pict
ur
e
(n)
Acro
nym (n
)
Highli
g
hte
r
(n)
Star (n
)
Flow cha
rt (n
)
A2 14 6
A6 11 2
A9 15 2
C3 10
C6 10
C7 6
D1 6 9 25 1
D5 25 16 1
D9 12 9 1
E1 9 3
E2 9 3
E3 9 3
G1 6 4
G5 41 1 7
G6 12 2
F4 17
F6 17
F10 23
I2 33 11 1
I5 58 16 1
I6 62 4 1
K3 28 5
K5 29 3
K6 28 5
M1 22 1 9
M3 20 1 10
S1 19 23
S2 20 21
S4 21 22
T2 18 1
T4 17 12 1
T6 17 1 1
Y1
Y2 26
Z1
Z2 5 7
Z3 6 18
Note: The following visual representations were not present in any students’ notebooks for this curriculum unit and, thus, were not presented in the table; table, graphic, formula, pyramid, diagram, scribble, model, scale, tag, bubble, box and concept map.
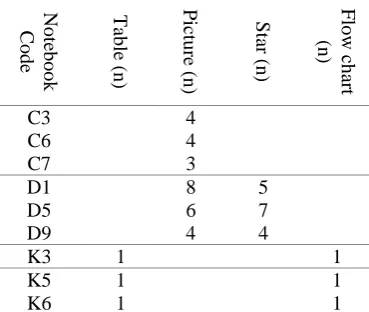
Table 10. Frequencies of the visual representations in student notebooks for the “Earthquakes and Weather Conditions” unit
No
te
book
Cod
e
Table (
n)
Pict
ur
e
(n)
Star (n
)
Flow cha
rt
(n)
C3 4
C6 4
C7 3
D1 8 5
D5 6 7
D9 4 4
K3 1 1
K5 1 1
K6 1 1
Note: The following visual representations were not present in any students’ notebooks for this curriculum unit and, thus, were not presented in the table; graphic, formula, drawing, pyramid, diagram, scribble, model, acronym, scale, box, highlighter, tag, bubble, no and concept map. Besides, for any notes or visuals did not have for this unit in student’s notebooks in Schools A, E, G, F, I, M, S, T, Y and Z, those has not showed in table.
The analysis of the visual learning representations for the “Earthquakes and Weather Conditions” unit showed that most students did not have any notes or visuals for this unit in their notebooks (see Table 10). The only exceptions were the notebooks collected from Schools C, D, K and Z. Only notebooks collected from students in Schools C and D included pictures. Tables and flow charts were only used once by students in School K. Additionally, stars, used to highlight important definitions and descriptions, were only used in School D and tables were only used once in notebooks collected from students in this school.
Discussion and Conclusion
(Ruiz-Primo, Li, Ayala, & Shavelson, 2000; Ruiz-(Ruiz-Primo, Li & Shavelson, 2001; Ruiz-Primo & Li, 2004; Ruiz-Primo & Li, 2013).
The second main finding in this study was that diagrams, models, concept maps, and pictures, which are considered to be very effective in developing student understanding, were made little use of by students or were not used at all across the curriculum units as well as the schools from which the notebooks were collected. On the other hand, graphics and tables were used more frequently than those visual learning tools. On her extensive review of literature investigating the use of diagrams between 2002 and 2014, Tippett (2016) found that diagrams made significant contributions to facilitate the comprehension of scientific concepts. Therefore, the conclusion reached at the end of analysing the collected notebooks- which suggest that students made very little use of diagrams- can be interpreted as an important drawback in supporting students’ science understanding. There could be different reasons for the lack of diagram use: a) teachers might have not been successful in relating that visual representation with the course content and b) teachers might not have been aware of the effectiveness of diagrams in communicating scientific knowledge. Research studies corroborate the idea that the use of such visuals facilitates the teaching of complicated science content by summarizing it through pictures and conceptual tags (Amare & Manning, 2007; Cromley et al., 2013; Gilbert, 2005; Gilbert, 2010; Gilbert & Treagust, 2009; Tippett, 2016; Waldrip & Prain, 2012; Waldrip, Prain & Carolan, 2010). Additionally, it has been observed that the use models were limited among students. However, models are considered as an important visual representation in science teaching (Gilbert, 2010; Harrison & Treagust, 2000). This is because models schematise the characteristics of science topics and facilitate the structuring and communication of scientific knowledge. Therefore, it is possible to argue that teachers of the students whose notebooks have been collected might have been ineffective in supporting students to develop perspectives of creating their own models. Furthermore, another interesting finding was the fact that concept maps were only used in two instances. Concept maps are visuals that summarize the organization of information about a certain topic (Novak & Cañas, 2008). Zwaal and Otting (2012) have defined concept maps as valuable visual learning tools that support the solution of problems, develop conceptual understanding, and remember information. Thus, it can be understood that the potential benefits of concept maps have been ignored during classes in the schools where the notebooks have been collected from. The reason for this finding might be that teachers did not consider themselves as sufficient enough to prepare such tools or considered the process of preparing such tools as a challenging one.
Similarly, the use of graphs was not frequent among students whose science notebooks were collected. The notebooks included graphs only in four units across four schools. Moline (1995) defined graphics as a visual learning tool used to present measurement results relating to specific data. The use of graphs can contribute to students’ questioning and knowledge structuring skills in certain topics (i.e. heat and temperature). The results in the present study suggested that the use of graphs among schools inadequate. Therefore, it can be interpreted that the science teachers in those schools were not successful in integrating graphics into teaching processes (i.e. providing explanations, interpreting graphs) regarding measurements. Tables, another visual representation, were frequently used in four units of the curriculum and at close frequencies across the schools. In their study conducted with 388 science teachers in the US, Coleman, McTigue and Smolkin (2011) found that the most frequently used visual representations by teachers were tables in science instruction. Moline (1995) defines tables as a two-dimensional visual learning tool that allows the structuring of knowledge by connecting information. The most basic characteristic of this visual learning tool is that it summarizes knowledge, thereby, facilitating the understanding and structuring of complicated science knowledge. It can be interpreted, that the use of tables across schools as well as curriculum units was not sufficient.
experience difficulties in understanding and structuring new knowledge in the future because of their lack of learning in the 8th grade.
Recommendations
The results of the present study suggest that science teachers selected for this study are insufficient in guiding students to use visual learning representation in order to make their learning more efficient. Therefore, it is clear that they need further professional development opportunities with regards to this aspect. Unfortunately, it has been observed that visual learning representations are not used frequent enough to develop science understanding of the students studying in schools where the notebooks were collected from. The present day main approach to develop students’ science understanding does not support the idea of students copying knowledge from the books or the teacher, but rather learning it through questioning and evaluation. And, in addition to writing, it is important to include different visual learning tools (i.e. models, diagrams, tables, and graphics) into that process. The most important point that should be highlighted in this respect is that teachers should guide students in how to take and record notes in their notebooks (Nesbit, Hargrove, Harrelson & Maxey, 2004). Whilst shaping students’ understanding of science concepts, teachers should provide students with opportunities to use visual representations (i.e. models, drawings, shapes, pictures, and diagrams) in addition to writing and also create opportunities for students to question their thinking. Additionally, science teachers should closely follow their students whilst taking notes into their notebooks and use those notebooks as assessment tools on an ongoing basis. NGSS (2013) highlight the importance of visual literacy for secondary school students to structure complicated knowledge. Therefore, science teachers should provide their students with opportunities to develop their visual literacy. One of the most important things that teachers could do to support their students’ development of visual literacy is to include various visual learning activities for different units/topics in their classes. Eventually, student notebooks provide important clues regarding within and out of class teaching practices experienced by students as well as the profiles of the teachers.
The following conclusions have been based on the findings; teachers should intensively review the notebooks of their students at the end of each unit and contribute to their students’ development of science understanding. Additionally, in-service training opportunities can be organized for teachers on how notebooks should be used in the teaching of specific science subjects. In this sense, guidance books specifically designed on how student notebooks should be used in science subjects (NSTA, 2008) and examples should be used to support teachers. Another suggestion is to integrate additional courses on, for example, how to use visuals and how to use student notebooks into science teacher preparation programs. Such courses should include observations of how student notebooks are used in real classes as well as provide opportunities to analyse such notebooks. Last but not least, the current situation should be analysed from the perspective of teachers and students through a more focused (i.e. focusing on just one unit of the curriculum) and/or much bigger sample size and different region.
References
Akaygün, S., & Jones, L. L. (2014). Words or pictures: A comparison of written and pictorial explanations of physical and chemical equilibria. International Journal of Science Education, 36(5), 783-807.
Amare, N., & Manning, A. (2007). The language of visuals: Text + graphics = visual rhetoric. IEEE
Transactions on Professional Communication, 50, 57–70.
Aschbacher, P., & Alonzo, A. (2006). Examining the utility of elementary science notebooks for formative assessment purposes. Educational Assessment, 11(3-4), 179-203.
Bahar, M., Nartgün, Z., Durmus, S. ve Bıcak, B. (2009). Geleneksel Tamamlayıcı Ölçme ve Değerlendirme
Teknikleri: Öğretmen El Kitabı (3. Baskı). Ankara: PagemA Yayıncılık
Bas, T., & Akturan, U. (2008). Nitel araştırma yöntemleri NVivo 7.0 ile nitel veri analizi. (1. baskı). Ankara: Seçkin Yayıncılık.
Baxter, G. P., Bass, K. M., & Glaser, R. (2000). An analysis of notebook writing in elementary science classrooms (CSE Tech. Rep. No. 533). Los Angeles: University of California, National Center for Research on Evaluation, Standards and Student Testing.
Butler, M. B., & Nesbit, C. (2008). Using science notebooks to improve writing skills and conceptual understanding. Science Activities, 44(4), 137-146.
Caliskan, I. (2014). An international comparative case study about using science notebooks in science teacher education. Education and Science, 39, 108-120.
Chang, N. (2012). What are the roles that children’s drawings play in inquiry of science concepts? Early Child
Development and Care, 182(5), 621–637.
Chapman, L. H. (2005). Status of elementary art education: 1997-2004. Studies in Art Education, 46(2), 118-137.
Cole, M., Wilhelm, J., & Yang, H. (2015). Student moon observations and spatial-scientific reasoning.
International Journal of Science Education, 37(11), 1815-1833.
Coleman, J. M., McTigue, E. M., Smolkin, L. B. (2011). Elementary teachers’ use of graphical representation in science teaching. Journal of Science Teacher Education, 22(7), 613-643.
Coleman, J. M., & Dantzler, J. A. (2016). The frequency and type of graphical representations in science trade books for children. Journal of Visual Literacy, 35(1), 24-41.
Cox, S. (2005). Intention and meaning in young children’s drawing. International Journal of Art & Design
Education,24(2), 115–125.
Creswell, J. W. (2013). Qualitative inquiry and research design: Choosing among five approaches (3rd ed.). Thousand Oaks, CA: Sage.
Cromley, J. G., Bergey, B. W., Fitzhugh, S., Newcombe, N., Wills, T. W., Shipley, T. F., & Tanaka, J. C. (2013). Effects of three diagram instruction methods on transfer of diagram comprehension skills: The critical role of inference while learning. Learning and Instruction,26, 45-58.
Crosland, M. P. (2004). Historical studies in the language of chemistry. Mineola, NY: Courier Dover Publications.
Danish, J. A., & Enyedy, N. (2007). Negotiated representational mediators: How young children decide what to include in their science representations. Science Education, 91(1), 1–35.
Danish, J. A., & Saleh, A. (2014). Examining how activity shapes students' interactions while creating representations in early elementary science. International Journal of Science Education,36(14), 2314-2334.
Eddy, M. D. (2018). 'The nature of notebooks: How enlightenment school children transformed the tabula rasa.
Journal of British Studies, 57(2), 275-307.
Forsberg, E., & Wermke, W. (2012). Knowledge sources and autonomy: German and Swedish teachers’ continuing professional development of assessment knowledge. Professional Development in Education, 38(5), 741-758.
Fulton, L., & Campbell, B. (2014). Science notebooks: Writing about inquiry. Portsmouth, NH: Heinemann. Fulton, L., Paek, S., & Taoka, M. (2017). Science notebooks for the 21st century. Science & Children, 54(5),
54–59.
Gilbert, J. K. (2005). Visualization: A metacognitive skill in science and science education. In J. K. Gilbert (Ed.), Visualization in science education (pp. 9–28). Boston: Kluwer Academic publishers.
Gilbert, J. K. (2010). The role of visual representations in the learning and teaching of science: An introduction.
Asia-Pacific Forum on Science Learning and Teaching, 11(1), 1-19.
Gilbert, J. K., & Treagust, D. (2009). Multiple representations in chemical education. Dordrecht, The Netherlands: Springer.
Glen, N. J. (2008). Writing in elementary school science: Factors that influence teacher beliefs and practices
(Unpublished doctoral dissertation). Syracuse University, Syracuse, NY.
Glen, N. J., & Dotger, S. (2013). Writing like a scientist: Exploring elementary teachers’ understandings and practices of writing in science. Journal of Science Teacher Education, 24(6), 957-976.
Grimberg, B. I., & Hand, B. (2009). Cognitive Pathways: Analysis of students' written texts for science understanding. International Journal of Science Education, 31(4), 503-521.
Gunel, M., Hand, B., & Prain, V. (2007). Writing for learning in science: A secondary analysis of six studies.
International Journal of Science and Mathematics Education, 5, 615–659.
Hand, B. (2017). Exploring the role of writing in science: A 25 year journey. Literacy Learning: The Middle Years, 25(3), 16–23.
Hand, B., Gunel, M., & Ulu, C. (2009). Sequencing embedded multimodal representation in a writing to learn approach to the teaching of electricity. Journal of Research in Science Teaching,46(3), 225–247. Hand, B., Wallace, C. W., & Yang, E. (2004). Using a science writing heuristic to enhance learning outcomes
from laboratory activities in seventh-grade science: quantitative and qualitative aspects. International Journal of Science Education, 26(2), 131–149.
Harris, H. (2001). Content analysis of secondary data: A study of courage in managerial decision making.
Journal of Business Ethics, 34(3/4), 191–208.
Harrison, A. G., & Treagust, D. F. (2000). A typology of school science models. International Journal of
Science Education,22, 1011-1026.
Henderson, G. (1999). Learning with diagrams. Australian Science Teachers’ Journal, 45(2), 17-25.
Huerta, M., & Garza, T. (2019). Writing in Science: Why, how, and for whom? A systematic literature review of 20 years of intervention research (1996–2016). Educational Psychology Review.
https://doi.org/10.1007/s10648-019-09477-1
Huerta, M., Irby, B. J., Lara-Alecio, R., & Tong, F. (2016). Relationship between language and concept science notebook scores of English language learners and/or economically disadvantaged students.
International Journal of Science and Math Education, 14(2), 269–285.
Huerta, M., Lara-Alecio, R., Tong, F., & Irby, B. J. (2014). Developing and Validating a Science Notebook Rubric for Fifth-Grade Non Mainstream Students. International Journal of Science Education,36(11), 1849-1870.
Huerta, M., Tong, F., Irby, B. J., & Lara-Alecio, R. (2016). Measuring and comparing academic language development and conceptual understanding via science notebooks. The Journal of Educational Research,109(5), 503-517.
Jang, J., & Hand, B. (2017). Examining the value of a scaffolded critique framework to promote argumentative and explanatory writings within an argument-based inquiry approach. Research in Science
Education, 47(6), 1213–1231. doi: 10.1007/s11165-016-9542-x
Keys, C. W., Hand, B. M., Prain, V., & Collins, S. (1999). Using the science writing heuristic as a tool for learning from laboratory investigations in secondary science. Journal of Research in Science Teaching, 36, 1065–1084.
Klentschy, M. (2006). Science Notebooks Essentials. Science and Children, November/December, 24-27. Lee, T. D., & Jones, M. G. (2017). Elementary Teachers’ Selection and Use of Visual Models. Journal of
Science Education and Technology, 27(1), 1-29.
Madden, L., & Wiebe, E. N. (2013). Curriculum as experienced by students: How teacher identity shapes science notebook use. Research Science Education, 43, 2567–2592.
Merriam, S. B. (Ed.). (2002). Qualitative research in practice: Examples for discussion and analysis. San Francisco, CA: Jossey-Bass.
Mishra, P. (1999). The role of abstraction scientific illustrations: Implications for pedagogy. Journal of Visual Literacy, 19(2), 139-158.
Moline, S. (1995). I see what you mean. York, ME: Stenhouse Publishing.
Morris, J., Jehn, T., Vaughan, C., Pantages, E., Torello, T., Bucheli, M., Lohman, D. & Lue, R. (2007). A student’s guide to writing in the life sciences. Harvard University: C. D. Vaughan.
Morrison, J. A. (2008). Elementary preservice teacher’s use of science notebooks. Journal of Elementary Science Education, 20(2), 13-21.
Next generation science standards (NGSS) Lead States. (2013). Next generation science standards: For states,
by states. Washington, DC: The National Academies Press.
National Research Council [NRC]. (2007). Taking science to school: Learning and teaching science in grades K-8. Washington, DC: The National Academies Press.
National Research Council [NRC]. (2012). A framework for K-12 science education: Practices, crosscutting
concepts, and core ideas. Washington, DC: National Academies Press.
National Science Teachers Association [NSTA]. (2008). What Is a Science Notebook? N S T A Reports, 7-14. National Science Teachers Association [NSTA]. (2011). Official positions, Assessment. Retrieved July 12, 2017,
from http://www.nsta.org/about/positions/assessment.aspx?print=true.
Nesbit, C. R., Hargrove, T. Y., Harrelson, L., & Maxey, B. (2004). Implementing science notebooks primary grades. Science Activities: Classroom Projects and Curriculum Ideas, 40(4), 21-29.
Nesbit, C. R., Hargrove, T., & Fox, K. (2003). Science notebooks: A tool for promoting inquiry learning? Paper presented at the annual international conference of the National Association for Research in Science Teaching, Vancouver, British Columbia.
Novak, J. D. (1990). Concept maps and vee diagrams: two metacognitive tools for science and mathematics education. Instructional Science, 19(1), 29-52.
Novak, J. D., & Cañas, A. J. (2008). The Theory underlying concept maps and how to construct and use them.
Technical Report IHMC CmapTools 2006-01 Rev 01-2008. Florida Institute for Human and Machine
Cognition.
Paek, S., & Fulton, L. A. (2017). Digital science notebooks: Perspectives from an elementary classroom teacher. Journal of Computers in Mathematics and Science Teaching, 36, 361–374.
Pelger, S., & Nilsson, P. (2016). Popular Science Writing to Support Students’ Learning of Science and Scientific Literacy. Research in Science Education, 46, 439–456.
Petterson, R. (2002). Information design: An introduction. Philadelphia: John Benjamin.
Reed, M. (2012). Science Notebooks: Improving Students’ Conceptual Understanding and Scientific Practices. Master of Science, Montana State University, Bozeman.
Rivard, L. P., & Straw, S. B. (2000). The effect of talk and writing on learning science: An exploratory study.
Science Education,84, 566–593.
Rouse, A. G., Graham, S., & Compton, D. (2017). Writing to learn in science: Effects on Grade 4 students' understanding of balance. The Journal of Educational Research, 110(4), 366-379.
Ruiz-Primo, M. A., Li, M., Ayala, C., & Shavelson, R. J. (2000, April). Students’ science journals as an assessment tool. Paper presented at the AERA annual meeting. New Orleans, LA.
Ruiz-Primo, M. A., Li, M., & Shavelson, R. J. (2001). Looking into students’ science notebooks: What teachers
do with them? CSE: Technical Report 562. Los Angeles, CA: Center for Research on Evaluation, Standards, and Student Testing/ University of California, Los Angeles.
Ruiz-Primo, M. A., Shavelson, R. J., Hamilton, L., & Klein, S. (2002). On the evaluation of systemic science education reform: Searching for instructional sensitivity. Journal of Research in Science Teaching, 39(5), 369–393.
Ruiz-Primo, M. A., & Li, M. (2004). On the use of students’ science notebooks as an assessment tool. Studies in Educational Evaluation, 30(1), 61–85.
Ruiz-Primo, M. A., Li, M., Ayala, C., & Shavelson, R. J. (2004). Evaluating students' science notebooks as an assessment tool. International Journal of Science Education, 26(12), 1477-1506.
Ruiz-Primo, M. A., & Li, M. (2013). Analyzing teachers’ feedback practices in response to students’ work in science classrooms. Applied Measurement in Education, 26, 163–175.
Seah, L. H. (2016). Understanding the conceptual and language challenges encountered by grade 4 students when writing scientific explanations. Research in Science Education, 46(3), 413–437.
Shelton, A., Smith, A., Wiebe, E., Behrle, C., Sirkin, R., & Lester, J. (2016). Drawing and writing in digital science notebooks: Sources of formative assessment data. Journal of Science Education & Technology, 25, 474–488.
Shepardson, D. P., & Britsch, S. J. (1997). Children’s science journals: Tools for teaching, learning, and assessing. Science and Children, 34(5), 13–17, 46-47.
Stern, E., Aprea, C., & Ebner, G. E. (2003). Improving cross-content transfer in text processing by means of active graphical representation. Learning and Instruction,13, 191–203.
Sugrue, B., Webb, N., & Schlackman, J. (1998). The interchangeability of assessment methods in science. CSE Technical Report 474. Los Angeles, CA: Center for the Study of Evaluation, National Center for Research on Evaluation, Standards, and Student Testing, Graduate School of Education & Information Studies, University of California.
Tippett, C. D. (2016). What recent research on diagrams suggests about learning with rather than learning from visual representations in science. International Journal of Science Education,38(5), 725-746.
Toman U., & Odabası Cimer S. (2014). Fen bilgisi öğretmen adayları günlüklerinin yansıtıcı düşünme yeteneklerine göre değerlendirilmesi. Bilgisayar ve Eğitim Araştırmaları Dergisi,2(4), 166-190. Turkish Language Association [TLA]. (2019, January 10). Retrieved from www.tdk.gov.tr.
Tweney, R. D. (1991). Faraday’s notebooks: The active organization of creative science. Physics Education, 26(5), 301–306.
Van Meter, P., Aleksic, M., Schwartz, A., & Garner, J. (2006). Learner-generated drawing as a strategy for learning from content area text. Contemporary Educational Psychology, 31(1), 142–166.
Van Meter, P., & Garner, J. (2005). The promise and practice of learner-generated drawing: Literature review and synthesis. Educational Psychology Review, 17(4), 285–325.
Vekeri, I. (2002). What is the value of graphical displays? Educational Psychology,14(3), 261-312.
Waldrip, B., & Prain, V. (2012). Learning from and through representations in science. In B. J. Fraser, K. Tobin, & C.J. McRobbie (Eds.), Second International Handbook of Science Education (pp. 145– 155). Dordrecht, The Netherlands: Springer.
Waldrip, B., Prain, V., & Carolan, J. (2010). Using multi-modal representations to improve learning in junior secondary science. Research in Science Education,40, 65-80.
Wickman, C. (2010). Writing material in chemical physics research: The laboratory notebook as locus of technical and textual integration. Written Communication, 27(3), 259-292.
Williams, M., Tang, K. S., & Won, M. (2019). ELL’s science meaning making in multimodal inquiry: A case-study in a Hong Kong bilingual school. Asia-Pacific Science Education, 5(3). doi.org/10.1186/s41029-019-0031-1
Wilson, R. E., & Bradbury, L. U. (2016). The pedagogical potential of drawing and writing in a primary science multimodal unit. International Journal of Science Education, 38(17), 2621-2641.
Wilson, S. (2008). Patterns of personal learning environments. Interactive Learning Environments,16(1), 17-34. Yau, K. W., & Mok, I. A. C. (2016). Insights from students’ private work in their notebooks: How do students
Yore, L. (2003). Examining the literacy component of science literacy: 25 years of language arts and science research. International Journal of Science Education,25(6), 689–725.
Zwaal, W., & Otting, H. (2012). The impact of concept mapping on the process of problem based learning.
Interdisciplinary Journal of Problem-Based Learning, 6(1), 104-128.
Yıldırım, A., & Simsek, H. (2008). Sosyal Bilimlerde Nitel Araştırma Yöntemleri (6. Baskı). Ankara: Seçkin Yayıncılık.
Yin, R. K. (2009). Case study research (4th ed.). Los Angeles, CA: SAGE.
Author Information
Tufan InaltekinKafkas University, Faculty of Education Kars, Turkey
Contact e-mail: [email protected]
Volkan Goksu
Kafkas University, Faculty of Education Kars, Turkey
Orcid: 0000-0001-8202-7730 Orcid: 0000-0002-3843-7393
Appendices
Appendix A. The picture of all collected student notebooks
An Example Visual Representation Code
An example of drawing for the States of the Matter and Heat unit (Student I5).
Drawing
An example of acrostic for the DNA and Genetic Code unit (Student S4)
Acronym
An example of flow diagram for the Transformation of Energy and Ecology unit (Student K6)
Diagram