Household Economic Decisions of Corn
Farmers at West Timor, Indonesia
SIlvErIuS lEkI
1,2*, NuHFIl HaNaNI
3,
rINI DWIaSTuTI
3and BuDI SETIaWaN
31Faculty of Agriculture, University of Nusa Cendana, Kupang, Indonesia. 2Post Graduate Program of Agriculture, Faculty of Agriculture,
University of Brawijaya, Malang, Indonesia.
3Faculty of Agriculture, University of Brawijaya, Malang, Indonesia. http://dx.doi.org/10.12944/CARJ.4.1.08
(Received: January 04, 2016; Accepted: February 20, 2016) aBSTraCT
The study aimed to identify factors that influence household economic decisions of corn farmers related to the allocation of time, production activities, corn consumption and policy simulation which can increase household economic of corn farmer. Research was conducted at Tesbatan and Camplong II Village, West Timor, Indonesia. Data were analysed using a system of simultaneous equations. Parameter estimation used Two Stage Least Square (2SLS) and simulation analysis was used for getting alternative policy. The result showed that household economic decisions of corn farmer were affected by the level of wages and farming area. Corn production was influenced by the farming area, the use of labor, urea fertilizer and seeds. Consumption of corn was affected by the price of corn, household income, corn production and the number of household members. Then, Consumption of purchased corn was influenced by household income, corn production and the number of household members. The policy to increase the price of corn was very effective increasing household income but reduce the consumption of corn. Furthermore, the policy of expansion of the scale of farming could increase household income and consumption of corn.
keywords: Corn, Consumption, Production, Household economic model.
INTrODuCTION
Corn (Zea mays) is one of the crops source of carbohydrates and protein that is strategic and economically valuable. The nutrient content of corn is relatively similar to rice even the protein content is higher than rice, so the corn can be used as a staple food in addition to rice. In 100 grams of milled yellow corn contained 361 calories, and 8.7 gr protein, 4.5 gr of fat, while in 100 grams of milled rice contained 360 calories, 6.8 gr protein, and 0.7 gr of fat1.The other uses from corn is as animal feed, pharmaceutical raw materials, dextrin, adhesives, textiles, cooking oil, and ethanol.
Corn is a plant originally came from Central America which spreaded to Asia and the rest of the
world by Spanish nation2. According to Fox, corn entering Timor region, East Nusa Tenggara (NTT) Province of Indonesia, in the 16-17 century3. The Dutch colonial government then promote corn as a food crop to overcome food insecurity and then quickly adopted by West Timor society. The result show that at Kupang Regency there were 53011 agricultural households. A total of 42640 or 80.44% farming households at Kupang Regency cultivate corn4. Corn cultivated by farm households due in accordance with the conditions of agro-ecosystems semi arid, economic conditions and socio-cultural society.
followed by Gorontalo Province 8 kg and North Maluku Province 5.4 kg5 per capita per year. Thereby corn is still an important food commodity for the people in NTT especially at Regency of West Timor region.
The household decision-making model was first proposed by Chayanov in the Theory of household utility maximization6. Becker develop a model farmer households with emphasis on the time allocation of households7. Barnum and Squire, said that the presence of the labor market is very influential in the performance model of family farming8. Singh et al., developing a basic model of the behavior of farming households with the assumption that households maximizes the utility function from the produced commodities,purchased commodities, as well as leisure9.
Research on the topic of economic models of farmer household have been conducted in Indonesia. Kusnadi conducting research with the goal of building an econometrical model of farmer households behavior on the imperfect competition market conditions by entering the shadow price of labor in the family and land to capture the market imperfections10. Fariyanti et al., using household economic models to analyze the production risk and price as well as the factors that influence the economic behavior of vegetable farmers households into the decision-making production, consumption, and allocation of labor11. It develop models of Barnum Squire to conduct research on household economic decisions of vegetable farmer at the Ngebrong village, Malang, Indonesia. The study found that farmers household consumption expenditure had significant effect on household decision-making process12.
Household cultivate corn is influenced by various factors, both internal factors and external factors of households. The condition of land and the farming area is an important farming capital and affect the overall activity of farming. Beside that in managing farming the corn farmers faced with limited labor. At certain moments it needed quite a lot of labor so that required additional labor from outside household. In farming beside land and labor are also required other production inputs
such as seeds, fertilizers, and pesticides. The use of production inputs will affect the production, profits and household income.
In the utilization of household income is faced with the choice of whether used for daily activities or used to support farming production activities. Production factors can cause changes in the size of farming profits and revenues. Furthermore major income can influence consumer demand and utilization of production inputs.
Therefore this study aimed to identify factors that influence household economic decisions of corn farmers related to the allocation of time, production activities, and consumption of corn as well as policy simulation which can increase household economic of corn farmer.
MaTErIalS aND METHODS
This research was conducted at Tesbatan Village, Amarasi Subdistrict and the village of Camplong II, Fatuleu Subdistrict, Regency of Kupang, Province of NTT, Indonesia. The samples were selected randomly as much as 10 percent from total households in each village. At Tesbatan Village, 37 samples were selected from 368 households where as at the village of Camplong II 77 samples were selected from 778 households in the village, so that the total is 114 respondents of households. Household Economic Model Specification of Corn Farmers
Household economic model in this study was developed based on the Barnum Squire and Singh et al., model8,9. As it was discussed before, peasant in under taking his farm is mostly faced in to three interrelated problem that he has to solve with. Peasant as a producer has to make a series of decision in term of his farm business, household consumption fulfilling, and labor allocation between on farm and off farm activities.
labor Block
The use of Total Labor For Corn Production (TCL) TCL = LWH + LOH ...(3.1) The Use of Household Labor For Corn Production (LWH)
LWH = a1.0 + a1.1 AWR + a1.2 PCP + a1.3HIC + a1.4 CFA + a1.5 NHM + a.16 ADI+ µ1 ...(3.2) hypothesis : a1.1 ;a1.3 < 0; a1.2 ;a1.4 ;a1.5 ;a1.6>0; The Use of Outside Household Labor For Corn Production (LOH)
LOH = a2.0 + a2.1 AWR + a2.2CFA + a2.3LWH + a.24 SHIC + µ2 ...(3.3) hypothesis :a2.1 ; a 2.3 < 0; a2.2 ; a2.4 > 0;
The use of Labor For Farming (LFF)
LFF = TCL + OKFL ...(3.4)
Production Block
The use of Urea Fertilizer for Corn Production The use of Urea Fertilizer (URF)
URF = a3.0 + a3.1PUR+ a3.2CFA + a3.3
NFEX + µ3 ...(3.5)
hypothesis : a3.1 ; a3.3 <0; a3.2>0;
The use of Fertilizer for Corn Production (SPF) SPF= a4.0 + a4.1 PSP+ a4.2 CFA
a43 NFEX + µ4 ...(3.6)
hypothesis : a4.1; a4.3<0; a4.2>0; Corn Production Costs (CPC)
CPC = (LOH*AWR) + (URF*PUR) + (SPF*PSP)+ (CS*PCS) + (OPC) …(3.7) Corn Production (CPD)
CPD= a5.0 + a5.1 CFA + a5.2 TCL + a5.3 URF + a5.4+a5.4SPF + a5.5 CS + µ5 ...(3.8) hypothesis : a5.1; a5.2; a5.3; a5.4;5.5; > 0;
Income Block Corn Profit (CPF)
CPF= PCP*(CPD- CCF) - CPC …(3.9) Farming Income (FIC)
FIC= CPF + OKFP …(3.10)
Household Income (HIC)
HIC= FIC + NFIC + SNIC + OIC ...(3.11) Surplus of Household Income (SHIC)
SHIC= HIC – HEX ...(3.12) Consumption Block
Household Expenditure (HEX)
HEX= FEX + NFEX ...(3.13) Expenditures Non Food (NFEX)
NFEX= EEX + HEX + HEX + OEX ...(3.14) Corn Consumption From Farming (CCF)
CCF= a6.0 + a6.1PPC + a6.2HIC + a6.3CPD + a6.4
NHM + µ6 ...(3.15)
hypothesis : a6.1<0; a6.2; a6.3; a6.4>0;
Corn Consumption From Purchasing (CCP) CCP= a7.0 + a7.1 HIC + a7.2 PPR + a7.3NHM +a7.4
CPD+ µ7 ...(3.16) hypothesis : a7.2; a7.4;< 0; a7.1; a7.3> 0;
Names of variables in models are presented in detail in Table 1.
Results of model identification is known that all identified structural equation over identified. Therefore, to estimate the parameters of structural equations in this study used the methods of Two Stage Least Square (2 SLS). To see the model predictive power is used Theil’s Inequality Coeficient (U-Theil), and its decomposition. While, to produce policy alternative was used simulation analysis.
rESulTS aND DISCuSSION
in accordance with the hypothesized according to economic theory. Based on statistical and economic criteria can be concluded that the model which built is quite well to be used.
Influenced Factor on the Household Economic Decision
labor Behaviour
The labor behavior in this study include the behavior of the use of labor within and outside the household for corn production and the use of labor for off-farm activities. Estimation result of equation parameter the use of labor in the corn farming and the elasticity presented in Table 2.
The behavior of the use of labor within the household for corn production significantly influenced by wage and corn farming area. The increase in farm wages 1 % resulting in the use of labor in the household is reduced 0.99 %. While each additional 1 % of farming area will increase 0.64 % the use of labor in the household. The price of corn factor, household income total, number of household members and index of diversification had insignificant effect on the use of labor in the household for corn production.
The use of labor outside household is significantly influenced by corn farming land area and labor within the household. Each increase of 1 % from farming area can cause the addition of 0.73 % on the use of labor outside household.
Estimation parameter of labor in the household is significant and have positive sign, indicate that the labor within the households with labor outside the household have complementary relationship. This occurs due to the use of labor outside the household are conducted with the labor system of mutual cooperation and help each other between citizens. At the time of planting and harvesting the farming owner invite neighbors or relatives to help. The labor outside the household together with the labor within the household work together to complete the work on the corn farming. This phenomenon also become the cause of income surplus has insignificant influence on the use of labor outside the household.
Production Behaviour
The production behaviors are the use of urea fertilizer and SP-36 and corn production behavior. Result of the equation the use of urea
Table 1: list of variable Name
CPC = Corn production costs CS =The use of corn seeds CCP = Corn consumption from purchases LEX = Lighting expenditure CCF = Corn consumption from farming HEX = Health expenditure
FEX = Food expenditure OEX = Others expenditure
NFEX = Non food expenditure EEX = Education expenditure HEX = Household expenditure PPR = Purchase price of rice
CPF = Corn profits PPC =Purchase price of corn
URF = The use of urea fertilizer PCP = Price of corn products SPF = The use of SP-36 fertilizer PCPSP = Corn price / SP-36 price
CPD = Corn production PCPUR = Corn price/ urea price
SHI = Surplus of household income PSP = Prices of SP-36 fertilizer TCL = The use of total labor for corn PUR = Prices of urea fertilizer LWH = The use of labor in household ADI = Agricultural diversification index LOH = The use of labor outside household NHM = Number of household members LFF = The use of labor for farming CFA = Corn Farming Area OKFL = Other kind of farm labor NLH = Number of labor in the household
HIC = Household income AWR = Agricultural wage rate
FIC = Farming income SNIC = Social safety net income
fertilizer and SP-36 which presented in Table 3 had has respecification several times so that obtained parameter estimation which in accordance with the economic and statistical criteria.
The behavior of the use of urea fertilizer and SP-36 for corn production is significantly affected by
the ratio of the price of corn with the price of urea fertilizer and SP-36 and also corn farming area. The estimation parameter value of corn price ratio with fertilizer is significant and has positive value means that households will increase fertilizer use if the price of corn is increase, conversely will reduce fertilizer use if there is an increase in fertilizer prices. Table 2: Estimation result of Equation Parameter The use of labor
Within and Outside The Household on The Corn Farming and The Elasticity
Explanatory variables labor Within labor Outside Household Household (lWH) (lOH)
Parameter Elasticity Parameter Elasticity
value value
Intercept 25.31944 NS) -3.53021NS)
Agricultural wage (AWR) -0.0008*) -0.9857 -0.00004NS) -0.1137 Corn farming area (CFA) 46.44305***) 0.6420 22.88576***) 0.7295 Agricultural diversification index (ADI) 1.313583NS) 0.0461
Number of household members (NHM) 0.711492NS) 0.1160 The price of corn products (PCP) 0.002461NS) 0.2621 Household income (HIC) 7.59E-08NS) 0.0133
Surplus of household income (SHIC) -4.6E-08NS) -0.0244
Labor within household (LWH) 0.304032***) 0.7011
F-Statistic 19.84***) 50.13***)
R2 0.5265 0.6478
DurbinWatson test 1.639801 1.819834
Note: ***) significant at 1 %; **) significant at 5 %; *) significant at 10 %; NS = Not Significant; Table 3: Estimation result of Equation Parameter the
use of Fertilizer For Corn Farming and The Elasticity
Explanatory variables The use of urea Fertilizer The use of (urF) SP-36 Fertilizer (SPF)
Parameter Parameter
value Elasticity value Elasticity
Intercept -3.45961NS) -4.64802**)
Corn price/urea Price (PCPUR) 12.54362***) 1.1043
Corn price/SP36 Price (PCPSP) 15.78106***) 1.2031
Corn farming area (CFA) 11.16883**) 0.5325 11.96158***) 0.9830 Non-food expenditure (NFEX) -5.5E-07NS) -0.2209 -3.2E-07NS) -0.2227
F-Statistic 20.67***) 31.02***)
R2 0.36047 0.4583
DurbinWatson test 1.72892 1.911046
Corn farming area has positive sign and significant, showed that the addition of farming area resulted in the increased use of urea fertilizer and SP-36. The estimation paremeter of non-food expenditure is not significant but has negative value according to expectations. This indicates there is a tendency addition of non-food expenditure resulted in a reduction in the use of urea fertilizer and SP-36 for the corn production.
The estimation results of equation parameter the corn production which presented in Table 4 indicates that each additional of one hectare corn farming area will increase 2149 kg corn production. Similarly, urea fertilizer significantly affect to corn production, but the use of SP-36 fertilizer is not significant. This condition happen because many farmers which do not give SP-36 fertilizer for corn crop and if it given the amount is still small and not
Table 4: The Estimation result of Equation Parameter Corn Production and The Elasticity
Explanatory variables Parameter value Elasticity
Intercept -14.7457NS)
Corn farming area (CFA) 2149.194***) 0.8446 Total of corn labor (TCL) 1.23638*) 0.0504 The use of urea fertilizer (URF) 5.00116***) 0.0412 The use of SP36 fertilizer (SPF) 0.112061NS) 0.0005
Corn seed (CS) 6.397264*) 0.0778
F-statistic 524.47***)
R2 0.96044
DurbinWatson test 2.31409
Note: ***) significant at 1 %; **) significant at 5 %; *) significant at 10 %; NS = Not significant;
Table 5: The Estimation result of Equation Parameter Corn Consumption From Farming result and From Purchasing and the Elasticity
Explanatory variables Corn Consumption Corn Consumtion from
from Farming (CCF) Purchasing (CCP)
Parameter Parameter
value Elasticity value Elasticity
Intercept -180.136**) -122.867NS)
The purchase price of corn (PPC) 0.022567*) 0.3276
The purchase price of rice (PPR) 0.012753NS) 4.4812
Household income (HIC) -0.00001***) -0.1719 -1.93E-6***) -0.3582 Corn production (CPD) 0.128811***) 0.4448 -0.00872*) -0.3250 Number of household 96.86665***) 1.5499 14.20451***) 2.4533 members (NHM)
F-statistic 37.59***) 13.28***)
R2 0.57972 0.32762
DurbinWatson test 1.367679 2.03388
reached the recommendation doze. The use of seed has positive effect on corn production. Results of this study is similar to the findings of Kariyasa, the regression coefficient of fertilizer was positive and significant at 1% probability level in corn farms and Surachmanet et al., corn farming is significantly affected by the use of urea fertilizer and the seed of corn16,17.
Corn Consumption Behaviour
The behavior of corn consumption distinguished on the corn consumption from own farming and corn consumption from purchasing. Results of the analysis which presented in Table 5, showed that corn consumption behavior from farming result is influenced by the total of household income, the purchase price of corn, corn production and the number of household members. Corn consumption behavior from purchasing is significantly affected by the total of household income, the price of rice, the number of household members and corn production.
Total of household income negatively affect on corn consumption both derived from the farming result and purchased with negative income elasticity indicates that corn is inferior goods for households. Results of this study is the same with Ariani and Pasandaran that the elasticity of total expenditure on
corn consumption in NTT is negative and the level of corn consumption is also influenced by household income18. This finding when compared to Leki who found the income elasticity of demand for corn in rural of West Timor at 0.6380 it can be said that in a time frame of 20 years there has been a shift in food consumption in West Timor from corn as a staple food becomes corn as inferior food19.
Corn production has positive influence on the consumption of corn from farming result. The more production the more supplies of corn so that households increase consumption of corn from farming result and reducing the consumption of corn from the purchasing. Number of household members has positive influence on the consumption of corn. The more members of the household will increase the consumption of the corn.
The estimation parameter of corn prices has positive sign indicates between purchased corn with the rice there is a substitution relationship through the price mechanism. This condition happened because income is a limiting factor for households, so that increase in rice prices led to reduced real income so that households reduced purchases of rice and adding corn purchases which cheaper but have the relative same nutrient content with rice to Table 6: actual value and Prediction, Decomposition value of u-Theil in uM, uS and uC
variable actual Prediction (%) (uM) (uS) (uC)
value value
TCL 41.1228 41.3187 0.476 0.0000 0.1100 0.8900
LWH 28.6842 28.7465 0.217 0.0000 0.1700 0.8300
LOH 12.4386 12.5722 1.074 0.0000 0.1300 0.8700
LFF 185.2 185.4 0.108 0.0000 0.1000 0.9000
URF 8.3162 8.3154 -0.010 0.0000 0.2500 0.7500
SPF 4.8246 4.8258 0.025 0.0000 0.1900 0.8100
PCP 578752 583222 0.772 0.0000 0.0900 0.9100
CPD 1009 1009.2 0.020 0.0000 0.0100 0.9900
CPF 1666684 1511551 -9.308 0.0500 0.0300 0.9200
FIC 10059201 9897365 -1.609 0.0000 0.0400 0.9600 HIC 15023851 14842756 -1.205 0.0000 0.0700 0.9300 SHIC 6565501 6466099 -1.514 0.0000 0.0700 0.9300
HEX 8458351 8376657 -0.966 0.0000 0.0500 0.9500
CCF 292.2 350 19.781 0.1200 0.1600 0.7200
CCP 27.0702 27.4066 1.243 0.0000 0.2500 0.7500
Table 7: The Impact of Policy Simulation on Household Economical Condition of Corn Farmer
variable SIM BaSIC SIM1 SIM2 SIM3
Total of labor for corn production (TCL) 41.3187 20.397 0.035 6.448 Labor within household (LWH) 28.7465 16.663 0.061 7.402 Labor outside household (LOH) 12.5722 28.936 -0.025 4.265 The use of labor for farming (LFF) 185.4 11.327 0.054 1.996 The use of urea fertilizer (URF) 8.3154 13.316 36.814 27.610 The use of SP-36 fertilizer (SPF) 4.8258 24.570 40.095 30.072 The use of corn seed (CS) 583222 22.135 0.205 4.676
Corn Production (CPD) 1009.2 22.711 1.546 1.486
Corn Farming Profit (CPF) 1511551 37.440 3.031 43.617
Farming income (FIC) 9897365 19.990 1.794 26.164
Total of household income (HIC) 14842756 14.865 1.390 19.987 Surplus of household income (SHIC) 6466099 29.185 2.815 37.094 Household expenditure (HEX) 8376657 3.811 0.291 6.781 Corn Consumption from farming (CCF) 350 2.143 0.000 -7.914 Corn Consumption frim Purchases (CCP) 27.4066 -22.828 -1.948 -21.366 Note: SIM 1: Expansion 25 % corn farming scale; SIM 2: Subsidize 25 % fertilizer price; SIM 3: Raising 25 % corn price;
meet the needs of the household. Results of this study similar with the findings of Surachman et al., that rice is a commodity substitution of corn17.
The Impact of Policy Simulation on the Household Economy
Validation process was perfor med following Pindyck and Rubinfied with the criteria of Theil’s Inequality Coeficient (U-Theil) as well as the decomposition20. Result of model validation presented in Table 6, seen the average value of UM and US which is close to zero and the value of UC which is close to one, then it can be concluded that the model is valid and able to be used for simulation analysis.
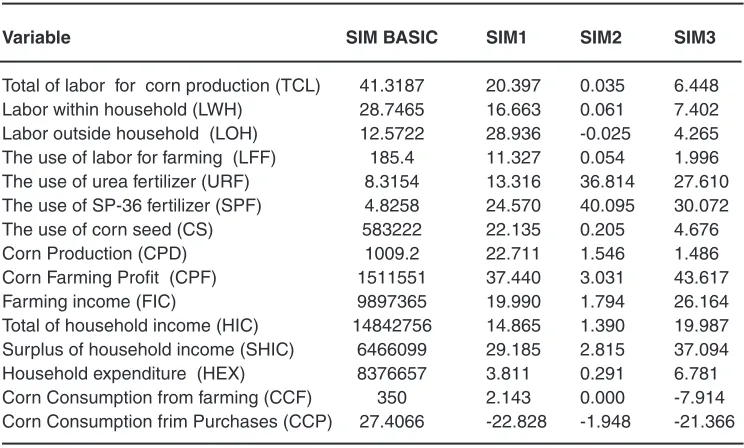
Policy simulation which performed included expansion simulation 25% farming scale, subsidizes 25% fertilizer and raising 25% product price. Simulation impact on the changes of household economic condition of corn farmer is presented in Table 7.
The policy of expansion 25% corn farming scale causing the use of farming labor and the use of fertilizer increased led to the production of corn
increased so that increase farm profits 19.99%, household income increase 14.86% and surplus income increase 29.19%. Increased production led to increase corn supplies thus increasing consumption of corn from farming result while corn consumption from purchases is reduced.
Policy simulation of subsidize 25% fertilizer price, resulting in the use of urea fertilizer and SP-36 and farming labor increase consequently the production of corn increased by 1.55%. Increased production led to increased corn farming profits 3.03%, household income increases 1.39% and household income surplus increase 2.82%. This policy does not affect the consumption of corn from farming result, but the consumption of corn from purchasing slightly has reduction.
by various factors as follows:
a. The behavior of the use of labor in the household and labor outside household is influenced by the level of wages and corn farming area. Between labor in the household and labor outside household there is a complementary relationship because the existence of mutual cooperation working system in working corn farming.
b. The behavior of the use of urea fertilizer and SP-36 fertilizer is influenced by the ratio of the corn price with fertilizer priceas well as corn farming area.
c. Corn production is influenced by farming area, labor utilization, urea fertilizer and seed. d. Consumption of corn from farming result is
affected by the price corn, household income, the production of corn and the number of household members.
2. The policy of the increase in the corn price is very effective to increase household income but reduce the consumption of corn. The policy of expansion of farming scale able to increase household income and consumption of corn from farming result. Thereby for subsistence and semi-commercial farmers scale of priorities needs to be given on the policy of expansion of the farming scale followed by the increase in product prices and fertilizer subsidies.
total and also surplus of household income increase respectively 19.98 %and 37.09%. This policy led to the consumption of corn from farming result or purchased is reduced.
Based on the three simulations showed that the simulation of raising the corn price gives a large enough impact on the changes in the economic condition of households namely show a significant increase on the total income and surplus of household income. However, this policy led to a decrease in consumption of corn. Decrease in consumption of corn causing household will shift the consumption from corn to other food sources, especially to rice. The subsequent result the level of dependence of households on food from outside become higher. So in the long run will threaten household food security. The policy of expansion of corn farming scale besides increasing household income also increasing corn production thus increasing the consumption of corn from farming result and reducing the consumption of purchased corn. There by for subsistence and semi-commercial farmers scale of priorities needs to be given on the policy of expansion of the farming scale followed by the increase in product prices and fertilizer subsidies.
CONCluSIONS
1. The behavior of house hold economic decision-making of corn farmers are affected
rEFErENCES
1. Hardinsyah and Briawan D., Penilaian dan Perencanaan Konsumsi Pangan, Jurusan Gizi Masyarakat dan Sumberdaya Keluarga. Fakultas Pertanian, IPB, Bogor (1990) 2. Wilkes G., Corn, Strange and Marvelous: But
Is a Definitive Origin Known. In Smith C.W., and Betran J. (Eds), Corn: Origin, History, Technology, and Production, Wiley, New York, 3-63 (2004).
3. Fox J., Harvest of the Palm. Ecological Change in Eastern Indonesia, Harvard University Press, Cambridge (1977). 4. BPS Kabupaten Kupang, Hasil Sensus
Pertanian Kabupaten Kupang Provinsi Nusa Tenggara Timur 2013 Pencacahan Lengkap,
Badan Pusat Statistik Kabupaten Kupang, Kupang (2014).
5. BKP., Produksi dan Konsumsi Jagung, Ubi Jalar dan Ubi Kayu di Indoensia Tahun 2014, Pusat Penganekaragaman Konsumsi dan Keamanan Pangan, Badan Ketahanan Pangan Kementerian Pertanian, Jakarta (2014)
6. Ellis F., Peasant Economics: Farm Hiusholds and Agrarian Develompment Analysis, Fifth Edition, Jhon Wiley and Sons Inc, New York (1988).
Pengembangan Depertemen Pertanian dengan Lembaga Penelitian dan Pengabdian Masyarakat Universitas Brawijaya, Malang (2008).
15. Ilsan M., Ketahanan Pangan Rumahtangga Petani pada Tiga Tipe Agroekosistem di Sulawesi Selatan, Disertasi, Proram Ilmu Pertanian Minat Ekonomi Pertanian, Program Pascasarjana Universitas Brawijaya, Malang (2015).
16. Kariyasa, I. K., Economic Impact Assessment of Integrated Crop Management Farmer Field School Program On Corn Production In Indonesia , International Journal of Food and Agricultural Economics , IJFAEC 2 (4), 13-26, (2014).
17. Surachman H., Bodri B., Resnia R., Nuryati Y., Wirastuti A., Wahyuniarti D., et al., Kajian Pengembangan Model Proyeksi Jangka Pendek Pasar Komoditas Pangan Pokok, Pusat Penelitian dan Pengembangan Perdagangan dalam Neger i Badan Penelitian dan Pengembangan Perdagangan Kementerian Perdagangan, Jakarta (2009). 18. Ariani M., Pasandaran E., Pola Konsumsi
dan Permintaan Jagung Untuk Pangan, Ekonomi Jagung, Badan Penelitian dan Pengembangan Pertanian Depertemen Pertanian (2005).
19. Leki S., Keragaman Konsumsi dan Permintaan Beberapa Bahan Pangan Pokok di Timor Barat, Tesis. Program Pascasarjana Universitas Gadjahmada, Yogyakarta (1993).
20. Pindyck R.S., and Rubinfeld D.L., Econometric Models and Economic Forecasts, McGraw Hill, USA (1991).
8. Barnum H.N., and Squire L., A Model of an Agricultural Houshold. Theory dan Evidence, Published for theWord Bank, The Johns Hopkins University Press, Baltimore and London (1979).
9. Singh I., Square L., and Strauss J., Basic Model. Theory Empirical Result and Policy Conclusions. In Sigh. I., L. Square and J. Strauss (Eds). Agricuktural Houshold Models Extenssions, Applications dan Policy, The Johns Hopkins University Press, Baltimore and London, 17-42 (1986).
10. Kusnadi N., Perilaku Ekonomi Rumahtangga Petani Dalam Pasar Persaingan Tidak Sempurna di Beberapa Provinsi di Indonesia, Disertasi, Sekolah Pascasarjana Institut Pertanian Bogor, Bogor (2005).
11. Fariyanti A., Kuntjoro S.,Hartoyo, Daryanto A., Perilaku Ekonomi Rumahtangga Petani Sayuran Pada Kondisi Resiko Produksi dan Harga Di Kecamatan Pangelanggan Kabupaten Bandung. Jurnal Agro Ekonomi 25(2), 178 – 206 (2007).
12. Hanani, N and Yonekura, Economic Decision Making of Vegetable Peasant Household. http://nuhfil.lecture.ub.ac.id/.../jepang-jurnal-nuhfil.pdf (2009)
13. Koestiono D., Analisis Ekonomi Rumahtangga Dalam Usaha Konservasi (Kasus Di Lahan Kering Jawa Timur Bagian Selatan), Disertasi, Program Studi Ilmu Pertanian, Program Pasca Sarjana, Universitas Brawijaya, Malang (2004).