Page 60 www.ijiras.com | Email: [email protected]
Hydrological Simulation And Yield Analysis Of Rice Using Aqua
Crop Model For A Microclimatic Variability Study
Ankita Kakoti Das
B.E. in Civil Engineering, M Tech in
Water Resources Engineering and Management, IIT Guwahati
I. INTRODUCTION
Three soft wares namely ClimWat 2.0
ETo Calculator and Aqua Crop
are linked one after another to do a multisimulation of the selected crop fields. The software used here were used to carry out specific simulated crop management and crop yield with respect to water requirements and to check whether there is a water excess or deficit or for other reasons for changes in yield values over time. A large number of parameters affect its yield thus making it a complex phenomenon in itself. Here the effects of only four parameters have been chosen for the hydrological and yield analysis of the crop yield so as to check for any climate variability if it exists.
Climate change studies can be presumed to be still in the nascent stage. Climate concerned with atmosphere ignores the coupling that exists between atmosphere and the land and
ocean surfaces. Therefore, modern climate system is depicted as five subsystems linked by exchanges of energy, mass and momentum among the subsystems. Change in climate conditions and the frequency of natural disasters in recent times has made it imperative to find lasting adaptation solutions for the agricultural sector. Given the rise of global average surface temperatures by 0.740C in the last hundred years (NOAA), efficient management of the agricultural sector using appropriate adaptation strategies has become a necessity.
II. GENERAL TREND OF CLIMATE CHANGE IN INDIA
The IPCC(2007) projected that temperature increase by the end of this century is expected to be in the range of 1.8 to 4.00 C.For the Indian region, the IPCC projected 0.5 to 1.20C rise in temperature by 2020,0.88 to 3.160C by 2050 and 1.5 to
Abstract: This paper presents the findings of a study carried out as part of climate change study to analyze the impacts of selected climate parameters on the growth and yield of rice applicable to local conditions (Borjhar, Guwahati, Assam, India) using Aqua Crop model. Rice has been chosen for the analysis as it is the most stable food option in north east India as well as in the whole country and in many countries worldwide.
From the multi simulation performed, it was found that yield values of rice in the study area i.e. Borjhar varied mostly with changes in climate parameters like the normal rainfall, temperature, sunshine hours and relative humidity pattern. The changes in the yield values were found to vary in similitude in both spatial and time scales when generated in several iterative simulations in Aqua Crop. The temperature anomalies and its rapid changes observed is an important climate parameter that requires research as it can cause widely disturbing variations in crop yield worldwide. A major challenge has been observed in rice production; that is, to enhance water use efficiency (WUE) and maintain or increase grain yield.
Keywords: climate change, yield of rice, Aqua Crop
Page 61 www.ijiras.com | Email: [email protected] 5.440C by 2080 depending on the future development scenario
(IPCC 2007 b).
Overall, the temperature rise is likely to be much higher during the winter (Rabi) rather than in the rainy season (Kharif).It is projected that by the end of the 21st century, rainfall over India will increase by 10-12% and the mean annual temperature by 3-50C.The warming is more pronounced over land areas with a maximum increase over northern India. (IARI 2008)
These environmental changes are likely to increase the pressure on Indian agriculture, in addition to the on-going stresses of yield stagnation, land use, competition for land, water, and other resources and globalization. It is estimated that by 2020, food grain requirement would be almost 30-50%vmore than the current demand (Paroda and Kumar, 2000).This will have to be produced from the same or even the shrinking land resource due to increasing competition for land and other resources by the non-agricultural sector.
III. LITERATURE REVIEW
A. OBSERVED IMPACTS OF CLIMATE CHANGE ON INDIAN AGRICULTURE: A MACRO LEVEL REVIEW
Two most common climate parameters affecting climate changes are increasing temperatures and changes in rainfall pattern, which are expected to impact the agricultural sector. Researches use several methods to access the impact of climatic variability ranging from the traditional approach of historical data analysis by various statistical tools to controlled environmental studies and Crop Simulation models in recent times in order to understand impact of temperature, rainfall and CO2 on crop growth and yield (Aggarwal, 2008).
An increase in ambient CO2 is usually considered
beneficial as it results in increased photosynthesis in several crops, especially those with C3 mechanism of photosynthesis. However, despite these beneficial effects, the combined increase in temperature and variability of rainfall would considerably affect food production. Some studies indicate a probability of 10-40 % loss in crop production in India with increase in temperature by 2080-2100 (Aggarwal, 2008).The modeling based estimates supported equivalence with the field observations.
An analysis of the historical trends in yield of rice in India by IARI during the last three decades are showing a declining trend and this may be partly related to the gradual change in weather conditions in the last two decades (Aggarwal.2008).A detailed data set of the climate parameters of ten years (2001-2011) collected from the Regional Meteorological Department were used as input data in ETo Calculator and Aqua Crop for rice simulation and yield analysis. All the analysis possible in Aqua Crop is suited to non-flooding condition of crop fields or where there is scarcity of rainfall. Hence to allow crop rotation in such conditions become imperative and also allow growth of crops other than rice(e.g. wheat, maize, other cereals and pulses) or which require lesser rainfall(fruits, vegetables) or where it is less dry areas.
IV. MATERIALS AND METHODS
The combination simulation methodology adapted to simulate paddy yield response to water has been carried out with climate data feedback partly generated from ClimWat and real time data of the station closest to the crop field near Guwahati Airport from the Regional Meteorological Station, Borjhar.
The step by step methods for running the software are enumerated below:
Climate file containing daily precipitation, monthly minimum and maximum temperature, relative humidity and solar radiation data for a time period of 11 years as collected from Regional Meteorological Centre are for use in the ETo Calculator. Furthermore, synthetic data and the geographical location of the crop field station in map are generated using CLIMWAT 2.0
The crop simulation of the parametric data is performed using the ETo calculator along with AquaCrop in the region using the climate data collected following step 1. The crop yield simulation and data analysis are performed
for analysis on usage of water for rice production using the Aqua Crop model.
Hydrological/Water balance model using ETo Calculator and Aqua Crop of the crop fields is therefore created. The simulated model will give a trend of the change in the climate at regional level for the selected crop region. This simulated study is relevant in the context that the changes observed and forecasted in terms of crop water deficit or rainfall excess or deficit will indicate the regional micro-climate change in terms of variations in observed values in the chosen time period with respect to important climate parameters included in the empirical models. The FAO 56 PM model as a system is the balance equation with the state variables of the various fluxes as amount deposited which changes from an initial condition(start year, date, month) as consequences owing to the stochastic transport processes (in air, soil and vegetation) as deductions (ie absorption, diffusion) and the additions (i.e. crop-field). Considering steady-state it is assumed that it does not exchange materials with the environment (material transport with water in the crop field).This is therefore the ideal or expected condition of the crop field. Flooding condition is not considered as it an unexpected condition that can affect the forecasted crop yield in a particular year.
The ETo calculator assesses the reference evapotranspiration (ETo) from meteorological data by means of the FAO Penman- Monteith equation. This method has been selected by FAO as a standardized method because it closely approximates grass ETo at the location evaluated, is physical based, and explicitly incorporates both physiological and aerodynamic parameters.
Page 62 www.ijiras.com | Email: [email protected] weather variables are missing, procedures are used for
estimating missing climatic data from temperature data or from specific climatic conditions according to methodologies outlined in the Irrigation and Drainage Paper No. 56: "Crop Evapotranspiration". Even where the dataset contains only maximum and minimum air temperature, it is still possible to obtain reasonable estimates for ten-day or monthly ETo. For the CO2 emissions, one-hundred year GWPs from IPCC, 1996
(Second Assessment Report) were used to convert emissions to CO2 equivalents. By selecting appropriate lower and upper
limits for meteorological data, the program applies a quality check when specifying or importing data. Specified and derived climatic data, including ETo, can be exported in text files compatible with Aqua Crop.
V. RESULTS AND DISCUSSION
A. SIMULATION RESULTS
While many factors continue to influence climate, several studies have established that human activities have become a dominant force, and are responsible for most of the warming observed over the past 50 years (NOAA, UN-FAO). In this study an effort has been made to understand the impact of climate change on the crops as they largely matter in studies related to changes in climate parameters, mainly temperature, relative humidity, precipitation alterations and sunshine hours in the non-flooding condition of crop fields. In the Evapotranspiration Calculator these are the parameters considered for simulation of evapotranspiration and creating the climate data files for crop simulation in Aqua Crop. The Aqua Crop model has been found to generate consistent crop yield results when compared with the actual observations.
B. PHYSICAL INTERPRETATIONS USING EXCEL FOR COMPARISON
Meteorologists put a great deal of effort into observing, understanding and predicting the day-to-day evolution of weather systems. Using physics-based concepts that govern how the atmosphere moves, warms, cools, rains, snows, and evaporates water, meteorologists are typically able to predict the weather successfully several days into the future. As climate changes, the probabilities of certain types of weather events are affected. For example, as Earth’s average temperature has increased, some weather phenomena have become more frequent and intense (e.g., heat waves and heavy downpours), while others have become less frequent and intense (e.g., extreme cold events).
At first a comprehensive comparative physical interpretations of the climate parameters as derived from Excel is presented here to understand the linear flow pattern of the individual climate parameters, which are considered most important in climate change studies. A few of the graphical representations of numerical analysis in the ETo calculator and Aqua Crop are presented here, which are two dimensional scenarios of the hydrological process of rice crop field and establishes itself as substantially standard model to be correlated and compared with other graphical representations.
Following are the figures of physical interpretations of some climate parameters derived in Excel-2007 with the observed data of Regional Meteorological Centre near Gauhati Airport.
Figure 5.2.1: Trend of Sunshine Hours over monthly time scale as in Excel Chart
It is observed that there have been more severe fluctuations in sunshine hours in 2011. The month to month variations from January to April shows steady rise in 2001 but varying during the same time scale in 2011. Sunshine hours therefore is considered a significant parameter in depicting climate change.
Figure 5.2.2: Graphical representation of actual rainfall data in Gauhati Airport from 2001 to 2011(3D profile)
Figure 5.2.3: 2D Linear profile of sunshine hours and minimum and maximum temperatures for the period
2001-2011 as generated in Excel
Page 63 www.ijiras.com | Email: [email protected] Figure 5.2.4: Actual Relative Humidity data displayed as a
histogram
Relative Humidity variations however in the station point have not been more severe but steady and seems to be a controlled effect of the rainfall pattern in the area which has also been steady.
C. COMPARATIVE GRAPHICAL OUTPUTS FROM ETO CALCULATOR
A series of comprehensive comparative graphical outputs as obtained from ETo Calculator, some of which are presented here.
Figure 5.3.1: Climate file of meteorological data calculations from 2001 to 2011 for every month in 11 years time A sudden increase in daily rainfall data is observed as compared to a steadily varying trend between 2001 to 2010.Rainfall in between 2005 to 2010 have been quite low compared to 2011-2013.
Figure 5.3.2: Results of Evapotranspiration calculations based on monthly climate data as generated in the ETo Calculator (2001-2011) showing consistent trend from 2001 to
2011
D. CROP CHARACTERISTICS MODELS AS
GENERATED IN AQUA CROP
A series of graphical outputs and numerical data estimates as obtained in Aqua Crop (Version 4.0) is presented here which are consistent outputs observed for the simulation runs of rice crop-field.
Figure 5.4.1: Flowering and Yield Formation profile showing degree days of stages of the growing cycle for a single
simulation
E. COMPARATIVE RICE SIMULATION RESULTS (2001-2011) AS OBTAINED IN HIGH AND LOW YIELD ENVIRONMENT (COMBINED) USING AQUA CROP
Figure 5.5.1: Climate crop soil water model with biomass and yield values of rice in Aqua Crop for a single crop season
(winter simulation) in low yield environment
The model displays a biomass of 19.152 ton/ha and rice yield of 1.396 ton/ha with 90% canopy cover and accounting for only 11% of harvest index. Therefore, it can be concluded that the available water productivity of rice have not been utilized to full capacity under rain fed condition.
Page 64 www.ijiras.com | Email: [email protected] It shows a CO2 concentration of 372.12 ppm and total
ET consumption of 96.6 mm(2.6 mm/day).The simulation run time considered is from 22 August to 11 March 2002(winter production) with rainwater utilized at 472.00 mm and equivalent amount as infiltration of the model developed.
F. SUMMARY OF PHYSICAL INTERPRETATIONS OF THE OBSERVED AND SIMULATED VALUES OF GROWTH AND YIELD OF RICE
Comparative physical interpretations of the observed and simulated values of growth and yield of rice as smoothed curves have been presented here as derived from Excel in low yield environment as the actual data collected correlates with the low yield environment crop simulation study.
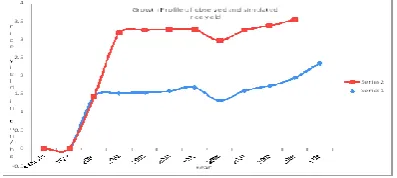
Figure 5.6.1: Growth Profile of observed and simulated rice production in low yield environment in Excel
In low yield environment the growth profiles of observed and simulated yield values show similitude in its trend from a consistent growth rate between 2001 to 2003 to decreasing trend in 2006 to again a rising trend till 2010.It varies with the profile of temperature fluctuations as simulated in ETo calculator as well as in Excel.
Therefore it can be concluded that yield values of crops varied in similitude with temperature and relative humidity as well as evapotranspiration changes in the crop field during the decadal time scale from 2001 to 2010.
VI. SUMMARY AND CONCLUSION
A. COMPARATIVE SUMMARY OF AQUA CROP
GENERATED RESULTS OF RICE YIELD NEAR GUWAHATI
A comparison of ETo Calculator results was done with graphs on the climate meteorological data and found to be similar in their profile changes. The ETo Calculator performs only linear analysis for the climate file data in two conditions viz. with rainfall and without rainfall. The graphics are similar as would one generate in Excel. The Aqua Crop model is a heterogeneous model of the crop field which can be said to be a watershed model of one of a kind. However the simulation software does not have the provision of altering any of the formulae inbuilt into the software. It is a software developed on the basis of theories and empirical equations. The underlying principles have been carefully selected to give shape to the simulation software so that it can be used and complies to the most heterogeneous conditions of crop fields specifically which requires good canopy cover.
In this hydrological study an attempt has been made to identify and represent graphically the spatial and temporal variability of precipitation, mean minimum and maximum temperatures, Humidity and Sunshine hours near Guwahati Airport by use of the ETo calculator. The performances of the Aqua Crop model in yield analysis have been proved to be satisfactory.
Based on available field data, the FAO Aqua Crop water driven model was selected to simulate yield for natural water supply and adequate supply of nutrients, Data of 2001 to 2010 cropping seasons were used for local calibration. Results were such that local calibration resulted in very minor changes of Aqua Crop coefficients (e.g., crop coefficient, harvest index, etc.). Simulated rice yield levels exhibited the greatest departure from measured data during the extremely wet year.
Most impact studies reveal the fact that surface runoff is more influenced by changes in evapotranspiration. This has arisen in part due to ignoring parameters other than temperature, such as wind speed, net radiation and humidity in calculating evapotranspiration. Under conditions of rising temperature, vegetation cover of basins will change significantly and hydrological models used in impact studies should allow for this.
Adaptation options such as growing improved varieties, efficient irrigation, fertilizer management and application of additional nitrogen can reduce the impacts of climate change on rice crops in the region. Improved crop management, as well as, better risk management through an early warning system and crop insurance policies can also be beneficial measures to reduce the vulnerability of the farmers. The ecology provides the scientific framework upon which conservation programs or pollution monitoring schemes can be set up.
B. TEMPERATURE ANOMALIES: ITS RAPID
CHANGES, AN IMPORTANT CLIMATE
PARAMETER THAT CAN CAUSE WIDELY
DISTURBING VARIATIONS IN CROP YIELDS WORLDWIDE
There have been increasing evidences of global temperature rises over the past century and the main reason has been attributed to anthropogenic emissions of GHG (Houghton et al. 2001).Globally, September 2012 is tied with September 2005 as the warmest September since temperature records began in 1880. September1912 is the coolest. August 2012 marks the 36th consecutive August and 330th consecutive month with a global temperature above the 20th century average.
Page 65 www.ijiras.com | Email: [email protected] C. CONCLUSIONS
Analysis shows that events of varying severity of temperature and rainfall fluctuations are frequent in the study region in specific pattern; a phenomenon observed closely in many regions of the north-east. The differences observed in yield, total dry weight and harvest index could be attributed to among various unknown reasons more importantly to the changing climate pattern(in a decadal time-scale) which requires further research; due to the type of rice grown in the region and the crop water irrigation conditions which can be analyzed using CROPWAT2.0. The major climate parameters affecting total yield of crops can be attributed to the variations in rainfall, mean temperature fluctuations, relative humidity and sunshine hours.
Thus a major challenge in rice (Oryza sativa L.) production is to enhance water use efficiency (WUE) and maintain or increase grain yield. However, such enhancement is largely a trade-off against lower biomass production. If WUE is defined as the grain production per unit amount of water irrigated, it would be possible to increase WUE without compromising grain yield through the manipulation of harvest index. Harvest index has been shown to be a variable factor in crop production, and in many situations, it is closely associated with WUE and grain yield in cereals. Statistical indicators i.e. the root mean square error (RMSE),Variance and Standard Deviation suggested that the model can be used to predict reliable yield values.
This conclusion was derived based on low values of the statistical indicators using Excel. The analyzed data groups show that the Aqua Crop model can be used in impartial decision-making and in the selection of crops to be given irrigation priority in areas where water resources are limited.
Taking rice as an example, this case study exemplifies crop management techniques that can enhance harvest index. Several controlling options such as controlled soil drying, alternate wetting and moderate soil drying regimes during the whole growing season, and non-flooded straw mulching cultivation, could substantially enhance WUE and maintain or even increase grain yield of rice mainly by improved canopy cover. Climate change studies identify the potential adaptation strategies for sustaining the yield of these crops.
REFERENCES
[1] Allen, R.G., Pereira, L.S., Raes, D. and Smith, M. (1998). Crop evapotranspiration: guidelines for computing crop water requirements. Irrigation and Drainage Paper no. 56. FAO, Rome, Italy, 300 pp.
[2] A.M. Michael. Irrigation theory and Practice. Vikas Publishing House Pvt. Ltd
[3] Bello, Richard L. (1982). Evapotranspiration in Greenhouses Open Access Dissertations and Thesis. Paper 1570
[4] CC-WaterS Draft. November, (2010).Climate Change and Impacts on Water Supply, WP 3 Climate Change. Final report
[5] Dr. S. V. Ngachan, Dr. A. K. Mohanty, & Dr. A. Pattanayak .Status Paper on Rice in North East India
[6] Debabrata Mitra, Jibesh Guha, Salil Kumar Choudhuri. Studies in Botany. Volume Two, Monlik Library
[7] C. Flanagan, J. E. Gilleyand T. G. Franti. Water Erosion Prediction Project (WEPP): Development History, Model Capabilities and Future Enhancements. Journal
[8] Ejieji C. J.( December, 2011).Performance of Three Empirical Reference Evapotranspiration Models under Three Sky Conditions using two solar radiation estimation methods at Ilorin, Nigeria. Agricultural Engineering International: CIGR Journal. Manuscript no.1673. Vol. 13, no.3
[9] GOI 2010.Annual report (2009-2010).Department of Agriculture and Co- operation, Ministry of Agriculture, Government of India, March 2010, 138 pp.
[10]IPCC, 2007a: Climate Change 2007: The Physical Science Basis. Contribution of Working Group I to the Fourth Assessment Report of the Intergovernmental Panel on Climate Change.[Solomon, S., D. Qin, M. Manning, Z. Chen, M. Marquis, K.B.M.Tignor and H.L. Miller(eds.).Cambridge University Press, Cambridge, United Kingdom and New York, NY, USA, 996 pp [11]IPCC, 2007b: Climate Change 2007: Impacts, Adaptation
and Vulnerability
[12]Joab Onyango Wamari, Sijali Vincent Isaya, Lee Heng Kheng, Esilaba Anthony Obutiatia, Joseph Mutwiri Miriti, Joab Onyango Wamari.2012.Use of Aqua Crop model to predict maize yields under depleted rainfall and elevated temperature in a semi-arid environment. J. Meteorol. Rel. Sci., 6, 23 –32
[13]Jeff Thorpe, Bill Houston, Stephen Wolfe, (April 2004).Impacts of Climate Change on Grazing Capacity of Native Grasslands in the Canadian Prairies.SRC Publication No. 11561-1E04
[14]Jun Furuya and Seth D. Meyer (August, 2006).Impacts of Water Supply Changes on the Rice Market of Lao PDR: Stochastic Analysis of Supply and Demand Model [15]L.Shelton, Maryln. Hydroclimatology Perspective and
Applications. Cambridge University Press
[16]M. Law, Averill, W. David Kelton. Simulation Modeling and Analysis.3rd Edition, TataMc-Graw Hill Series [17]Neelam Patel, P. Kumar and Neetu Singh. 2010.
Performance evaluation of Aqua Crop in simulating potato yield under varying water availability conditions. Water Technology Centre, Indian Agricultural Research Institute
[18]Nicklaus Lehmann, Robert Finger, Tommy Klein, Pierluigi Calanca, Achim Walter. (August, 2012). Adapting Towards Climate Change: A Bio economic Analysis of Winter wheat and Maize. (IAAE)
[19]Parry M.L., O.F. Canziani, J.P. Palutik of, and P.J. van der Linden, C.E. Hanson .Contribution of Working Group II to the Fourth Assessment Report of the Intergovernmental Panel on Climate Change. Cambridge University Press, Cambridge, United Kingdom and New York, NY, USA
Page 66 www.ijiras.com | Email: [email protected] [21]P. S. Ramakrishnan. Apatani wet rice cultivation: an
example of a highly evolved traditional agro ecosystem. School of Environmental Sciences, Jawaharlal Nehru University, 10p
[22]Potter, Thomas D., Colman, Handbook of weather, climate and water: Atmospheric Chemistry, Hydrology and Societal Impacts. Wiley Science
[23]Prof. A. K. Gosain, Dr. A. Mani, Mr. Chandramauli Dwivedi (October, 2009). Hydrological Modelling-Literature Review. Report No.1 A Indo-Norwegian Institutional Cooperation Program, 2009-2011
[24]Qiaozhen Mu, Faith Ann Heinsch, Maosheng Zhao, Steven W. Running. Development of a global evapotranspiration algorithm based on MODIS and global meteorology data .Numerical Terradynamic Simulation Group (NTSG), College of Forestry & Conservation, The University of Montana, 32 Campus Drive, Missoula, MT 59812, USA
[25]Raes, D., (January, 2009) .Evapotranspiration Reference Manual, Version 3.1. FAO, Rome, Italy, 38 p
[26]Raes, D., Steduto, P., Hsiao, T.C. and Fereres, E., (2011) AquaCrop—FAO Crop Model to Simulate Yield Response to Water: II. Main Algorithms and Software Description.124p
[27]Raes, D., Steduto, P., Hsiao, T.C., Fereres, E. and Heng L.,(2011).Aqua Crop Calculation Procedure, Version 3.1 FAO, Rome, Italy, 98 p
[28]Raes, D., Steduto, P., Hsiao, T.C., Fereres, E. and Heng L., (2011). Aqua Crop Reference Manual, Version 3.1, FAO, Rome, Italy, 21 p
[29]Sebastian Kloss, Raji Pushpalatha, Kefasi J. Kamoyo, Niels Schütze (September, 2011).Evaluation of Crop
Models for Simulating and Optimizing Deficit Irrigation Systems in Arid and Semi-arid Countries under Climate Variability
[30]Ven Te Chow, David R. Maidment, Larry W. Mays.Applied Hydrology. Mc Graw-Hill Book Company [31]Will Gujer. System Analysis for Water Technology.
Springer
[32]Willem W. Verstraeten, Frank Veroustraete and Jan Feyen.2008.Assessment of Evapotranspiration and Soil Moisture Content across Different Scales of Observation [33]Wood, A. W., E. P. Maurer, A. Kumar, and D.
Lettenmaier.2002.Long-range experimental hydrologic forecasting for the eastern United States., J. Geophys. Res., 107(D20), 4429, doi: 10.1029/2001JD000659 [34](Zeleke Gete et al) .BPCDG: Breakpoint Climate Data
Generator for WEPP Using Observed Standard Weather Data Sets. National Soil Erosion Research Laboratory, USDA-Agricultural Research Service, West Lafayette, Indiana, USA
[35]http://www.fao.org/landandwater/aglw/climwat.stm [36]http://www.cpc.ncep.noaa.gov (National Oceanic and
Atmospheric Administration (NOAA)) [37]http://www.mdpi.org/sensors
[38]http://www.rkmp.co.in [39]http://www.sciencedirect.com [40]FAO: AQUASTAT database (2010)
[41]http://www.fao.org/nr/aquastat.Accessed in November 2010