www.ijerd.com
Residence time distribution studies in flow through tubular
electrochemical reactor
J. Sendhil
1, P. K. A. Muniswaran
1, C. Ahmed Basha
21
Department of Chemical Engineering, SRM University, Kattankulathur 603203, Tamilnadu, India.
2 Department of Chemical Engineering, Adhiyamaan College of Engineering, Hosur – 635 109, Tamilnadu, India.
Abstract––Residence time distribution (RTD) measurements were carried out when electrolyte flows through a tubular electrochemical reactor having parallel plate electrodes using impulse response experiments. The experiments were performed at flow rates varying from 10 – 40 lph. A two-parameter model has been developed to explain the flow characteristics of electrolyte in the reactor and the proposed model is validated with experimental observations.
Keywords––Electrochemical reactor, Residence time distribution, Two-parameter model.
I.
INTRODUCTION
With the advent of industrial revolution in the last few decades, the main source of water pollution is the waste material discharged by the various industrial units such as textile industries, tanneries, dairies, refineries, chemical, plastic, food producing plants etc. These industries discharge wastewaters containing a variety of pollutants such as dyes, dissolved inorganic salts, organics and suspended material into public water bodies thus causing harmful and undesirable water pollution. Removal of pollutants and color from the industry wastewater has become a challenge especially in view of the stringent pollution control regulations.
Biological oxidation [1], adsorption [2], coagulation by aluminium or iron salts [3] are some of the traditional methods employed in the treatment of industrial waste water before their disposal or reuse. These physicochemical methods have many disadvantages in term of efficiency, cost, regeneration or secondary pollution [4-7] though they may be efficient and economical in some specific applications. In order to overcome these disadvantages, many attempts have been made to find new, efficient and low cost waste water treatment methods. In the recent years, wet air oxidation [8], ozonization [9], Fenton and photo Fenton oxidation [10], supercritical water oxidation [11] and electrochemical oxidation [12] are some of the new techniques tried in waste water treatment. Among these, electrochemical oxidation seems to be more promising as it offers many advantages such as selectivity, cost effectiveness, environmental compatibility, safety, energy efficiency, versatility and amenability to automation [13-15]. Lin and Peng [16] had applied this method for textile industry waste water and achieved significant removal of organic matter. Radha et al. [17] had investigated the effect of current density and pH in
the electrochemical oxidation treatment of textile effluent. Piya areetham et al [18] had conducted laboratory scale experiments in a cylindrical axial flow reactor to reduce color and COD in distillery waste water using electrochemical oxidation technique.
The flow behavior of electrolyte through a reactor plays a crucial role in the selection or design of the reactor. The residence time distribution (RTD) analysis has been widely used for evaluating the hydrodynamic performance of non-ideal chemical reactors. It helps in the diagnosis of stagnant and bypassing zones in stirred tanks or the dispersion and dead zones in plug flow reactors. Bengoa et al [19] used RTD analysis to model the flow between two electrodes in a filter press type electrochemical reactor and described the flow throughout the cell by a dispersed plug flow model. Carpenters and Roberts [20] investigated the mass transport and residence time charecteristics of a parallel plate oscillatory flow reactor and reported mass transport enhancement under certain conditions. They compared their results with that predicted by an axial dispersion model. Ferro et al [21] developed theoretical models for the evaluation of RTD curves on a variety of vessels and validated the models with experimental RTD curves taken from literature. Lima and Hodouin [22] measured the RTD in an industrial cynaditation tank and explained it by the presence of bypassing and stagnant zones in the reactor. Lidia and Martha [23] made a scale up study of an electrochemical reactor for treating textile waste water. Flow characteristics were defined by RTD function and experimentally determined decolorization efficiency was compared with that predicted by the knowledge of E(t) and kinetic expression. Hsu et al. [24] simulated the electrolyte flow through a channel of cylinders by a unit cell model and derived analytical expressions for the flow field and residence time distribution. They had validated the model with experimental observations. Andriy et al. [25] modeled RTD curves in a flow through super critical water oxidation (SCWO) unit by an axially dispersed plug flow model. Fernando et al. [26] employed the stimulus response technique in filter press type electrochemical reactor and observed at low and intermediate Reynolds number, the liquid flow pattern deviates considerably from axial dispersion model.
II.
THE PLUG FLOW ELECTROCHEMICAL REACTOR (PFER)
Figure 1 shows schematically a tubular electrochemical plug flow reactor with parallel plate electrodes.
Electrolyte flows through the reactor at constant volumetric flow rate, Q, and a linear velocity, u. For a single reaction of the form
A + ne- ↔ B (1)
The change in the concentration of reactant A from inlet to exit is given by
Q (CAi – CA) = (2)
This expression is of limited use in the design of the electrochemical reactor as it provides no insight into the micr oscopic variations of concentration, current density and electrode potential occurring along the ‘x’ direction in the reactor. Therefore a material balance on a finite differential section of length δx has become necessary.
QCA|x ─ QCA|x+ δx = (3)
where L is the overall reactor length.
Dividing equation (3) by δx and taking the limit as δx becomes infinitely small gives
─ Q = (4)
which can be written in the form
= ─ (5)
where d = and the factor, , the electrode area per unit volume.
For parallel plate configuration, = 1 / d where d is the inter-electrode gap. The electrode kinetics is assumed to follow Butler-Volmer type equation,
(6)
where and are the forward and backward reaction rate constants respectively and , are the surface concentrations.
Reaction (1) is assumed as irreversible and follows the Tafel reaction. Then the current density can be expressed in terms of the mass transport A for steady state operation as [27]
(7)
where represents the mass transfer coefficient of A. Equation (6) can be written for Tafel reaction as
(8)
Combining equations (7) and (8) the surface concentration can be eliminated resulting in surface concentration in terms of bulk concentration as
(9)
Substituting equation (9) in equation (5)
= d (10)
where is a Damkohler number and defined as .
which on integration gives
ln = ln ─ (11)
Equation (11) has two limiting forms for high and low Damkohler numbers for limiting current operations. At low , it reduces to the expression
ln = ln ─ kLA (12)
and at high reduces to
ln = ln ─ (13)
Equation (13) enables the computation of the rate constant of species A, (kf1) based on experimental observations.
2.1 The Dispersed Plug Flow Model in Reactor Design
(14)
The solution, for any form of end conditions, is [28]
(15)
where q = and k = kf1 is the appropriate Pseudo-first order rate constant
III.
THE RTD MODEL
As the individual fluid elements reside in the reactor for different lengths of time their residence time distribution can be expressed in terms of an exit age distribution E(t) diagram. At any instant of time the fraction of fluid which has spent a time between t and t + dt in the reactor is given by E.dt so that
(16)
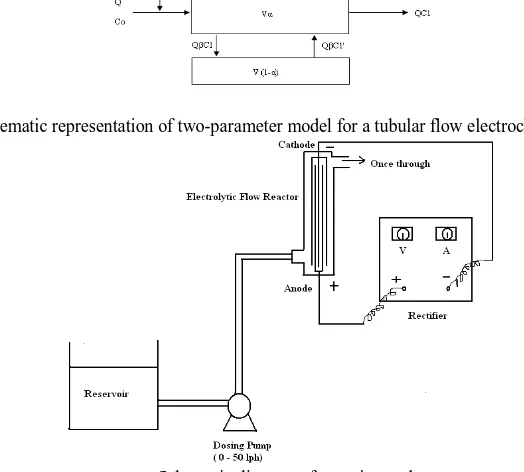
The present tubular reactor consists of parallel plate electrodes which disturb the electrolyte flow and cause mixing inside the reactor and it is assumed that the reactor consists of two zones namely active zone and dead zone and that there is fractional exchange of electrolyte between active and dead zones. The schematic representation of the proposed model is shown in Fig.2.
The electrolyte volume in the reactor is split into active volume (in active zone) and dead volume (in dead zone) which is expressed mathematically as
V = Vα + V(1 – α) (17)
where α is the fraction of active volume.
The active flow can be related to flow through active zone and dead zone by
Q = Qβ + Qβ (18)
where Q is the volumetric flow rate of the electrolyte and , and are the tracer concentrations of the electrolyte streams at the reactor inlet, reactor exit and in the stream reversing from the dead zone to active zone respectively. β represents the fraction of flow between dead and active zones.
The tracer material balance equation for the active zone in accordance with the proposed model is
Q Qβ = Q + Qβ + Vα (19)
The first term in equation (19) is eliminated using the condition, i.e., At t=0, and at t > 0;
The tracer balance for the dead zone can be written as
Qβ = Qβ + V (1-α) (20)
Equations (19) and (20) can be solved using Laplace transform with the boundary condition that at time t = 0, .
The initial tracer concentration can be calculated using the equation
(21)
where ‘q’ is the tracer quantity.
The tracer concentration in the active zone can be related to reactor active volume as
. (22)
= (23)
Taking Laplace transform and rearranging equations (19) and (20) yields (analytical solution of the equations is given in appendix)
(24)
where , , are given by
(25)
And and are given by
(26)
(27)
The residence time distribution function for a pulse input of tracer is obtained by taking inverse Laplace transform of equation (24) using a Heaviside Expansion theorem [29] as
(28)
Equation (28) can be used to determine the exit age distribution function of tubular electrochemical reactor for pulse tracer input.
IV.
EXPERIMENTAL
The schematic diagram of the experimental set up is shown in Fig.3. It consists of a reservoir, dosing pump and the tubular electrolytic flow reactor, connected with rubber tubes. The reactor is a cylindrical acrylic column of 5cm diameter and 21.5cm length having a hold up volume of 350 ml. It has an inlet at the bottom and an outlet at the top and is connected to 0-20 A and 0-15V DC regulated power supply. The reactor has three (03) number of parallel plate cathode (20cm x 3cm x 0.15cm) and two (02) number of anode (20cm x 3cm x 0.15cm) held vertically and parallel to each other with an inter electrode gap of one (01) cm in between the electrodes. All the electrodes were made of mixture of metal oxides (RuO2,
IrO2, and TiO2) of 6µm thickness coated over titanium base metal.
Experiments were conducted in the tubular flow reactor for studying residence time distribution and assessing COD reduction and color removal. For RTD studies the tubular reactor was operated with water as electrolyte fluid and Acid Green V dye solution as tracer in pulse input. The samples were analyzed using UV-vis spectrometer. For electrochemical oxidation, synthetic dye effluent of Acid Green V has been prepared at two different inlet concentrations. The electrolysis was carried out under galvanostatic mode covering a wide range of operating conditions. Samples were collected at the outlet of the reactor for the estimation of color removal, COD reduction and pH at steady-state conditions.
V.
RESULTS AND DISCUSSION
The electrolyte behavior in the electrochemical reactor has been simulated for pulse tracer input using the model equation and are presented in Figs. 4-7. The exit age distribution E(t) can be calculated from tracer output using the following equation.
(29)
where c(t) represent the exit tracer concentration at time ‘t’. The mean residence time can be calculated as
(30)
The E(θ) has been calculated using equation (28) and converted to E(t) by dividing mean residence time of the electrolyte.
reactor. Further, it can be inferred that when β = 0, E(t) gives the age distribution of only the active zone indicating the absence of the dead zone.
The effect of active volume fraction α on exit age distribution for a given exchange flow ratio β =0.5 and a steady electrolyte flow rate Q =10 lph is shown in Fig.5. It is seen that the active volume fraction seem to have no significant impact on the residence time distribution function. It can be inferred from Fig.4 and 5 that increase in the exchange flow ratio β and decrease in the volume occupied by the dead zone (1- α) increase the active volume of the reactor. The reduction in the effective active volume of the reactor caused by the increased dead zone volume is compensated by the enhanced mixing between the two zones due to the increased exchange flow ratio thus resulting in negligible influence on the residence time distribution.
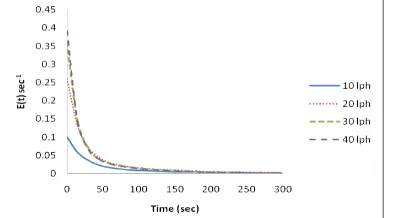
Fig.6 shows the variation of residence time distribution function with four different flow rates of 10, 20, 30 and 40 lph , keeping the exchange flow ratio of 0.5 and 50% active reactor volume. The residence time distribution is found to decrease with increase in the flow rate.
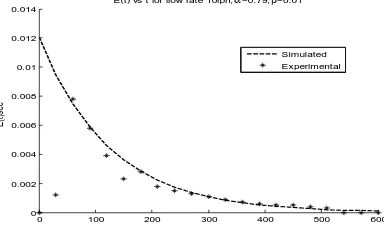
Residence time distribution was determined experimentally by conducting tracer studies with Acid green V dye as the tracer solution and water as the electrolyte. The observations are presented in Fig.7. It is seen that the residence time distribution is decreased with increase in the electrolyte flow rate. The reactor active volume and th e exchange flow ratio have been determined for the present experimental conditions and are listed in Table 1. The active volume and the exchange flow ratio are found to increase with increase in the flow rate as anticipated. In order to check the validity of the model, the model predictions are compared with the experimental results as shown in Fig.8 (a,b,c,d). The model predictions are found to agree well with the experimental observations.
Experiments were conducted in the tubular flow reactor with synthetic Acid green dye effluent for determining the extent of decolorization and COD reduction. In a typical run, the effluent of known initial concentration was mixed with appropriate amount of electrolyte NaCl and continuously pumped at constant flow rate and current density through the reactor. After steady state is reached samples were collected and analyzed for color and COD. The color was assessed by measuring sample absorbance in a UV–vis spectrophotometer (SL 159, ELICO, India), keeping the λmax value as 637 nm;
The COD was estimated by the dichromate method as per the procedure described by standard methods for examinations of water and wastewater [30].
From experimental observations the rate constant Kf1, the residence time and the Damkohler number Da1 were
determined using equation (13). The theoretical values of color and COD after treatment were calculated by equation (15). The experimental observations are compared with the theoretical predictions and the values are given in Table 2. It can be seen that the theoretically predicted color and COD removal efficiencies are in good agreement with the experimentally obtained values.
VI.
CONCLUSION
The residence time distribution of electrolyte in a tubular flow electrochemical reactor with parallel plate electrodes has been studied at different operating conditions. The electrolyte was considered to flow in the reactor passing through an active zone and a dead zone and a two parameter model accounting for the zones and exchange of flow between them has been proposed. Exact mathematical solution of the model equations are obtained using Laplace transforms. Increase in dead zone volume reduces the active reactor volume, but the simultaneous increase in the exchange flow ratio compensates for such reduction as the active volume of the reactor is increased with increase in the exchange flow ratio, thus causing negligible impact on the effective active volume. The color and COD reduction efficiencies determined for Acid green V synthetic effluent at different steady flow rates are in good agreement with the theoretical values.
VII.
ACKNOWLEDGEMENT
We thank the S.R.M University for providing the entire infrastructure to carry out the experimental work. Nomenclature
A surface area of the electrode (cm2) CAi inlet concentration
CA outlet concentration
, surface concentration of reactant and product at the electrode COD chemical oxygen demand
Da1 Damkohler number
E(t) exit age distribution (sec-1) F Faradays law constant i current density (Adm-2)
mass transfer coefficients (cmsec-1)
forward and reverse reaction rate constants (cmsec-1) n number of electrons
RTD residence time distribution mean residence time (sec) V volume of the reactor (ml) Greek letters
α fraction of active volume
β exchange flow ratio between active and dead zones Dirac delta function (sec-1)
θ dimensionless time interfacial area (cm-1) Appendix A
Material balance of the tracer in the an active zone is
Qβ = Q + Qβ + Vα (A1)
where
Material balance of the tracer in the dead zone is
Qβ = Qβ + V (1-α) (A2)
Laplace transform of equations (A1 and A2) are
Qβ = Q + Qβ + Vα (A3)
Qβ = Q + Qβ + Vα (A4)
Qβ = Qβ + V (1-α) (A5)
Qβ = Qβ + V (1-α) (A6)
Rearranging equation (A6)
[Qβ + V (1-α) ] = Qβ (A7)
(A8)
(A9)
(A10)
where = ;
Similarly equation (A4) is rearranged as follows
Qβ = [Q(1+β) + Vα ] (A11)
[Q(1+β) + Vα ] Qβ (A12)
Substituting equation (A10) in equation (A12)
= (A13)
Dividing equation (A13) by
(A14)
(A15)
(A16)
(A17)
(A18)
where = and
(A19)
Solving equation (A19) and the roots of the equation become,
(A20)
(A21)
Substituting equation (A20 ,A21) in equation (A18)
(A22)
(A23)
Taking inverse Laplace transform of equation (A23) using a Heaviside Expansion theorem as
(A24)
(A25)
(A26)
(A27)
(A28)
(A29)
(A30)
(A31)
REFERENCES
[1]. J.Paprowicz, S.Slodczyk, (1988) Application of biologically activated sorptive columns for textile wastewater
treatment Environ.Technol.Lett. 9: 271-278
[2]. G.Mckay, (1989) Color removal by adsorption Am.Dyestuff.Rep. 69: 38-45
[3]. M.Rossini, J.Garcia Garrido, M.Galluzzo, (1999) Optimisation of the coagulation flocculation treatment: Influence
of rapidmix parameters. Water Res. 33: 1817-1826
[4]. M.J.Martin, A.Artola, M.D.Balaguer, M.Rigola, (2003) Activated carbon developed from surplus sewage sludge
for the removal of dyes from dilute aqueous solutions. Chem. Engg. J. 94: 232-239
[5]. X.R.Xu, H.B.li, W.H.Wang, J.D.Gu, (2005) Decolorization of dyes and textile wastewater by potassium
permanganate, Chemosphere 59: 893-898
[6]. E.Sahinkaya, N.Uzal, U.Yetis,F.B.Dilek, (2008) Biological treatment and nanofiltration of denim textile
wastewater for reuse, J.Hazard.Mater. 153: 1142-1148
[7]. P.Canizares, F.Martinez, C.Jimenez, J.Lobato, M.A.Rodrigo, (2006) Coagulation and electrocoagulation of wastes
polluted with dyes, Environ.Sci.Technol. 40: 6418-6424
[8]. S.K.Bhargava, J.Tardio, J.Prasad, K.Folger, D.B.Akoleker, S.C.Grocott, (2006) Wet oxidation and catalytic wet
oxidation, Ind.Eng.Chem.Res. 45(4): 1221-1258
[9]. S.Dogruel, E.Dulekgurgen, D.Orhon, (2006) Effect of ozonation on chemical oxygen demandfractionation and
[10]. R.J.Bigda, (1995) Consider Fenton chemistry for wastewater treatment Chem.Eng.Prog. 91: 62-66
[11]. T.Mizuno, M.Goto, A.Kodomo, T.Hirose, (2000) Supercritical water oxidation of a model municipal solid waste,
Ind.Eng.Chem.Res. 39(8): 2807-2810
[12]. N.Mohan, N.Balasubramanian, C.Ahamed Basha, (2007) Electrochemical oxidation of textile wastewater and its
reuse, J.Hazard. Mater. 147: 644-651
[13]. K.Rajeshwar, J.G.Ibanez, (1997) Environmental biochemistry;Fundamentals and applications in pollution
abatement, Academic press, San Diego, CA
[14]. M.C.Gulteirrez, M.Crespi, (1999) A review of electrochemical treatments for color elimination
J.Soc.Dyers.Colourists 115: 342-345
[15]. J.P.Lorimer, T.J.Mason, M.Plattes, S.S.Phull, D.J.Walton, (2001) Degradation of dye effluent, Pure Appl.Chem.
73(12): 1957-1968
[16]. S.H.Lin, F.C.Peng, (1994) Treatment of textile wastewater by electrochemical methods, Water Res. 2: 277-282
[17]. K.V.Radha, V. Sridevi, K.Kalaivani, (2009) Electrochemical oxidation for the treatment of textile industry
wastewater,Bioresource technology 100: 987-990
[18]. P.Piya areetham, K. Shenchunthichai, M. Hunsom, (2006) Application of electrooxidation process for treating
concentrated wastewater from distillery industry with a voluminous electrode, Water research, 40: 2857-2864
[19]. C. Bengoa, A. Montillet, P. Legentilhomme, J. Legrand, (1997) Flow visualization and modeling of a filter press
type electrochemical reactor, Journal of Applied Electrochemistry 27 : 1313-1322
[20]. N.G. Carpenter, E.P.L. Roberts, (May 1999) Mass transport and residence time characteristics of an oscillatory
flow electrochemical reactor, Trans IChemE Vol 77, Part A.
[21]. S.P.Ferro, R.J. Principe, M.B. Goldschmit, (2001) A new approach to the analysis of vessel residence time
distribution curves, Metall. Mater. Trans. B 32B: 1185-1193
[22]. L.R.P. de Andrade Lima, D. Hodouin, (2005) Residence time distribution of an industrial mechanically agitated
cyanidation tank, Minerals Engineering 18: 613-621.
[23]. S. Lidia, R. Marta, (2006) Scale-up of an electrochemical reactor for treatment of industrial wastewater with an
electrochemically generated redox mediator, Journal of Applied Electrochemistry, 36: 1151-1156.
[24]. Jyh-Ping Hsu, Chung-Chieh Ting, Duu-Jong Lee, Shiojenn Tseng, Chur-Jen Chen, Ay Su, (2007) Residence time
distribution for electrokinetic flow through a microchannel comprising a bundle of cylinders, Journal of Colloid
and Interface Science, 307: 265-271.
[25]. Andriy Plugatyr, Igor M. Svishchev, (2008) Residence time distribution measurements and flow modeling in a
supercritical water oxidation reactor: Application of transfer function concept, Journal of Supercritical Fluids 44:
31- 39.
[26]. Fernando F. Rivera, Martin R. Cruz-Diaz, Eligio P. Rivero, Ignacio Gonzalez, (2010) Analysis and interpretation
of residence time distribution experimental curves in FM01-LC reactor using axial dispersion and plug dispersion
exchange models with closed-closed boundary conditions, Electrochimica Acta 56: 361-371.
[27]. Scott, (1991) Electrochemical Reaction Engineering, Acdemic Press, London.
[28]. Octave Levenspiel, Chemical Reaction Engineering, 3rd edition, John Wiley & Sons, New York.
[29]. Richard G. Rice, Duong D. Do, (1995) Applied Mathematics and Modeling for Chemical Engineers, John Wiley &
Sons, Inc.
[30]. Standard Methods for Examinations of Water and Wastewater, 18th ed., American Public Health Association,
American Water Works Association and Water Environment Federation.
10 20 30 40
Active volume (α) 0.79 0.69 0.59 0.58 Exchange flow (β) 0.01 0.09 0.1 0.12
Table 2. Comparison of predicted color and COD removal efficiencies with experimental observations. Current density 2.5 A/dm2; Initial effluent concentration 3000 mgl-1; NaCl concentration 10 gl-1
S.No. Q (lph) t (sec) % COD reduction % Color removal
Theoretical Experimental Theoretical Experimental
1 10 126 79.60 87.50 98.24 99.93
2 20 63 63.09 69.00 93.77 98.44
3 30 42 49.06 52.00 91.98 96.54
4 40 31.5 36.17 37.50 88.26 92.74
Captions for Figures:
Figure 1: Schematic representation of tubular electrochemical reactor with parallel electrodes
Figure 2 : Schematic representation of two-parameter model for a tubular flow electrochemical reactor.
Figure 4: The effect of exchange flow ratio on exit age distribution in a tubular flow electrochemical reactor; Q = 10 lph; α = 0.5.
Figure 5: The effect of active volume on exit age distribution in a tubular flow electrochemical reactor; Q=10 lph; β=0.5.
Figure 6: The effect of electrolyte flow rate on exit age distribution in a tubular flow electrochemical reactor.
0 100 200 300 400 500 600 0 0.002 0.004 0.006 0.008 0.01 0.012 0.014 t(sec) E (t )s ec -1
E(t) vs t for flow rate 10lph;=0.79;=0.01
Simulated Experimental
Figure 8 a): Comparison of model simulation of exit age distribution with the experimental observation for flow rate 10 lph.
0 50 100 150 200 250 300
0 0.005 0.01 0.015 0.02 0.025 0.03 0.035 0.04 0.045 t(sec) E (t )s ec -1
E(t) vs t for flow rate 20lph;=0.69;=0.09
Simulated Experimental
b): Comparison of model simulation of exit age distribution with the experimental observation for flow rate 20 lph.
0 50 100 150 200 250
0 0.02 0.04 0.06 0.08 0.1 0.12 t(sec) E (t )s e c -1
E(t) vs t for flow rate 30lph;=0.59;=0.1
Simulated Experimental
c) Comparison of model simulation of exit age distribution with the experimental observation for flow rate 30 lph.
0 50 100 150 200 250
0 0.02 0.04 0.06 0.08 0.1 0.12 0.14 t(sec) E (t )s e c -1
E(t) vs t for flow rate 40lph;=0.58;=0.12
Simulated Experimental