Original Research Article
Evaluation of Serum Interleukin 6 in Type II Diabetes Mellitus
Victoria Laishram
1*, Suman Debnath
1, Davina Hijam
2, Tina Das
1, Sneha Saha
11PGT, 2Assistant Professor, Department of Biochemistry,
Regional Institute of Medical Sciences, Imphal, Manipur, India.
ABSTRACT
Background: Interleukin-6 (IL-6) suppresses insulin-dependent insulin receptor autophosphorylation, interfering with insulin sensitivity and were found to be associated with an
elevated diabetes risk.The aim of the study was to estimate
the serum levels of IL-6 in patients with diabetes mellitus and to compare the findings with normal individuals.
Methods: Cross-sectional study. 40 cases of Diabetes Mellitus who attended Medicine OPD or admitted in the medical ward irrespective of sex, age and socioeconomic status form the study group. A group of 40 normal healthy individuals of comparable age and sex who were free of any systemic disease form the control group. Interleukin-6: IL-6 was estimated by human IL-6 ELISA kit manufactured by Krishgen Biosystems, Mumbai. IL-6 was measured by enzyme linked immunosorbent assay (ELISA) using ELISA reader as described by Helle M et al.
Results: Among DM cases males have slightly higher IL-6 level (11.15 ± 1.07 pg/ml) compared to females (9.63 ± 0.41 pg/ml). Among controls also males (7.84 ± 0.29 pg/ml) have more level compared to females (7.07 ± 0.46 pg/ml). Difference between IL-6 (mean ± SD) levels among males of both groups is statistically significant and among females of
both the groups is also statistically significant (p < 0.001). Conclusions: The results of this study confirm the association of the serum Interleukin-6 with Diabetes mellitus. Thus it can be concluded that estimation of serum IL-6 level may be used as a biomarker for diagnosis and prognosis of Diabetes Mellitus and may provide a useful tool for its management.
Keywords: Interleukin-6 (IL-6), Autophosphorylation, ELISA, Diabetes mellitus, Biomarker.
*Correspondence to:
Dr. Victoria Laishram C/O – Dr. L. Amarjit,
Sega Road Top Leirak Machin, Keishamthong, Imphal, Manipur. Article History:
Received: 17-11-2016, Revised: 28-11-2016, Accepted: 14-12-2016
Access this article online
Website:
www.ijmrp.com
Quick Response code
DOI:
10.21276/ijmrp.2017.3.1.030
INTRODUCTION
Diabetes mellitus is a group of metabolic diseases characterized by hyperglycemia resulting from defects in insulin secretion,
insulin action or both.1 Several pathological processes are
involved in the development of diabetes like autoimmune destruction of the β-cells of the pancrease with consequent insulin deficiency to abnormalities that result in resistance to insulin action. Prolonged low-grade inflammation may ultimately lead to the clinical expression of Type II Diabetes. Such a systemic and subclinical inflammatory process can be characterized by elevated circulating levels of inflammatory cytokines including C-reactive protein (CRP) or high-sensitivity CRP (hs-CRP), interleukin-6 (IL-6), and tumor necrosis factor-alpha (TNF-alpha). These cytokines have been shown to promote hepatic fatty acid synthesis and induce the liver to produce more acute-phase proteins, as well as recruit more inflammatory cells to adipose tissue and pancreatic
beta-cells.2 IL-6 suppresses insulin-dependent insulin receptor
autophosphorylation (interfering with insulin sensitivity). IL-6 is systemic inflammatory protein and enhances hepatic glucose
production3, stimulates LDL production and triglycerides in liver,
and insulin resistance in muscle.4 IL-6 induces IL-1β production
which impairs insulin signaling and action in vitro.5 In adipose
tissue, IL-6 appears to suppress the expression of the insulin
sensitising cytokine adiponectin6 and in epidemiological studies
high levels of IL-6 were found to be associated with an elevated
diabetes risk.7
AIMS AND OBJECTIVES
The aims and objectives of the study are to estimate the serum levels of interleukin-6 in patients with diabetes mellitus and in normal healthy individuals. Compare the results among them and find relationship if any.
MATERIALS AND METHODS
Study Setting: Department of Biochemistry in collaboration with the department of Medicine, Regional Institute of Medical Sciences, Imphal, Manipur, India.
Study Design: Cross-sectional study.
Study Population: 40 cases of Diabetes Mellitus who attended Medicine OPD or admitted in the medical ward irrespective of sex, age and socioeconomic status form the study group. A group of 40 normal healthy individuals of comparable age and sex who were free of any systemic disease form the control group.
Exclusion Criteria
Carcinoma and chronic diseases.
Macro vascular complications such as cardiovascular,
cerebrovascular and peripheral vascular diseases.
Febrile illness, sepsis, burn, renal disease and hepatic
failure.
METHODS
Baseline examination and measurement
History taking was followed by a general physical and systemic examination. Screening of patients and subjects for the conditions of exclusion were done. Standardized protocols were used to measure body weight, height, waist and hip circumference with appropriate validation and quality control procedures. Body mass index (BMI) was calculated as weight (kg) divided by the square of
the height (m2).
Blood pressure was measured using a standard mercury sphygmomanometer and the average of two measurements taken at intervals longer than 2 minutes after the participants had been sitting for at least 30 minutes according to the American Heart Association guidelines.
Collection of sample
5 ml of venous blood was collected by venipuncture from antecubital vein after an overnight fast. 1 ml of blood was collected in fluoride vial for the estimation of blood glucose and about 4 ml was collected in plain vial for estimation of serum IL-6 and serum lipid level. The blood collected in the plain vial was centrifuged for 10 minutes within 30 minutes of collection and the serum for IL-6 estimation was stored immediately at < -20 °C. All the lipid tests were carried out on the same day. Blood glucose estimation was done on the plasma separated from fluoride vial on the same day.
Analytical methods
Total cholesterol was measured by CHOD PAP method. Serum triglyceride was measured by GPO-PAP method with colorimetric determinations. HDL cholesterol by precipitation technique using HUMAN cholesterol liquicolor test kit. LDL cholesterol and VLDL cholesterol values in mg/dl were indirectly calculated by using the
following formulae of Friedewald WT et al.8 Blood glucose was
measured by Glucose liquicolor kit manufactured by HUMAN, Germany using Glucose oxidase (GOD/PAP) method.
Interleukin-6
IL-6 was estimated by human IL-6 ELISA kit manufactured by Krishgen Biosystems, Mumbai. IL-6 was measured by enzyme linked immunosorbent assay (ELISA) using ELISA reader as
described by Helle M et al.9
Statistical analysis
Statistical analysis was done using SPSS version-20 software. Results were reported as mean + SD (standard deviation) for quantitative variables and number of cases along with percentages for the categorical/quantitative variables. Chi-square test, independent sample T test were applied whenever necessary. All comparisons were two-sided and the P- values of < 0.05 and < 0.01 were used as the cut-off values for significance and highly significance respectively.
RESULTS AND OBSERVATIONS
Table 1 shows that mean age + SD of control and Diabetes mellitus cases are 57.50 + 12.32 and 60.35 + 6.48 respectively which is statistically insignificant. Number of males is 22(55%) and 24(60%) in controls and DM cases which is more than number of females 18(45%) and 16(40%) in controls and DM cases. The mean + SD of duration of DM in years is found to be 10.35 + 1.26. The weight in kg in control and DM cases are found to be 51.86 + 5.98 and 53.76 + 4.94 respectively which is statistically significant.
The BMI in kg/m2 in control and DM cases are found to be 22.64 +
0.57 and 24.39 + 0.39 respectively which is statistically significant. Percentage of family h/o diabetes in first degree relative in control and DM cases are found to be 21 and 45.7% respectively which is statistically significant.
Table 1: Baseline characteristics of diabetic patients and healthy controls
Characteristics Control
(n = 40) (mean + SD)
Diabetes (n = 40) (mean + SD)
P value
Age (in years) Sex
Male Female
Duration of DM, years Weight in kg
BMI kg/m2
Family h/o diabetes in 1° relative (%)
57.50 + 12.32
22(55%) 18(45%)
- 51.86 + 5.98 22.64 + 0.57
21
60.35 + 6.48
24(60%) 16(40%) 10.35 + 1.26 53.76 + 4.94 24.39 + 0.39
45.7
0.19
0.65
< 0.001 < 0.001 < 0.001
Table 2: Blood pressure (systolic and diastolic) in control & Diabetes Mellitus cases
Parameter Control
(n=40)
Diabetes (n=40)
P-value
Mean + SD Mean + SD
Systolic BP (mm Hg) 124.49 + 2.94 125.12 + 2.59 0.31
Table 3: BMI & lipid profile in control & Diabetes Mellitus cases
Parameter Control
(n=40)
Diabetes (n=40)
P-value
Mean + SD Mean + SD
BMI 22.64 + 0.57 24.39 + 0.39 <0.001
Total Cholesterol 182.35 + 16.76 290.20 + 29.48 <0.001
TG (mg/dl) 110.30 + 24.92 150.85 + 13.92 <0.001
HDL (mg/dl) 63.60 + 19.82 35.02 + 11.85 <0.001
LDL (mg/dl) 130.95 + 16.97 156.70 + 12.64 <0.001
Table 4: Summary of Biochemical data in Controls and DM Cases
Parameter Controls
(Mean ± SD)
Diabetes Cases (Mean ± SD)
P value
Fasting Blood Sugar (mg/dl) 88.06 + 4.04 134.32 + 8.04 <0.001
Postprandial Blood Sugar( mg/dl) 126.98 + 2.68 212.22 + 8.614 <0.001
Hb A1c (%) 4.57 + 0.31 9.51 + 0.24 <0.001
IL-6 (pg/ml) 7.41 + 0.54 10.66 + 1.16 <0.001
There was no significant difference in the systolic BP in the diabetic group when compared to control group with 125.12 + 2.59 and 124.49 + 2.94 in diabetic and control group respectively. The difference observed in diastolic BP was also not significant between control and diabetic group with 74.72 + 2.41 and 74.85 + 2.48.12 in control and diabetic group respectively. (Table 2)
Table 3 shows that the BMI in kg/m2 in control and DM cases are
found to be 22.64 + 0.57 and 24.39 + 0.39 respectively which is statistically significant. There is a statistically significant increase in serum cholesterol, triglycerides and LDL levels in study group compared to control group. There is a statistically significant decrease in serum HDL level in the study group compared to control group.
Table 4 shows FBS level in diabetes was 134.32 + 8.04 when compared to 88.06 + 4.04 in control. This difference is statistically significant (p<0.001). The PPBS level in diabetic
group is significantly high when compared to control with 212.22 + 8.614 and 126.98 + 2.68 in diabetic and control group respectively. There is a significant difference of blood glucose control as indicated by mean HbA1c among the control and diabetic cases (cases-9.51 + 0.24, controls- 4.57 + 0.31). Serum IL-6 level (cases- 10.66 + 1.16, controls- 7.41 + 0.54) are higher among cases than controls. This difference is found to be statistically significant (p < 0.001).
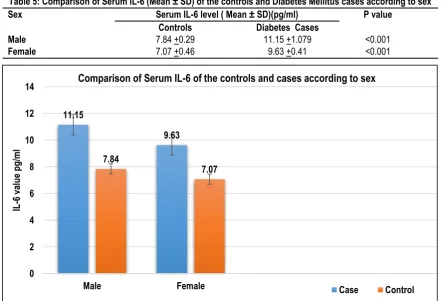
Table 5 shows distribution of Serum IL-6 among DM cases and controls according to their sex. Among DM cases males have slightly higher IL-6 level (11.15 ± 1.07 pg/ml) compared to females (9.63 ± 0.41 pg/ml). Among controls also males (7.84 ± 0.29 pg/ml) have more level compared to females (7.07 ± 0.46 pg/ml). Difference between IL-6 (mean ± SD) levels among males of both groups is statistically significant and among females of both the groups is also statistically significant (p < 0.001).
Table 5: Comparison of Serum IL-6 (Mean ± SD) of the controls and Diabetes Mellitus cases according to sex
Sex Serum IL-6 level ( Mean ± SD)(pg/ml) P value
Controls Diabetes Cases
Male Female
7.84 +0.29 7.07 +0.46
11.15 +1.079 9.63 +0.41
<0.001 <0.001
11.15
9.63
7.84
7.07
0 2 4 6 8 10 12 14
Male Female
IL
-6
va
lu
e p
g/m
l
Comparison of Serum IL-6 of the controls and cases according to sex
DISCUSSION
In the present study, The BMI in kg/m2 in control and DM cases are found to be 22.64 + 0.57 and 24.39 + 0.39 respectively which is statistically significant. This finding is similar with that of Aruna
DP et al.10 Percentage of family h/o diabetes in first degree
relative in control and DM cases are found to be 21 and 45.7% respectively which is statistically significant. This finding is similar
with that of Frank BH et al.11 It is observed that mean age (± SD)
for DM cases is 60.35 ± 6.48 years. Mean age (± SD) for males among Cases is 61.55 ± 0.70 years while among females it is 59.36 ± 8.68 years. Mean age (± SD) for controls is 57.50 ± 12.32. Mean age for males among controls is 58.40 ± 15.46 while for females it is 54.88 ± 3.23. The disease was more prevalent in the middle aged population as the risk of developing Type 2 Diabetes increases with age. This finding is similar with the report
of Schulze MB et al.12
This study reported that, there was no significant difference in the systolic BP in the diabetic group when compared to control group with 125.12 + 2.59 and 124.49 + 2.94 in diabetic and control group respectively. The difference observed in diastolic BP was also not significant between control and diabetic group with 74.72 + 2.41 and 74.85 + 2.48 in control and diabetic group respectively. The
BMI in kg/m2 in control and DM cases are found to be 22.64 +
0.57 and 24.39 + 0.39 respectively which is statistically significant. There is a statistically significant increase in serum cholesterol, triglycerides and LDL levels in study group compared to control
group. This is similar to the observations made by Benner A et al13
and Mohan AF et al14 who had found significant increase in the
mean level of serum triglyceride in diabetic subjects when compared to the control groups. There is a statistically significant decrease in serum HDL level in the study group compared to control group. Table–XI shows FBS level in diabetes was 134.32 + 8.04 when compared to 88.06 + 4.04 in control. This difference is statistically significant (p<0.001) consistent with the reports
given by Verma M et al15 and Akinloye OA et al.16 The PPBS level
in diabetic group is significantly high when compared to control with 212.22 + 8.614 and 126.98 + 2.68 in diabetic and control group respectively. This finding is consistent with the findings of
Fahmy E et al.17 There is a significant difference of blood glucose
control as indicated by mean HbA1c among the control and diabetic cases (cases- 9.51 + 0.24, controls- 4.57 + 0.31). HbA1c was increased in diabetic compared to control, which is a sign of
poor glycemic status as described by Selvin E et al18. Gabbay KH
et al19 also found that in diabetic patients, concentration of HbA1c
is elevated as much as two fold and decreases with improvement of glycaemic control.
Serum IL-6 level (cases- 10.66 + 1.16, controls- 7.41 + 0.54) are higher among cases than controls. This difference is found to be statistically significant (p < 0.001). This finding is consistent with
the findings of Shaymaa ZN et al20 Among DM cases males have
slightly higher IL-6 level (11.15 ± 1.07 pg/ml) compared to females (9.63 ± 0.41 pg/ml). Among controls also males (7.84 ± 0.29 pg/ml) have more level compared to females (7.07 ± 0.46 pg/ml). Difference between IL-6 (mean ± SD) levels among males of both groups is statistically significant and among females of both the groups is also statistically significant (p < 0.001).
Over the past decades many studies have suggested that low grade inflammation might be the key regulator in the pathogenesis
of Type 2 DM.21 IL-6 is released from macrophages of adipose
tissue as well as from adipocytes and skeletal muscle.21 In vitro
and in vivo work has shown that IL-6 gene expression and circulating levels of IL-6 may be regulated by insulin. Pro-inflammatory cytokines like IL-6 appear in early stage of Type 2 DM and they are found to be capable to increase insulin resistance directly in adipocytes, muscle and hepatic cells leading
to augmentation of the systemic insulin resistance.22
CONCLUSION
The study suggests that low grade inflammation might be the key regulator in the pathogenesis of Type 2 DM. Pro-inflammatory cytokines like IL-6 appear in early stage of Type 2 DM and they are found to be capable to increase insulin resistance directly in adipocytes, muscle and hepatic cells leading to augmentation of the systemic insulin resistance. The results of this study confirm the association of the serum Interleukin-6 with Diabetes mellitus. Thus it can be concluded that estimation of serum IL-6 level may be used as a biomarker for diagnosis and prognosis of Diabetes Mellitus and may provide a useful tool for its management. Targeting insulin resistance and low grade inflammation particularly IL-6, early detection and prevention of Type II Diabetes mellitus can be done. This will reduce the risk not only for Type II Diabetes mellitus but also to its complications and comorbidities.
Despite its relatively small sample size, the present study provides evidence of the usefulness of estimation of serum IL-6 as a convenient and sensitive biomarker for the prediction of diabetes. Prospective and population based studies on a large-scale are however required to confirm the association.
ETHICAL ISSUES
Approval was sought from Institutional ethical subcommittee
RIMS, Imphal.
Consent taken before taking blood samples.
Confidentiality maintained.
REFERENCES
1. The expert committee on the diagnosis and classification of diabetes mellitus: follow up report on the diagnosis of diabetes mellitus. Diabetes Care 2003 Nov;26(11):3160-7.
2. Butler AE, Janson J, Bonner S. Beta-cell deficit and increased beta-cell apoptosis in humans with type 2 diabetes. Diabetes 2003;52:102–10.
3. Penno G, Miccoli R, Pucci L, Del PS. The metabolic syndrome beyond the insulin resistance syndrome. Pharmacol Res 2006;53:457-68.
4. Bastard JP, Maachi M, Lagathu C. Recent advances in the relationship between obesity, inflammation and insulin resistance. Eur Cytokine Netw 2006;17:4-12.
5. Jager J, Gremeaux T, Cormont M, Marchand Y, Tanti JF. Interleukin-1 beta-induced insulin resistance in adipocytes through down-regulation of insulin receptor substrate-1 expression. Endocrinology 2007;148:241-51.
6. Fasshauer M, Kralisch S, Klier M, Lossner U, Bluher M, Klein J et al. Adiponectin gene expression and secretion is inhibited by interleukin-6 in 3T3-L1 adipocytes. Biochem Biophys Res Commun 2003;301(4):1045-50.
type 2 diabetes: results of the prospective population-based European prospective investigation into cancer and nutrition (EPIC)-potsdam study. Diabetes 2003;52(3):812-7.
8. Friedewald WT, Levy RI, Fredrickson DS. Estimation of the concentration of low-density cholesterol in plasma, without use of the preparative ultracentrifuge. Clin Chem 1972;18(6):499-502. 9. Helle M, Boeije L, Groot E, Vos A, Aarden L. Sensitive ELISA for IL 6: detection of IL-6 in biological fluids: synovial fluid and sera. J Immunol Methods 1991;138(1):47-56.
10. Pradhan AD, Manson JE, Rifai N, Buring JE, Ridker PM. C-reactive protein, interleukin 6 and risk of developing type 2 diabetes mellitus. JAMA 2001; 286(3):327-34.
11. Frank BH, James BM, Tricia YL, Nader R, JoAnn EM. Inflammatory markers and risk of developing type 2 diabetes mellitus. Diabetes 2004;53:693-700.
12. Schulze MB, Heidemann C, Schienkiewitz A. Comparison of anthropometric characteristics in predicting the incidence of type 2 diabetes in EPIC- potsdam study. Diabetes Care 2006;29:1921-3. 13. Bener A, Zirie M, Daghash MH, AI Hamaq A, Daradkeh G, Rikabi A. Lipids, lipoprotein (a) profile and Hb A1C among Arabian type 2 diabetic patients. Biomed Research 2000;18(2):97-102. 14. Mohsen AF, Hazmi E, AI-Swailem AR, Warsy AS, AI-Mashari AA, Sulaimani R, et al. Lipids and related parameters in Saudi type 2 diabetes mellitus patients. Ann SaudiMed1999;19(4):304-7. 15. Verma M, Paneri S, Badi P, Raman PG. Effect of increasing duration of diabetes mellitumoglobin and insulin sensitivity. Ind J Clin Bioch 2006;21(1):142-6.
16. Akinloye OA, Adaramoye OA, Akinlade KS, Odetola AA, Raji AA. Relational between fasting plasma glucose and glycated haemoglobin and glycated haemoglobin in adult diabetic Nigerians. AfricanJournalofBiomedicalResearch2007;10:127-32. 17. Fahny E, Amer H, Rabah AM, Fayoumy NE, Mokhtar H. Estimation of serum homocysteine level in patients with type 2 diabetic neuropathy. Egypt J Neurol Psychiat Neurosurg 2010;47(1):59-66.
18. Selvin E, Wattanakit K, Steffens MW, Coresh J, Sharret R. Hb A1c and peripheral arterial disease in diabetes: the atherosclerosis risk in communities study. Diabetes Care 2006;29:877-82.
19. Gabbay KH, Hasty K, Breslow JL. Glycosylated hemoglobins and long term blood glucose control in diabetes mellitus. J Clin Endocrinol Metab 1997;44:859-64.
20. Shayma ZN, Firyal H, Abdul J. Serum level of IL-6 and homocysteine in type 2 diabetes mellitus with renal failure complication. Karbala J Med 2010;3(1):804-11.
21. Kern PA, Ranganathan S, Li C, Wood L, Ranganathan G. Adipose tissue TNF and IL-6 expression in human obesity and insulin resistance. AmJPhysiolEndocrinolMetab 2001;280:745-51. 22. Popko E, Gorsko A, Stelmaszczyk A, Plywaczewski R, Stoklosa A, Gorecka D. Proinflammatory cytokines IL-6 and TNF-α and the development of inflammation in obese subjects. Eur J Med Res 2010;15:120-2.
[
Source of Support: Nil.
Conflict of Interest: None Declared.
Copyright: © the author(s) and publisher. IJMRP is an official publication of Ibn Sina Academy of Medieval Medicine & Sciences, registered in 2001 under Indian Trusts Act, 1882. This is an open access article distributed under the terms of the Creative Commons Attribution Non-commercial License, which permits unrestricted non-commercial use, distribution, and reproduction in any medium, provided the original work is properly cited.