ISSN (Online): 2320-9364, ISSN (Print): 2320-9356
www.ijres.org Volume 4 Issue 7 ǁ July. 2016 ǁ PP. 38-43
www.ijres.org 38 | Page
Color Image Segmentation for Extract Multi- Object
Rusul Fadhil Yaser
1,Abdul-Wahab Sami Ibrahi
2College of Education in Computer Since, AL Mustansiriyah University, Baghdad, Iraq. College of Education in Computer since, AL Mustansiriyah University, Baghdad, Iraq.
Abstract:
In this paper proposed a method for multi-object extraction from color image for the security purpose, aproposed method using one of a traditional algorithms is a basic two-stage extraction process .The first stage depends on the method of segmentation clustering the image using FCM algorithmfuzzy logic as well as the traditional algorithms such as K-mean and thresholding. In this stage, the complex background problem of the scene is treated byremoving parts of the image boundaries in cropping processand then convert the result image to gray image and then to binary image, then implement median filter and compute the object area, to obtain object of interest. The proposed system has three methods to implements the segmentation step, for each one of them it has execution time, MSE, RMSE, PSNR, Hit Rate and Miss Rate, as a comparing among these methodsto find which one is the best.I.
INTRODUCTION
Object extraction is one of image processing fields; there are many applications of objects extraction such as building, humane, tree, etc. [1]. In this approach, the categories of objects to be detected and extracted from color images in the real world will be focused on the person and cars, these categories are more dangerous in the life. The detection of people and cars is important for interpreting the scene in case of dangerous situations. Object extraction is a special case of image segmentation when just theparticular regions of an image that be of interest: the segmentation process seeks to separate the pixels that only belong to foreground (objects of interest), and all the other pixels are considered the background ‘non-object’.It can be achieved either by the thresholding gray level image or by classification of the pixels[2], [3]. Since each object, extract contains several different areas and different colors and lighting of these factors may cause a problem of over-segmentation [4] .So in this approach these factors ignored and rely mainly on the size of the object and the number of pixels constituent by calculating the area of the object and connectivity of 4-neighbors and 8-neighbors.
II.
CLUSTERING
Clustering is a grouping process for patterns or set of objects to similar data around each cluster center,
the objects within a one cluster have higher similarity than when are much dissimilar for objects in other cluster[5]. There are two strategies of clustering: the hard clustering and the fuzzy clustering,every one of them has particular characteristics [6].
Hard clustering methods depend on the traditional theory set that each element belongs exactly to one cluster ,which means that the element either belongs or not to the cluster exclusively [1or 0] .While fuzzy clustering allows the element to belong to more than one cluster with membership value between [0,1] [7]. Studies have shown that clustering techniques are capable of image segmentation and determining certain region of interest.
III.
FUZZY C-MEANS CLUSTERING
The FCM pose the most common algorithm in fuzzy clustering field. FCM algorithm is an unsupervised partitional learning technique that can be used to detect the underlying structure of the data based on a similarity measure.FCM was derived from the hard (or crisp) C-means algorithm (HCM), but the functional fuzzy clustering is natural than hard clustering. This algorithm is introduced by Dunn in 1973, then modified or extended by Bezedk in 1981.It is also widely used in pattern recognition and successfully in feature analysis, and in fields like astronomy, target recognition, image segmentation, medical imaging and geology [8], [9].
Where K is the counter of iteration dij= Euclidian distance
U= matrix of fuzzy partition Advantages
1) Grant better result to overlapped data set than the k-means algorithm.
2) Assign membership for the datapoint to every cluster center, the data point that may belong to extra cluster center.
3) Unsupervised.
IV.
K-MEAN ALGORITHM
This algorithm developed by J.Mac Queen in 1967. The idea of this algorithm is define K centroids, for each cluster has one centroid and aims to minimize the objective function.This algorithm has a simple and easy method to classify the dataset with the certain number of a prior fixed of k clusters, but there is no guarantee when the k-mean give the best result for clustering if the initial centroids are chosen randomly, however, the chosen of the correct initial centroids is the challenging specially in the natural images the select centroids is difficult [5], [10]. The following pseudo-code represents general k-means clustering algorithm:
STEP1: Determine the number of cluster. STEP2: Create the center of cluster.
STEP3: Determine the membership of data points via Euclidean distance. STEP4: Assign the data points of objects to the nearest cluster.
STEP5: Reinitiate cluster center.
STEP6: Repeat the steps 3, 4, 5 until there is no change in membership of objects.
V.
THRESHOLDING
Thresholding is the important approaches of image segmentation. Thresholding creates binary images from grey-level ones by turning all pixels below some threshold to zero and all pixels about that threshold to one. Thresholding is used to extract an object from its background by assigning an intensity value T (threshold) for each pixelsuch that each pixel is either classified as an object point or a background point.
To extract the objects from image background is to select a threshold T that isolate these mode, each point (x, y) for f(x, y)>T called an object point; otherwise the point is called background point [11].
www.ijres.org 40 | Page
𝑔 𝑥, 𝑦 = 1, 𝑖𝑓 𝑓 𝑥, 𝑦 > 𝑇0, 𝑖𝑓𝑓 𝑥, 𝑦 < 𝑇
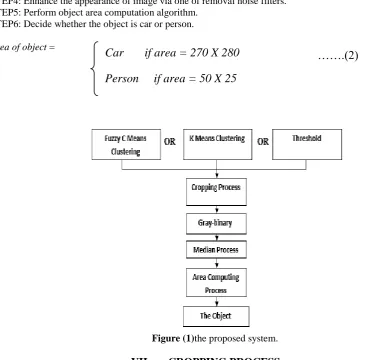
VI. THE PROPOSED SYSTEM
The proposed system has three techniques, which performed as the following pseudo-code: STEP1: Apply Fuzzy C Means clustering, K Means clustering, or Threshold Technique.
STEP2: Perform cropping algorithm for partitioning the resulted image. STEP3: Convert the image to Gray then to Binary image.
STEP4: Enhance the appearance of image via one of removal noise filters. STEP5: Perform object area computation algorithm.
STEP6: Decide whether the object is car or person.
Area of object =
Figure (1)the proposed system.
VII.
CROPPING PROCESS
This process is responsible for cropping the image for all directions. The cropping process is performed depending on user entering which acts the number of pixels to be cropped in all directions. The cropping process has a useful feature, which is excluding uninterested information from the image.
Figure (2) Cropping Process.
Car if area = 270 X 280
Person if area = 50 X 25
…….(1)
www.ijres.org 41 | Page
VIII.
GRAY-BINARY ALGORITHM
The object extraction requires preprocessing step, at first, the captured image is loaded then converting it into gray image and then to binary image in order to obtain the object of interest in the image and minimizing execution time.
Figure (3) shows gray-binary process
IX.
OBJECT AREA COMPUTING
An area computation process implements in the system in order to compute extracted objects within the image, it depends on pixel number to determine the object size. The algorithm operates on binary image at which the objects have white (pixel value = 255) color and the background have black (pixel value = 0) color. Then it calculates the number of continued white pixels as independent object.
X.
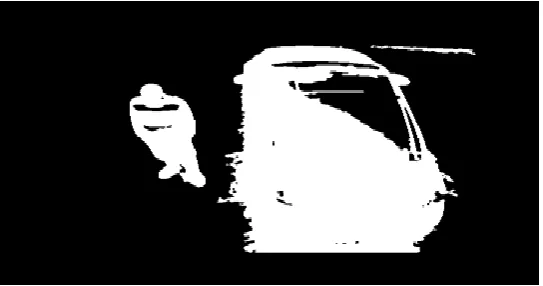
MEDIAN FILTER RESULT
This filter is non-linear when this filter activates the algorithm checking the data of image and replace them; it is operating in order to remove increasing noises or rejecting them. Through applying this, filter their result shows maintaining sharp edges.
Figure (4) Activation of Median Filter.
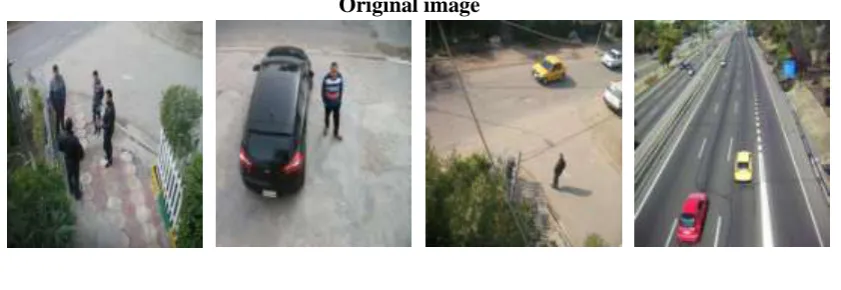
In this search used the real images in the outdoor to extract the object from these images. The dataset is taken from building and these images are divided in four groups (A, B, C, D) each group has base image own to it and has (20) image. A and B are the same high (4 meter ), but different in the object faraway when the object in group A is faraway (4-12 ) meter and group B is faraway (2-6 )the group C is deferent in high(7metre) and object faraway (4-15) the group D is the image that taken from internet from the website.
There are many criteria can be used in order to measure the detecting process during run time. These criteria facilitate the evaluation of processing for deciding whether technique has achieved better results to be depended in the work; there are MSE, PSNR, RMSE, Hit Rate, Miss Rate and Execution time.
Hite Rate = 𝑛𝑜 .𝑜𝑓 𝑐𝑜𝑟𝑟𝑒𝑐𝑡 𝑜𝑏𝑗𝑒𝑐𝑡
𝑡𝑜𝑡𝑎𝑙 𝑛𝑜 .𝑜𝑓 𝑜𝑏𝑗𝑒𝑐𝑡 𝑖𝑛 𝑡𝑒 𝑖𝑚𝑎𝑔𝑒 x 100
Miss Rate = 𝑛𝑜 .𝑜𝑓 𝑚𝑖𝑠𝑠 𝑜𝑏𝑗𝑒𝑐𝑡
𝑡𝑜𝑡𝑎𝑙 𝑛𝑜 .𝑜𝑓 𝑜𝑏𝑗𝑒𝑐𝑡 x 100
……(4)
www.ijres.org 42 | Page
The average of the (Hit Rate, Miss Rate) Measurements for all images to methods after implementation are illustrate in table (1):Table (1) The Measurement (Hit Rate, Miss Rate) for all Techniques.
Note that FCM technique has higher Hit Rate then K-Mean comes next then and Threshold technique. The objective fidelity criteria measurements (PSNR (peak signal to noise ratio), MSE (mean square error) and runtime is show in table (1) :
The average of the (Time, MSE, RMSE, and PSNR) Measurements for all images to methods after implementation are illustrate in table (2):
Table (2): The Average of (Time, MSE, RMSE, and PSNR) Measurements for all Techniques:
We note that Threshold technique has less execution time rate,but higherMSE rate than the other techniques. FCM technique has higherexecution time, but has less MSE rate than the other techniques, so each technique has many of limitations.
XI.
CONCLUSIONS AND FUTURE WORK
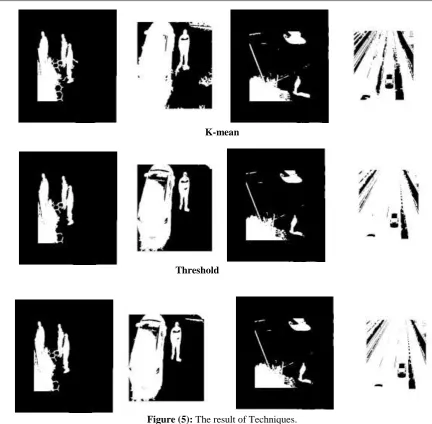
In this paper, we have presented method for multi object extraction from color image for our future ongoing research; we intend to extend the proposed algorithm for automatic.A proposed method using one of traditional algorithms is a basic two-stage extraction process .The first stage depends on the method of segmentationclustering theimage using FCM algorithmfuzzy logic as well as the traditional algorithms such as K-mean and Thresholding.In the result FCM, clustering is more sensitive to variance of colors than K-mean clustering and Thresholding, so it appears more details than the others, the complex background problem of the scene is treated byremoving parts of the image boundaries in cropping process. The objects will be extracted without dependence on any prior information such as features or any information indicating the existence of an interest object; it is depend on the size of object area. In the future theshadow removing by one of shadow removal algorithm, applying the proposed system on the video sequences.
K-mean
Threshold
Figure (5): The result of Techniques.
REFERENCES
[1]. Wenzhong Shi et al.,A Fuzzy-Topology-Based Area Object Extraction Method, IEEE TRANSACTIONS ONGEOSCIENCE AND REMOTE SENSING, VOL. 48, NO. 1, JANUARY 2010. [2]. Prof. Dr.Hilal M. Yousif, Using Image Mining to Discover Association Rules between Image
Objects,AI.Rafidian University college.
[3]. Ashish Ghosh and Sankar K. Pal,Neural network, self-organization and object extraction,Electronics and Communication Sciences,India, 1992.
[4]. Toru Tamaki,et.at.Image segmentation and object extraction based on geometric feature s of regions, ,1999.
[5]. EbrahimAghajari& D. C. Gharpure, Segmentation Evaluation of Salient Object Extraction Using K-Means and Fuzzy C-K-Means Clustering, Department of Electronic Science, University of Pune, Pune, India , IJAEEE. 2012.
[6]. Singh, K. C.,Satapathy, L. M.; Dash, B. and Routray, S. K., Comparative Study on Thresholding, International Journal of Instrumentation Control & Automation (IJICA), Vol. 1(1), 2011.
[7]. BalazsBalasko,JanosAbonyi and BalazsFeil,Fuzzy Clustering and Data Analysis Toolbox ,DepartmentofProcessEngineering University ofVeszprem,2002.
[8]. R.Suganya, R.Shanthi, Fuzzy C- Means Algorithm- A Review , International Journal of Scientific and Research Publications, Volume 2, Issue 11, November 2012 1 ISSN 2250-3153.
[9]. http://home.deib.polimi.it/matteucc/clustering/tutorial_html/htm
[10]. SharifahLailee Syed Abdullah1 et al. Adaptive K-means Method For Segmenting Image Under Natural Environment , UniversitiTeknologi MARA, Malaysia,2013.