Human liver Cancer Segmentation and analysis
using Human Machine Interaction Method
Antony Asir Daniel V. Jenifer S.
Assistant Professor Department of Electronics & Communication Engineering Department of Electronics & Communication Engineering Francis Xavier College of Engineering, Tirunelveli, India
Francis Xavier College of Engineering, Tirunelveli, India
Abbiramy S. S. Arockia Angel S.
Department of Electronics & Communication Engineering Department of Electronics & Communication Engineering Francis Xavier College of Engineering, Tirunelveli, India Francis Xavier College of Engineering, Tirunelveli, India
Abstract
There are different kind of options for liver cancer treatment. This analysis focuses one amoung the formost necessary fields of image processing and image segmentation. The treatment choices involve surgery, interventional therapy, radiation, and therefore the combination of those techniques. All of them may be expedited with package tools that create the liver analysis additional precise and fewer enthusiastic about the operator. In this research focus on the special attention to increase the efficiency of the projected algorithms in additionally to their accuracy. According to clinical outcomes a software package workflow is beneficial once the computation time between beginning a perform and visualizing its result doesn't exceed half minute. The algorithms bestowed during this research were designed to resolve advanced clinical issues with efficiency. The author developed an innovative human machine interface technique for machine driven liver lesion detection in particular contrast-enhanced CT images. The proposed interface algorithm is relies on the segmentation of abnormal regions within the liver and therefore the classification of those regions supported a unique multi-level form characterization. The false positives concerned multiple detections of some lesion and tiny lesions or calcifications that weren't concerned within the reference additionally to different false findings. The average period of time of the strategy was 30s per case that demonstrates the potency of the strategy.
Keywords: Image Processing, Human Machine Interation, Automated Segmentation, Liver Analysis, Morpological Analysis
_______________________________________________________________________________________________________
I. INTRODUCTION
II. CORRECTION OF UNDER & OVER LIVER SEGMENTATION
Segmentation is the process of partitioning an image into multiple set of voxels which represent some meaningful parts of the image. In medical image processing the segmentation includes contouring organs within a body region as well as separating an organ into its internal structures such as parenchyma, vessels, or pathology. By means of segmentation medical image analysis can be specialized to organs, the size or the volume of anatomical structures can be measured precisely, and the level of abnormality can be quantified objectively. These functions are vital when the progression or the regression of a disease shall be determined.
Liver Segmentation & Localisation
The basis of all computer assisted liver analysis is the liver segmentation. Since the manual segmentation of the organ is very time consuming, it is important to solve this problem in more efficient way. This section presents three techniques for automated liver segmentation which represent the different phases of a research work. Before going in the details of the algorithms it is demonstrated how the performance of a segmentation method can be assessed. The next part of the introduction presents the error measures which are used in this thesis to assess segmentation accuracy. For example, in surgery planning the precise quantification of the (resected and remaining) liver volume is very important, so even the very time consuming (10–15 minute long) semi-automated contouring is worth doing in the daily practice. However, in case of lesion assessment, liver segmentation could facilitate the detection of tumours (e.g. by automated enhancement of abnormal regions inside the liver), but no user would make efforts to segment the liver instead of adjusting the visualization parameters manually. Since users shall process several cases per hour, the majority of them would skip the liver segmentation if took significantly longer than half minute. The fully manual (slice by slice) liver segmentation can take 45–150 minutes per case, which means it is rarely performed in the daily clinical practice.
Table – 1
The Evaluation of a Non-Expert Manual Liver Contouring using Ground-Truth Segmentation
Exam Time (s) VOE (%) Exam Time (s) VOE (%) 01 6.00 10.2 11 8.00 5.6 02 3.50 7.3 12 6.00 5.9 03 4.50 6.4 13 4.50 6.9 04 4.50 7 14 3.00 5.2 05 5.50 5.2 15 6.00 5 06 5.50 5.3 16 9.00 4.9 07 10.00 6.1 17 2.50 5.3 08 11.00 8.1 18 7.00 5.9 09 4.50 5 19 7.00 5.5 10 6.00 7.9 20 1.50 6.7
The results of the evaluation are presented in Table 1. The average contouring time was 5.8 minutes (min = 1.5, max = 11, stdev = 2.4), and the average was 6.3% (min = 4.9%, max = 10.2%, stdev = 1.3%). The trade-off between accuracy and time can be defined as the ratio of and the duration (i.e. the volumetric overlap that can be achieved in 1 minute). The average of this trade-off was 16.2, which can be roughly interpreted such a way that a non-expert operator can achieve an average 16.2% volumetric overlap with 1 minute of contouring. Assuming linear increase in this trade off a equal to 20%, 15%, 10%, 5% could be achieved in 4.9, 5.2, 5.6, and 5.9 minutes, respectively. Based on the result of this experiment one can conclude that a non-expert operator can provide a reasonably accurate manual segmentation () in 5.6 minutes.
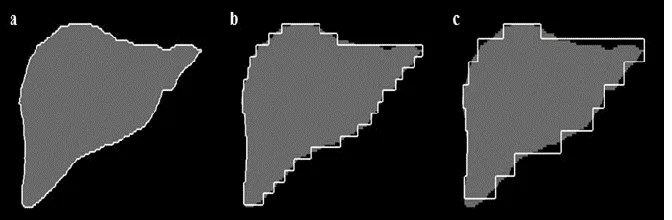
Fig. 1: Simulation of Manual Contouring with Various Slice Thickness: Reference Contour (A) & Simulated Contour with Larger Slice Thickness (B, C).
more) sensitive to the distance between interpolated slices. As low as 10 mm distance between interpolated slices can imply that is greater than 1 mm. In order to achieve this accuracy 8.75 (=175/10•0.5) minutes are needed to contour the liver, in such case = 12.9 mm.
Fig. 2: Segmentation using neighbour-connected region-growing: initial region (a), result of the segmentation (b) and the subsequent dilation (c).
If very accurate (< 5 mm) segmentation is required, one shall use less than 2 mm slice distance, which would take 43.75 minutes per case. Another drawback of using large environment is that the method stops before reaching the boundary of the liver (Fig. 2/b). This can be corrected by applying an additional dilation to the result of the region-growing (Fig. 2/c). The kernel of the dilation has the same radius as the local environment. This problem is reduced using standard 3D cavity filling method. In this step of the algorithm, each 3D-connected zero valued (i.e. background) region is identified in the segmented image, and all of them is added to the liver except for the largest one which represent the real background. This process fills all lesions except for those located on the boundary of the organ (i.e. not fully surrounded by liver).
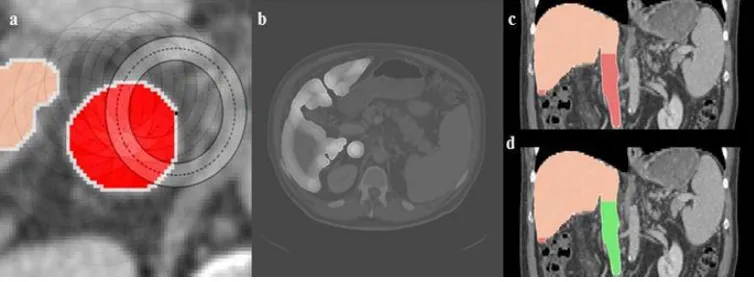
Fig. 3: IVC removal: Circular Hough transform is used to detect circles on axial slices (a). Probability map highlights voxels, which are likely to be located inside a vertical tubular structure (b). Detection of large 3D-connected tubular structure (c). Red regions are candidate for
removal, and the green region (IVC) is really deleted (d).
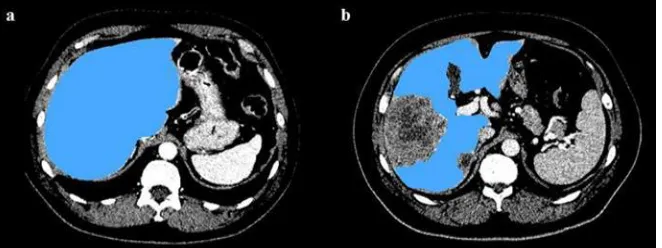
Fig. 4: Result of the portal-phase segmentation for an average case (a) and a case with large tumour (b).
The proposed algorithm can segment the liver within half a minute in average, while other techniques (including the best automatic one in precision) required at least 15-30 minutes to run per case. Only one automated approach [6] had similar efficiency as the proposed one. The mean difference of the manual and the automated method from the ground-truth liver volume was 23 cm3 (RVD = 1.4%) and 2.9 cm3 (RVD = -0.5%), respectively, which also shows the proposed algorithm was more accurate than the manual segmentation. Both automated and manual liver volume measurements were strongly correlated to the ground-truth with respective Pearson coefficients of 0.87 (p<0.0001) and 0.91 (p<0.0001).
Automated MR Image Segmentation
This section presents an automated liver segmentation method that uses probabilistic liver model to increase the accuracy of the intensity-based segmentation technique presented in prior sections. The novelty of the proposed model is that it is partitioned into 8 segments according to the anatomy of the liver. The partitioning allows using different intensity statistics in different parts of the organ, which makes the segmentation less sensitive to local intensity differences caused by pathology or MR artefacts. The method was evaluated using eight representative contrast-enhanced MR exams. The results showed the proposed algorithm can accurately segment the liver in short time despite the significant intensity variation that is characteristic for MR images. The automated segmentation of contrast-enhanced MR images is very challenging due to various reasons. The first problem is that the intensity values in the MR images cannot be associated with any material or tissue type, which is due to the physics of MR image acquisition (i.e. the measured signal is related to the molecular environment of hydrogen protons they are embedded in). Moreover, the heterogeneity of the normal liver can be different in different contrast phases, which makes it very difficult to detect the normal liver based on the joint information of more phases according to our preliminary experiences. Examples for the above mentioned issues are visualized in Fig. 5.
Fig. 5: Challenges of MR image segmentation: the healthy liver parenchyma has different intensity at different locations due to signal inhomogeneity (a – arrow in left lobe) or near the boundary of the acquired field of view (c – arrow in the top of the liver). Pathologies can
have similar intensity as the air (b – top arrow), and motion artefact can introduce artificial contours (b - bottom arrow).
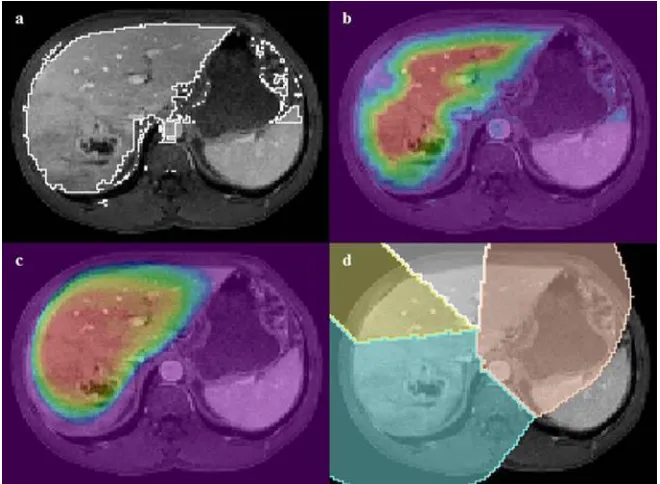
Fig. 6. The input image is thresholded (a), distance map is computed (b – red colour represents large distance), registered probability map (c – red colour represents high probability), dilated average liver shape with anatomical segment information using different colours (d).
Table – 2
The Accuracy of the Results When the Segmentation Uses Global Intensity Statistics
Exam TPVF FPVF DSC VOE RVD ASSD MSSD
A 84.6 3.7 89.9 18.4 −11.7 3.0 33.1 B 66.6 0.1 79.9 33.4 −33.3 5.9 45.9 C 67.1 0.2 80.2 33.1 −32.7 6.5 48.8 D 88.8 2.2 93.0 13.1 −9.0 2.5 39.7 E 77.2 1.2 86.6 23.7 −21.6 4.1 27.6 F 82.3 0.6 90.0 18.1 −17.1 3.8 40.3 G 72.7 2.7 82.9 29.2 −24.6 6.1 30.7 H 87.7 0.5 93.2 12.7 −11.9 2.1 29.2 AVG 78.4 1.4 87.0 22.7 −20.2 4.2 36.9 SD 8.9 1.3 5.4 8.4 9.5 1.7 7.9 Diff −12.8 −1.2 −7.1 11.6 −14.1 2.0 2.9 p 0.0007 0.0795 0.0024 0.0015 0.0004 0.0032 0.4793
In case of using global statistics (Table 2) the metrics are slightly different. Both VOE and (absolute) RVD are significantly higher, and DSC and TPVF are much lower, only FPVF is nearly the same in average. According to the surface metrics the average ASSD as well as the average MSSD are higher. The difference between the average metrics (that was statistically significant for 5 of the 7 metrics – see bottom row of Table 2) show that better segmentation quality can be achieved by using local intensity statistics [8].
Automated Liver Lesion Detection
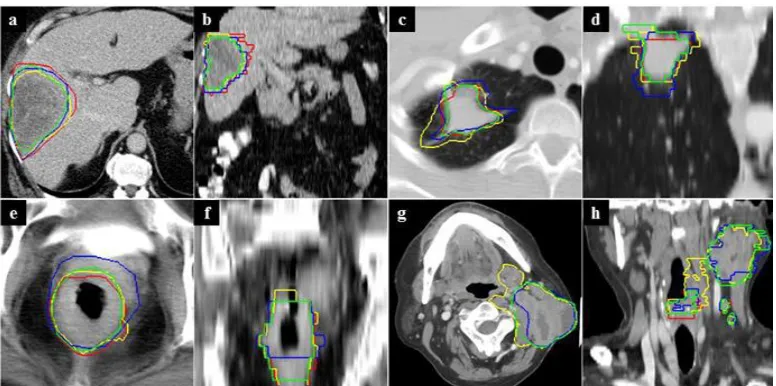
Fig. 7: Inter-operator variability of tumour contouring for liver (exam 3 – a, b), lung (exam 8 – c, d), rectum (exam 11 – e, f ), and neck (exam 9 – g, h) tumours: The axial (a, c, e, g) and coronal (b, d, f, h) views are displayed. The colours (red, yellow, blue, green) represent the different
operators (O1, O2, O3, O4), respectively.
The value of the OVR shows the overlap of contoured tumours. This measure can be small even if the tumour volume shows small variation. For example, in case 23 CV was equal to 7% (small volume difference) while OVR = 40% which means moderate overlap of the four contours. The lowest average overlap (32%) was characteristic for neck cases (which was mainly due to case 9). Better overlap belonged to lung (41%) and rectum (47%) tumours, and the best overlap was measured for liver tumours (58%). Figure 7 demonstrates 4 contoured cases, where different colours represent the different operators (red – O1, yellow – O2, blue – O3, green – O4). In case of the liver tumour (case 3 – a, b) the contour had small variation. The contours belonging to the lung (case 8 – c,d) and the rectum (case 11 – e, f) tumours showed more variation. In the case of neck tumour (case 9 – g, h) the variation was slightly visible (see the lack of red contour). From the presented difference measures and screenshots one can see that it is very challenging to define ground-truth for tumour contour which can be used to evaluate automated segmentation methods. The idea behind the proposed method is to compute a map that represents the level of abnormality with respect to the healthy liver, and perform a multi-level morphological analysis for all local maxima of this map in order to separate lesion from other abnormal regions. The morphological analysis incorporates various geometric features. These features are considered as probability factors, the product of which is used to classify abnormal regions and define the contour of them.
Preprocessing & Computing Segmentation of Abnormal Regions
The input of the proposed method consists of a portal-phase abdominal CT image and the segmented liver that serves as volume of interest (VOI). Since many steps of the proposed algorithm are related to morphology, the input images are first resampled to isotropic voxel spacing. This way, several functions (e.g. morphology operators, computing compactness) shall not incorporate voxel asymmetry, which makes them more efficient. The resampling uses the x (that is equal to the y) voxel spacing of the input CT (or 0.65 mm, when it is smaller). In order to reduce pixel noise, the input CT image is convolved using Gaussian kernel having 1 mm radius. An automatically segmented liver may exclude lesions at the organ boundary. In order to reduce false negative detections due to under-segmentation of the liver, morphological closing is applied to the input VOI. A voxel in the abnormality map can have a high value for two reasons: whether its intensity differs from the normal liver significantly, or it is located far from the normal parenchyma. Figure 8 shows two examples for CT image (a, c) and the corresponding abnormality map (b, d). In the first case (a, b) two small (8 mm) hypo-dense lesions are clearly visible in the abnormality map due to their significant intensity difference. In the second case (c, d) a nearly iso-dense lesion is enhanced due to its large (30 mm) size.
Multilevel Morpological Analysis
The partitioned abnormality map consists of regions with a zero (representing normal liver, organ contour, fat) or positive (abnormal areas) values, and its maximum regions represent the centres of abnormal areas. The goal of this step is to analyse the neighbourhood of each abnormal region, starting from the maximum region and iteratively adding its neighbours in order of decreasing abnormality. In each iteration (i.e. at each abnormality level), various geometric features are computed for the actual set of regions.
Evaluation of Automated Liver Lesion Detection
The proposed algorithm processed [10] one case in an average of 28.2 (±7.7) seconds when started from manually defined liver. When the liver was segmented automatically, the running time was 30.1 (±9.8) seconds on average due to the additional morphological opening of the preprocessing step. The liver segmentation took 20.2 (±4.5) seconds on average, which means the whole process was done in less than 1 minute for one case. Considering running time, the proposed method is absolutely competitive. Only the method of Wu et al. [84] can demonstrate such a low time for automated liver lesion detection. Although the test dataset originates from a liver segmentation contest [11], it was appropriate to give an overall picture about the efficiency of the proposed legion detection method because it involved various types of lesions. The evaluation showed the method can detect the majority of lesions, but its clinical usability shall be confirmed by extensive evaluation involving all types of liver lesions. The proposed algorithm can efficiently detect liver lesions irrespective of their size, shape, density, and heterogeneity within short running time (half a minute).
Virtual Volume Resectional Evaluation
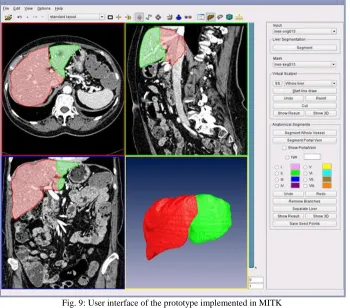
For evaluation purposes the proposed algorithm was integrated into MITK [12]. This open-source software framework allows displaying medical images with segmentation results, handling user interactions such as drawing traces into axial, coronal, or sagittal slices, executing the algorithm for partitioning the liver, and visualizing the partitions in 3D view or superimposed on 2D slices using different colours (see screenshot in Fig. 9).
Fig. 9: User interface of the prototype implemented in MITK
III. RESULT & DISCUSSION
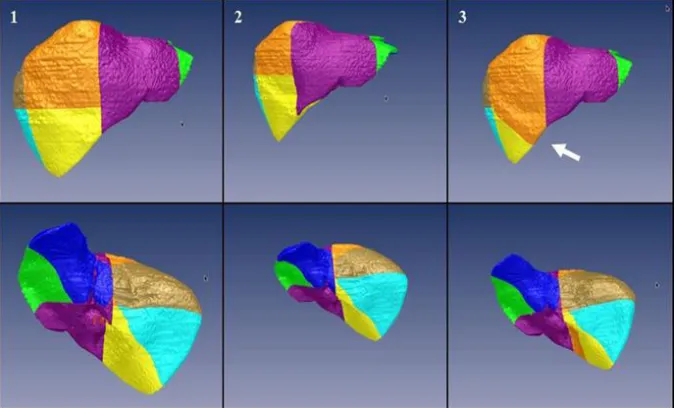
Based on the presented numbers the largest average variation (2.8%) was observed in case 14 (with segment specific variations equal to 0.3%, 0.4%, 0.6%, 5.5%, 4.0%, 3.2%, 5.7%), which was due to large variation in the right liver (i.e. last four values). The lowest average variation (1.1%) belonged to exam 5 (0.6%, 1.3%, 1.4%, 1.1%, 0.8%, 2.2%, 0.2%), while the mean average variation was 1.9%, which was close to that (2.1%) of exam 7 (2.0%, 1.3%, 2.3%, 1.1%, 2.3%, 2.3%, 3.2%). Figure 10 shows the result of the liver segment separation for case 14. The result of all 3 runs are shown from anterior as well as posterior view, where segments 2, 3, 4(+1), 5, 6, 7, and 8 are displayed with green, blue, purple, yellow, cyan, gold, and orange colours, respectively. In case of this exam the large intra-operator variability of segment volumes was due to the different definition of the surface that divides the right liver into superior and inferior parts. As result of that, the size of segment 8 increased, and that of segment 5 was significantly smaller in the third test (see white arrow on Fig. 10/3).
Fig. 10: Result of the liver segmentation for exam 14 in 3 different times (in columns): each result is shown from anterior (top) and posterior (bottom) views. The large intra-operator variation was due to the different definition of the surface fit to the right portal vein, as result of which
segment 8 (orange) had increased volume in contrast to segment 5 (yellow) – demonstrated by the white arrow.
Figure 11 demonstrates the first case study for tumour resection. In this case three tumours were found at the superior part of the right lobe and the partial resection of the right lobe was simulated. In order to define the cutting surface 4 traces were manually drawn on axial slices. The first trace (a) was placed at the top of the liver at the boundary of the left and right liver, the second (b) and third traces (c) were placed approximately 20 mm far from the lesions, and the fourth one (d) was placed outside the liver below the bottommost lesion. The result of the virtual cut is displayed in an axial view (e) and in 3D (posterior) views. When the resected part is not visible (h) one can see the cutting surface is smooth and the location of the input traces is not remarkable. In addition to the visualization the volume parts were quantified: the remnant liver (red) was 1461 cm3, and the resected part (green) was 716 cm3.
Table 3 shows the average volume of the anatomical liver sections (in percentage of the total liver) for the proposed method and the two references.
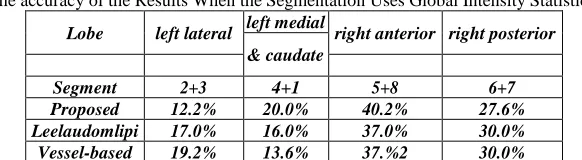
Table – 3
The accuracy of the Results When the Segmentation Uses Global Intensity Statistics.
Lobe left lateral left medial right anterior right posterior & caudate
Segment 2+3 4+1 5+8 6+7 Proposed 12.2% 20.0% 40.2% 27.6% Leelaudomlipi 17.0% 16.0% 37.0% 30.0% Vessel-based 19.2% 13.6% 37.%2 30.0%
According to the results of the proposed method, the left lateral lobe (segment 2+3) was equal to 12.2%, the left medial (4+1 ) lobe was equal to 20%, the right anterior lobe (5+8) was equal to 40.2%, and the right posterior lobe (6+7) was equal to 27.6% of the total liver volume. The corresponding volumes reported in the paper of Leeluudomlipi [14] are 17.0%, 16.0%, 37.0%, and 30.0% (correlation=0.94), while the vessel-based segment separation resulted in lobes having volume equal to 19.2%, 13.6%, 37.2%, and 30.0% (correlation=0.87), respectively.
IV. CONCLUSION
In conclusion, the algorithm presented for cutting a 3D object with a B-spline surface proved to be efficient for liver lobe and segment separation and tumour resection simulation. The tool based on the proposed algorithm provides the level of freedom that is required for such a complex task as complete anatomical segment separation that can be automated to some extent as presented. The constraints of the surface interpolation (e.g. user shall draw all traces on the same type of slices) do not limit its clinical usability, however, they allow very quick processing. the study showed that automated liver volume measurement based on multi-phase CT examinations is feasible with reduced computation time when the proposed multi-multi-phase method is used. the proposed algorithm can efficiently detect liver lesions irrespective of their size, shape, density, and heterogeneity within short running time (half a minute). The experiences with tumour resection simulation indicate that the tool provides the level of freedom that is enough to solve real clinical problems.
REFERENCES
[1] Smith, T.F., Waterman, M.S.: Identification of Common Molecular Subsequences. J. Mol. Biol. 147, 195–197 (1981). [2] Prabu, A. Jerwin. "A Bıometrıc Recognıtıon System for Human Identıfıcatıon Usıng Fınger Veın Patterns." (2017).
[3] Kunio Doi; Computer-aided diagnosis in medical imaging: historical review, current status and future potential; Comput Med Imaging Graph 31(4-5): 198-211, 2007.
[4] Hartigan, J. A., Wong, M. A., Algorithm AS 136: A K-Means Clustering Algorithm, Journal of the Royal Statistical Society, Series C 28 (1): 100–108, 1979. [5] Alain Luciani, László Ruskó, Laurence Baranes, Eric Pichon, Blandine Loze, Jean-Francois Deux, Alexis Laurent, Jeanne Tran-Van-Nhieu, Alain Rahmouni. Automated liver volumetry in orthotopic liver transplantation using multiphase acquisitions on Multi Detector Computed Tomography (MDCT). American Journal of Roentgenology 198(6):568–574, Jun 2012.
[6] K. A. Saddi, M. Rousson, C. Chefd’hotel, and F. Cheriet, “Global to-local shape matching for liver segmentation in CT imaging,” in Proc MICCAI Workshop on 3D Segmentation in the Clinic: a Grand Challenge, 2007, pp. 207–214.
[7] Kunio Doi; Computer-aided diagnosis in medical imaging: historical review, current status and future potential; Comput Med Imaging Graph 31(4-5): 198-211, 2007.
[8] D. Wu; D. Liu, M. Suehling, C. Tietjen, G. Soza, K. S. Zhou; Automatic detection of liver lesion from 3d computed tomography images; 2012 IEEE Computer Society Conference on Computer Vision and Pattern Recognition Workshops, 31-37, 2012.
[9] Prabu, A. J., Narmadha, J., & Jeyaprakash, K. (2014). Artificial Intelligence Robotically Assisted Brain Surgery. Artificial Intelligence, 4(05).
[10] L. R. Folio, M. M. Choi, J. M. Solomon, N. P. Schaub; Automated registration, segmentation, and measurement of metastatic melanoma tumors in serial CT scans; Academic Radiology 20(5), 604-613, 2013.
[11] C. E. Metz; Receiver operating characteristic analysis: a tool for the quantitative evaluation of observer performance and imaging systems; Journal of the American College of Radiology 3(6), 413-422, 2006.
[12] T. Heimann, M. Styner, and B. van Ginneken, eds., MICCAI Workshop on 3D Segmentation in the Clinic: a Grand Challenge, http://mbi.dkfz-heidelberg.de/grand-challenge2007/sites/proceed.htm, 2007.
[13] M. Nolden, S. Zelzer, A. Seitel, D. Wald, M. Müller, A. M. Franz, D. Maleike, M. Fangerau, M. Baumhauer, L. Maier-Hein, K. H. Maier-Hein, H. P. Meinzer, I. Wolf, The Medical Imaging Interaction Toolkit: challenges and advances , International Journal of Computer Assisted Radiology and Surgery 8(4), 607-620, 2013.