Business Model With Virtual Linearity Using
Statistical Inference Tool (VL-SIT)
Abdul Mannan, Nasir Uddin Khan, Mushtaq Hussain, Asif Mansoor, Mujtaba Hussain
Research fellow, Department of Mathematics, University of Karachi, Karachi, Pakistan; Department of Mathematics, University of Karachi, Karachi, Pakistan;
Dean of Sciences, Newport University, Karachi, Pakistan;
National University of Science and Technology (NUST), Karachi, Pakistan; Karachi, Pakistan.
Email: [email protected]
ABSTRACT: Business Model is an approach to resolve structural complications encountered during business process design or during modification to remove typical business-process problems in terms of process hierarchy or execution hierarchy or any other design related business rule implementa-tion hierarchy Such problems are normally unresolvable by simple methods or through mathematical methods or even statistical analysis or Relaimplementa-tional Database systems with statistical analysis tools But there is a need to resolve every such complication before the model is implemented for practical use or at least some optimization to reduce the effects of natural non-linearity on actual process due to multi-dimensional cross-linkage between the process parameters and liquefiable numeric weight values Although the structural fabric of Business Process design involve many cross conflictions in terms of Commercial parameters such as process profitability or profit-credentials or any value-added subentity in the context of business statement language when converted into model language such as Mathematical relation or statistical declaration or an approximate probability proposition So a workable concept is adopted to select the virtual linearity as simulated representation of a articular business process using statistical inference based on existing data model fitted on some running processes which has relations from Mathematical inference as a solution to common business problems. The tool is a direct rule based selective inference linked with virtual parameters assigned to simulate linearity keeping actual data affectivity on main process as to minimize the non-linear behavior as par as null or even void in certain short turned around processes loops A business model with simulate able virtual linearity may represent an easy and workable process to be able to repeat the process cycle multiple times without any noticeable drift of factor respon-sible for process outcome due to (VL-SIT)
Keywords:Business Process Design, Structural Complications, cross-confliction, relational business process data, statistical inference tool, Rule-based selective inference, simulated linearity.
1
I
NTRODUCTIONBusiness Process Design requires deep and thorough workout taking all parametric considerations into account using tools from Modern Mathematical Sciences under the specific cap-tion of “OPERATIONRESEARCH” as a sub-domain of the ma-thematical sciences, The “OPERATIONRESEARCH” has grown-up with smart and prompt solutions easily convertible into simulate-able modeling for comparisons and ratings par-ticularly for a new process design This capability of ”ORM ap-plication” is further elaborated in terms of its core effectiveness when the application is transformed into virtual linearity block by block and stage by stage with powerful software supported by computer sciences, as the distinct virtuality of computerized concepts can be quickly transformed into practical reality of the designed business process The statistical inference is the tabulated archives of consistent data in a pre-determined and well organized substitution indicating parameters to variables and parameters to constants indexing links The Virtual linearity is a simulated relationship with lot of adjustments and com-promises between operating parameters and the responsible variables with certain reservations and short comings The (VL-SIT) works well at least for very odd nonlinear business process which cannot be defined by single mathematical equ-ation due to inherent cross conflictions in between structural components belonging to the main business process equation designed The main constraint in solving nonlinearity of a re-presentation is the non availability of the trend determining factor; one can only rely on previous data to assume future value of the business process equation or a statistical value estimator using statistical inference Statistical sciences are now being supported by “Very high speed data processing computations” and can be used to resolve up to some extent the ”unpredictable non-linearity” of a business model at key
Hypothesis #1 number one: All the business process inputs are homogenous and equitable for any arbitrary weight as-signment to set any numeric comparison or to execute any numeric operation Hypothesis #2 number two: All the busi-ness processes are unified in nature and unidirectional in processing scheme (No effect of Back propagation of the data which can alter the outcome) Now two distinct variety of process models one as NON-LINEAR and other as LINEAR business process are possible after the workout and setting the goals and objectives of the business process Hypothesis #1 can be numerically estimated as the 95% of the input due to its homogeneity produces Non-successful result on Baye-sian Test and so it also confirms the ”Hypothesis statement” of equity in processing scheme Similarly Hypothesis #2 is con-verted into a numeric value statement as 85% non-linear process forwarding in general selective outcomes Which re-veals that only possible process with non-linearity can be qual-ified as successful Bayesian Test qualifier as 85% and the first application cycle through simulation mode pretend 85% Processes as NON-LINEAR and only 5% qualifies as LINEAR now if the Virtual Linearity is imposed then the possibility of turning a NON-LINEAR business process model into a LI-NEAR one will become
Successful Bayesian Test Frequency
LINEAR NON LINEAR
0.05 0.85
Non-Successful Bayesian Test
LINEAR NON LINEAR
0.95 0.15
This (2 X 2) Filter now provides a basic strategy of conflicts removal between Non-Linear Population of business processes and Linear Population of Business processes as declaring (BTS-Frequency) as the Bayesian Test Successful frequency and (NSBT-frequency) as the Non-Successful Bayesian Test frequency on three modules of thick density Data table
BTS-Frequency
LINEAR VIRTUAL LINEAR NON LINEAR
0.05 0.78 0.07
NSBT-Frequency
LINEAR VIRTUAL LINEAR NON LINEAR
0.95 0.22 0.93
So a forced linearity which in fact cannot be imposed on a natural process designed for a real business system can be re-designed with a virtual process feeding linearity wherever it finds a loop escaping at co-relations and maintains throughout the process-turn-around-time until at the final phase or at least at the end of the cycle
2
S
ELECTEDM
ETHODA
NDA
DOPTEDM
ETHODOLOGYThe base method selection is based upon the data filters ap-plied and alteration of a particular business rule to avoid ob-served non-linearity in the business process design taking Statistical Inference as the decisive indicator to alter the data generating rule The Business Rule as base definition of the process Model from the generated data clusters first filtered out by a weight assigned (2X2) Argument Matrix and then the Bayesian Function Modified for induction of some closest li-nearity or compromised lili-nearity through Virtual lili-nearity data inclusion VL-SIT is an induction over a process data cluster by applying minimum possible weight-assignments to various data generating relations or business rules obeying a mathe-matical equation to handle the variables of choice in a busi-ness process of unpredicted non-linearity using Bayesian Sta-tistical analysis techniques determined from well-organized business process data clusters
3
S
TRUCTUREO
FT
HE“(VL-SIT)”
T
OOLA Common Business Model with some natural non-linearity observed or predicted by designed feature of the process flow chain with a mathematical representation indicating the expo-nent of non-linearity is selected for tool testing structure as per definition And taken as process outcome [Y(x)´] verses input variables [(x as linear variable x´ as non-linear variable)] Such that a predictable non-linearity can be observed between any two data clusters samples taken at random for any simple business outcome [Y(x)]´ which is associated with linear input variable (x) That is the situation where a system’s non-linearity takes effect on the process out come as [Y(x)]´ And now under (2X2) situation matrix the possible outcomes are four distinct classes
(a) A linear input to produce a Linear Output (b) A Non-linear input to produce a Linear output (c) A linear input to produce a Non-linear output and (d) A Non-linear input to produce a Non-linear output
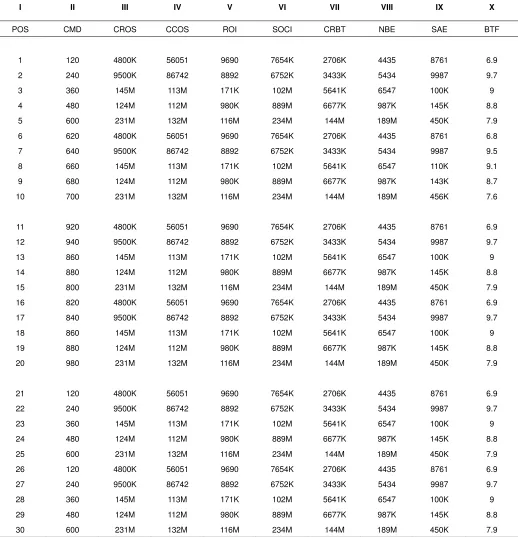
correla-CROS: Cash Returned On Sales (Cash value in + numeric value)
CCOS: Cash Consumed On Service (Cash value in -numeric’s)
ROIG: Return On Investment Gross (Cash value in numeric)
COSI: Cash value of Stock Inventory
CRBT: Cash Rolling on Business Transactions NBE: Non Business Expenditure
SAE: Suspense and Accidental Expenditure BTF: Business Transactional Factor
TABLE I A data to organize a relation between business co-factors K based on co-efficient adjusted inference index with correla-tion and the process outcomes of situacorrela-tion matrix M
I II III IV V VI VII VIII IX X
POS CMD CROS CCOS ROI SOCI CRBT NBE SAE BTF
1 120 4800K 56051 9690 7654K 2706K 4435 8761 6.9
2 240 9500K 86742 8892 6752K 3433K 5434 9987 9.7
3 360 145M 113M 171K 102M 5641K 6547 100K 9
4 480 124M 112M 980K 889M 6677K 987K 145K 8.8
5 600 231M 132M 116M 234M 144M 189M 450K 7.9
6 620 4800K 56051 9690 7654K 2706K 4435 8761 6.8
7 640 9500K 86742 8892 6752K 3433K 5434 9987 9.5
8 660 145M 113M 171K 102M 5641K 6547 110K 9.1
9 680 124M 112M 980K 889M 6677K 987K 143K 8.7
10 700 231M 132M 116M 234M 144M 189M 456K 7.6
11 920 4800K 56051 9690 7654K 2706K 4435 8761 6.9
12 940 9500K 86742 8892 6752K 3433K 5434 9987 9.7
13 860 145M 113M 171K 102M 5641K 6547 100K 9
14 880 124M 112M 980K 889M 6677K 987K 145K 8.8
15 800 231M 132M 116M 234M 144M 189M 450K 7.9
16 820 4800K 56051 9690 7654K 2706K 4435 8761 6.9
17 840 9500K 86742 8892 6752K 3433K 5434 9987 9.7
18 860 145M 113M 171K 102M 5641K 6547 100K 9
19 880 124M 112M 980K 889M 6677K 987K 145K 8.8
20 980 231M 132M 116M 234M 144M 189M 450K 7.9
21 120 4800K 56051 9690 7654K 2706K 4435 8761 6.9
22 240 9500K 86742 8892 6752K 3433K 5434 9987 9.7
23 360 145M 113M 171K 102M 5641K 6547 100K 9
24 480 124M 112M 980K 889M 6677K 987K 145K 8.8
25 600 231M 132M 116M 234M 144M 189M 450K 7.9
26 120 4800K 56051 9690 7654K 2706K 4435 8761 6.9
27 240 9500K 86742 8892 6752K 3433K 5434 9987 9.7
28 360 145M 113M 171K 102M 5641K 6547 100K 9
29 480 124M 112M 980K 889M 6677K 987K 145K 8.8
4
S
TATISTICALI
NFERENCEThe Data tables are highly non-homogeneous as per records and tabulation of the selected parameters of a business process and Statement indication represent many conflictions with the process itself in cross either with value or with rule Process Predicted Non-linearity is indicated by the data field of CMD and ROI verses POS Field Now Bayesian Function will be used to resolve some issues on available nonlinear linkage between data items and the generating rules of the business process The Hidden randomness of the process flow cannot be predicted by any probability algorithm but can only be esti-mated as a rough index over available data of such situation So (SL-SIT) which is based on coefficient adjustment and infe-rence index with co-relation compensation takes the row and column wise operation to induct a “VIRTUAL LINEARITY” and thus the generating rule is slightly modified to produce a comfortable linear output against linear as well as non-linear input to the business process
5
A
LGORITHMThe main procedure to impose statistical linearity using differ-ent parameter which is linked with each other in a non-linear relationship. The main data difference is taken as course index of change in the inference of business rule [Y(a) α X(b)]and the least data difference will be taken as five index of change in the inference. The general adjustment of the non-linearity will be carried out by summy the two opposite indexes for one key point. The Algorithm include bayesian test using a 2x2 matrix of the conditionality depicting the possible cases of out-comes verses input, there are two hypotheses, one is the situ-ation -1 which is described by the default design of the situa-tion matrix and the situasitua-tion -2 is described by the another possible condition.
6
N
ONL
INEARITYC
URVEY(a1), Y(a2), Y(a3)………Y(an)
Where
a1, a2, a3……….an
are statistical data points for corresponding key parameter x(b) there are
b1, b2, b3...bn
Statistical value points
VL-SIT INDEX ∆, δ
∆= ࡿ= ࢞ሺ࢈ᇩᇭᇪᇭᇫሻ ࡹࡶࡻࡾ
ି ࢞ሺ࢈ᇩᇪᇫሻ ࡹࡵࡺࡻࡾ
࢈ି ࢈ ࢟ሺࢇሻ (1)
ࡹࡶࡻࡾ ࡹࡵࡺࡻࡾ
7
R
ESULTA
NDD
ISCUSSIONMany complicated business process were selected and the extended data and is testing using (VL-SIT Tool) and the out-comes exercises found in-conformity of the proposed linearity. The first result from a multinational computer selling company is tested using (VLSIT Tool) on the inference of six parameter out of nine and the BTF (Business Transactional Factor) has been achieved very closed to 90%, which is a successes. The test result shows BTF (Business Transactional Factor) of be-low 5.7% is up lifted to 6.9%.
8
C
ONCLUSIONThe virtual linearity is a simulated relationship with lot of ad-justment and compromises between operating parameters and the responsible variable with certain reservations and short comings. The mathematical work out of (VL-SIT Tool) of above business model with problems of non-linearity needs some data points which can be easily plotted into simple linear ma-thematical matrices for linear out-comes. (VL-SIT Tool) works well at least for very odd non-linear business process which cannot be defined by single mathematical equation due to in-herent cross confliction in between structural components be-longing to the main business equation designed
R
EFERENCES[1] Kirby M. W (Operational Research Society) ISBN 1-86094-366-7 , ISBN 978-1-86094-366-9
[2] International Journal of Operations Research and Informa-tion Systems (IJORIS)": an official publicaInforma-tion of the In-formation Resources Management Association, published quarterly by IGI Global
[3] “What is OR”. http://www.hsor.org/what_is_or.cfm 2002.
https://www.informs.org/About-INFORMS/What-is-WO291/1301 Quoted on the dust-jacket of: Morse, Philip M, and Kimball, George E, Methods of Operations Re-search, 1st Edition Revised, pub MIT Press & J Wiley, 5th printing, 1954.
[6] “Quantitative Management” http://brochure.unisa.ac.za/myunisa/data/subjects/Quantit ative%20Management.pdf
[7] Operations research (industrial engineering): History -
Bri-tannica Online
Encyclope-dia”http://www.britannica.com/EBchecked/topic/682073/op erations-research/68171/History#ref22348 1995.
[8] “DecisionPro, Inc. - Makers of Marketing Engineering Software http://www.decisionpro.biz 2001
[9] The Society for Modeling & Simulation International http://www.scs.org/jdms 2011
[10] “The Society for Modeling & Simulation International” "JDMS". http://www.scs.org/jdms. November 2011
[11] "Mathematical Methods of Operations Research website". http://www.springer.com/business+%26+management/ope rations+research/journal/11750 November 2011.