________________________________________________________________________________________________________________________________________________________________________________
101 | P a g e
PAPER ID: NITET23
CONTROL SCHEME FOR A STAND-ALONE WIND ENERGY CONVERSION
SYSTEM USING MATLAB SIMULATION
MISS. MANJARE SHUBHANGI SHIVAJI
Department of Electrical engineering, FTC COER,Sangola, Maharashtra, India, [email protected]
PROF. AKIREDDY SHRAVAN KUMAR
Department of Electrical engineering, FTC COER, Sangola, Maharashtra, India, [email protected]
ABSTRACT
As renewable energy comes from naturally available and are not much expensive. So among solar, wind, tidal energy, wind energy is considered to be proven technology. Comparing cost of electricity generation, now days Wind Energy Conversion System (WECS) is built for meeting both grids connected and stand-alone load demand. WECS is the machine consists of wind turbine which has wind energy as a input and it generates mechanical energy as output. This mechanical output is given as input to electrical generator for generating electricity.
In this paper, for purpose of continuous supply of power, storage device like battery is used as a backup and to fulfill the requirement of standalone DC load, for which a hybrid of wind and battery system is proposed. The charging and discharging of battery is based on turbine maximum power point (MPPT) technique. The mechanical and electrical protection is provided by pitch control technique. The proposed Wind Energy Conversion System will be simulated in MATLAB/SIMULINK by integrating MPPT charging control technique and pitch control technique.
KEYWORDS: Maximum power point tracking (MPPT), pitch control, state of charge (SoC), wind energy conversion system (WECS).
I. INTRODUCTION
Development in any sector cannot be brought about without use of electric energy. Development in every sector is taking at high speed and so the conventional sources are depleting rapidly. Thus there is a need of explore the renewable energy sources to meet the demand. In renewable energy sources, wind is a potential source of low cost and clean electricity generation. Since, the wind flow is random, new technique and control strategies need to be found out to develop efficient control WECS. In WESC generator is an integral part. Numerous researches are carried out these days for choosing proper generator for stand-alone WECS. Self-excited induction generator (SEIG) is one of the prominent generators used in WECS because of its
robustness and operational simplicity. The output power of SEIG is depends on wind flow which is unpredictable in nature. Amplitude and frequency of SEIG fluctuates with speed of wind. In order to ensure a continuous and regulated load voltage, fluctuations should be smoothened out. Power electronics converts can be integrated with WECS to fulfill the regulated voltage requirement.
WECS also requires an energy storage system such as battery to capture maximum power from available wind. While storing energy from wind mill to the battery maximum available battery charging current and battery overcharging is not considered. In order to consider these points charge controller is required. Such control scheme is for battery charging for standalone WECS is met by using MPPT. Our proposed control scheme using MPPT utilizes the turbine maximum power point tracking technique with battery SoC limit logic to charge the battery in controlled manner. MPPT logic is parameter independent as it forces turbine to operate at optimum TSR. The battery charging current is always continuous with low ripple and thus harmonic heating is eliminated. If wind exceeds its rated speed then absurd condition will occur. So WT power speed has to be regulated for electrical and mechanical safety point of view. This control is achieved by changing pitch angle to required value. Various MPPT scheme with and without battery charging mode control and pitch control technique have been put forward but none of the control strategies proposed so far has integrated all these control strategies. By using pitch control, protection against turbine over speed, overloading and over voltage at rectifier output can be avoided.
II. HYBRID WIND-BATTERY SYSTEM FOR AN ISOLATED DC LOAD
________________________________________________________________________________________________________________________________________________________________________________
102 | P a g e
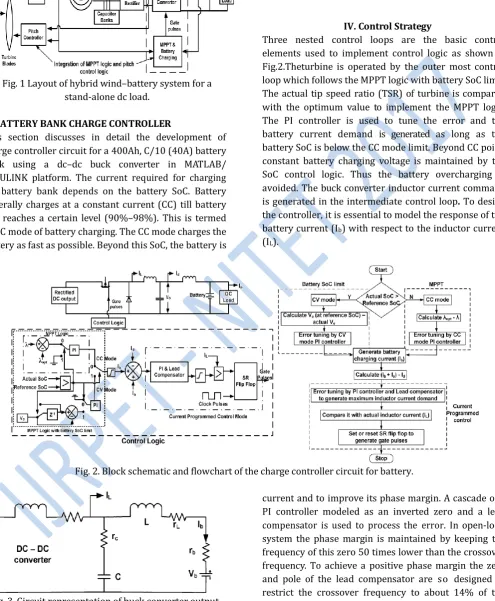
Fig. 1 Layout of hybrid wind–battery system for a stand-alone dc load.
III. BATTERY BANK CHARGE CONTROLLER
This section discusses in detail the development of charge controller circuit for a 400Ah, C/10 (40A) battery bank using a dc–dc buck converter in MATLAB/ SIMULINK platform. The current required for charging the battery bank depends on the battery SoC. Battery generally charges at a constant current (CC) till battery SoC reaches a certain level (90%–98%). This is termed as CC mode of battery charging. The CC mode charges the battery as fast as possible. Beyond this SoC, the battery is
charged at a constant voltage (CV) which is referred as CV mode of battery charging in order to maintain the battery terminal voltage.
IV. Control Strategy
Three nested control loops are the basic control elements used to implement control logic as shown in Fig.2.Theturbine is operated by the outer most control loop which follows the MPPT logic with battery SoC limit. The actual tip speed ratio (TSR) of turbine is compared with the optimum value to implement the MPPT logic. The PI controller is used to tune the error and the battery current demand is generated as long as the battery SoC is below the CC mode limit. Beyond CC point, constant battery charging voltage is maintained by the SoC control logic. Thus the battery overcharging is avoided. The buck converter inductor current command is generated in the intermediate control loop. To design the controller, it is essential to model the response of the battery current (Ib) with respect to the inductor current (IL).
Fig. 2. Block schematic and flowchart of the charge controller circuit for battery.
Fig. 3. Circuit representation of buck converter output
The actual converter output current (Id) and reference current (Ib + Ia) are compared to control the battery
current and to improve its phase margin. A cascade of a PI controller modeled as an inverted zero and a lead compensator is used to process the error. In open-loop system the phase margin is maintained by keeping the frequency of this zero 50 times lower than the crossover frequency. To achieve a positive phase margin the zero and pole of the lead compensator are so designed to restrict the crossover frequency to about 14% of the switching frequency.
________________________________________________________________________________________________________________________________________________________________________________
103 | P a g e
passing the lead compensator output through an adjustable current limiter. Depending upon the maximum power available at a given wind speed, the upper limit is varied whereas the lower limit is set to zero. The output of this limiter is used as the reference for the current controller in the dc–dc converter. By using peak current mode control in the inner most loop, the actual inductor current is made to track the reference. Finally, the compensated output of the intermediate loop and the instantaneous inductor current of the buck converter are compared. The gate pulses for the dc–dc buck converter are produced by applying the output of the comparator to an SR flip flop. The frequency of the gate pulse is equal to the clock pulse frequency which is 2 kHz. This method of generating gate pulses for the converter is known as the current programmed control technique. By using this method we can prevent the inductor current from going beyond the rated limit which in turn protects the buck converter switch and inductor from over current situation.
V. BATTERY CHARGING IN CC MODE
In CC mode, MPPT is implemented by comparing the actual and optimum TSR (λopt) which determines the battery charging current demand. The error is tuned by a PI controller and the battery charging current is generated as per the wind speed. In this mode, the MPPT logic tries to transfer as much power as possible to charge the batteries as the converter output voltage rises with time. The actual battery charging current does not remain constant but fluctuates with available wind speed subject to a maximum of C/10 rating of the battery.
VI. BATTERY CHARGING IN CV MODE
In the CV mode, the battery voltage and SoC escalates with time. However, the charge controller should not overcharge the batteries. To avoid gasification of electrolyte, the controller is switched over from CC mode to CV mode as soon as the battery SoC becomes equal to the reference SoC. In CV mode, the battery charging voltage is determined from the buck converter output voltage (Vo). The tuning of error is done by a cascaded arrangement of PI controller and lead compensator to generate the inductor current reference. It is then, by using a logical comparator, compared with the actual inductor current to generate gate. In this mode, the converter output voltage is maintained at a constant value by the controller action. As compared to CC mode, the battery voltage and SoC rise very slowly with time in CV mode. Since the potential difference between the buck converter output and battery terminal gradually
reduces, the battery charging current slowly decreases with time. The battery parameters and the converter output parameters are shown in Fig. 4. The plot shows the charging of battery in both the CC mode and CV mode. The changeover from CC to CV mode is done when the battery SoC reaches 98% as the threshold SoC for switch over in the control logic is set at 98% which is reached within 17s. As the battery reaches the threshold SoC level, the buck converter voltage is regulated by the controller action at a constant value of 53 V while the converter current gradually reduces from 40 A at 17 s to 10 A at 40 s. The battery SoC slowly rises from 98% to 98.03%.
Fig. 4. Battery charging modes at a constant wind speed of 10 m/s.
VII. SCHEME FOR PITCH CONTROL
________________________________________________________________________________________________________________________________________________________________________________
104 | P a g e
Fig. 5. Pitch control scheme for a stand-alone WECS.
VIII. SIMULATION ANALYSIS
The WT and battery parameters are observed for the following wind profiles.
1. GRADUAL RISE AND FALL IN WIND SPEED. Fig. 6(a) shows the influence of gradual rise and fall in wind speed on the WT.
The wind speed gradually rises from 8 to2 m/s in 15 s and then falls to 8 m/s in the next 15 s. The current profile of the converter, load and the battery are observed in Fig. 6 (b).
2. STEP VARIATION AND ARBITRARY
VARIATION IN WIND SPEED.
The variation of the wind profile in step from 8 to 12 m/s and arbitrary variation from 6 to 14 m/s is shown in Fig. 7(a) and 8(a) respectively. The efficiency of the complete control scheme is ratified with a step variation in wind profile and
an arbitrary varying wind speed. The response of WT parameter and the current
profiles with respect to step variations and arbitrary variations are shown in Figs. 7 and 8, respectively. The results also demonstrate the change in battery SoC for all possible wind profiles.
OBSERVATION POINTS:
The MPPT scheme regulates the TSR of WT at its
optimum value when the wind speed is below the rated value (10 m/s) irrespective of the variation in wind profile.
Maximum power is extracted from WECS at all
wind speeds to meet the load requirement and charge the battery bank.
In the situations when the wind power is not always sufficient to meet the load demand and charge the battery in CC mode, the system first meets the load requirement and charges the battery bank at a reduced rate.
When the wind power is insufficient as per the
________________________________________________________________________________________________________________________________________________________________________________
105 | P a g e
Fig. 6(a)
Fig. 6(b)
Fig. 6. (a) WT and (b) battery parameters under the influence of gradual variation of wind speed.
Fig. 7(a)
Fig. 7(b)
Fig. 7. (a)WT and (b) battery parameters under the influence of step variation of wind speed.
Fig. 8(a)
Fig. 8(b)
Fig. 8. (a) WT and (b) battery parameters under the influence of arbitrary variation of wind speed.
IX. CONCLUSION
WECS provides power that is fluctuating in nature and is incapable of providing uninterrupted power flow to the load. Therefore, in order to get uninterrupted power supply a hybrid wind-battery system is chosen. To reduce the random characteristics of wind flow the
________________________________________________________________________________________________________________________________________________________________________________
106 | P a g e
output power in accordance with the total demand the pitch angle is regulated by pitch action. Also the pitch control logic ensures that no overvoltage situation is caused by the rectifier voltage. The hybrid wind-battery system along with its control logic is tested in accordance with various wind profiles and is developed in MATLAB/SIMULINK. The outcome of the simulation experiments confirms the improved performance of the system.
REFERENCES
1) R. D. Richardson and G. M. Mcnerney, “Wind energy
systems,” Proc. IEEE, vol. 81, no. 3, pp378–389, Mar. 1993.
2) R. Saidur, M. R. Islam, N. A. Rahim, and K. H. Solangi, “A review on global wind energy policy,” Renewable Sustainable Energy Rev., vol. 14, no. 7, pp. 1744– 1762, Sep. 2010.
3) K. Y. Lo, Y. M. Chen, and Y. R. Chang, “MPPT battery
charger for standalone wind power system,” IEEE Trans. Power Electron., vol. 26, no. 6, pp. 1631– 1638, Jun. 2011.