T Mangilal et al. Volume 3 (3), 2015, Page-708-719 CODEN (USA)-IJPRUR,e-ISSN: 2348-6465
Original Article
Formulation and Evaluation of Nitrendipine Loaded
Transdermal Patch Using HPMC K-15 and Eudragit RS100
Polymers
T Mangilal* 1, K S K Rao Patnaik1, M.Satish Kumar2, L Thirupathi2, I Nagaraju2, P Veeresh Kumar3
*1, 1
Department of pharmacy, UCT, OU, Hyderabad, Telangana, India.
2
Geethanjali college of pharmacy, cheeryal, rangareddydistrict, T.S, India.
3
JPNES Group of institutions, Faculty of pharmacy, Mahabubnagar, T.S, India.
A R T I C L E I N F O A B S T R A C T
_______________________________________________________________________________
1. INTRODUCTION
International Journal of Pharma Research and Health Sciences
Available online atwww.pharmahealthsciences.net
Received: 23 May 2015
Accepted: 19 Jun 2015 Nitrendipine is an antihypertensive agent, classified under calcium channelblocker shows marked vasodilator action. The aim of the present work is to design and evaluate a matrix-type transdermal formulation containing nitrendipine with different ratios of hydrophilic (Hydroxy propyl methyl cellulose K-15) and hydrophobic polymer (eudragit RS 100) combinations plasticized with glycerine by the solvent evaporation technique. In the current study, effect of permeation enhancers include oleic acid, dimethyl sulfoxide (DMSO) and dimethyl formamide (DMF) is studied. FTIR studies were conducted to know the interference of the polymers in formulation and also physicochemical characteristics were studied for all prepared patches these include physical appearance, thickness, folding endurance, weight variation, percentage moisture loss, percentage moisture absorption, water vapour transmission, drug content and tensile strength. In vitro drug release studies were carried out with Franz diffusion cell using pH 7.4
phosphate buffer solution. Formulation patch F6 containing
hydroxypropylmethylcellulose k15 (500mg) has given drug release of99.626at48hrs. Thus, Formulation F6 was optimized as a best formulation. Final formulation was subjected to kinetic models such as zero order, first order, Higuchi and Korsmeyer-Peppas models. All the evalutation studies were given satisfied results. Therefore, it was concluded that Transdermal patches were prepared were found to be satisfactory. And also it was found that developed nitrendipine transdermal patch has considerable action of control drug release in blood stream.
Keywords:Transdermal patches, Nitrendipine, Solvent evaporation technique.
Corresponding author *
T Mangilal et al. Volume 3 (3), 2015, Page-708-719
709
Transdermal therapeutic system are defined as
'self-contained' discrete dosage forms which, when applied
to the intact skin, deliver the drug(s), through the skin,
at a controlled rate to the systemic circulation1.
Transdermal drug delivery systems (TDDS) offer many
advantages such as reduced side effects, elimination of
first-pass metabolism and improved patient
complience2,3. And also transdermal drug delivery
shows various physicochemical properties, such as
small molecular size, short half-life, low oral
bioavailability and low dose, etc4. In recent times,
transdermal patches are become most acceptable
approach for patients. Several drugs were administered
through transdermal route by matrix-type transdermal
patches include aceclofenac, dexamethasone,
terbutaline sulphate, atenolol, dilitiazem, etc.
present-day, transdermal patches are applied in several
therapeutical regions like smoking cessation, pain
management, harmone replacement and treatment of
heart disease5-9.
Nitrendipine as calcium blocker shows peripheral
vasodilation which effectively controls the blood
pressure at small doses i.e. 5-20 mg per day10. It was
orally well absorbed, but exhibits more fist-pass
metabolism, which leads to poor bioavailability11. Very
few studies were reported on transdermal patches using
nitrendipine as an anti-hypertensive agent. The drug
delivery into blood stream is based on types of
penetration enhancers used in formulation of
transdermal patches. Various studies were conducted
on preparation of nitrendipine transdermal patches
using azone12 and d-limonene13 as penetration
enhancers. Gannu R et al. developed matrix type of
nitrendipine transdermal patch by solvent evaporation
technique14. They had also reported that prepared
patches were evaluated through in vitro
characterization using Franz Diffusion Cell system.
Recently, several studies were performed using either
HPC or PVP in combination with different eudragit
polymers15-17. But the combination of HPMC K4 &
K15 with eudragit RS 100 has not yet been reported.
Hence, the current work is an attempt to formulate and
evaluate the nitrendipine transdermal patches using the
rare combination of HPMC K4 & K15 with eudragit
RS 100 as excipients.
2. MATERIALS AND METHODS
Materials
Nitrendipine was obtained from Mylan Laboratories
Ltd,Hydroxypropylmethylcellulose was procured from
Shreeji chemicals, Mumbai. Propylene glycol and
Dimethyl formamide were taken from LobaChemie,
Mumbai.Dibutyl phthalate, Potassium dihydrogen
phosphate, Sodium hydroxide, Dimethyl sulfoxide,
Glycerine, Carbopol 934 and Eudragit RS 100 were
obtained from S.D. Fine Chem. Ltd., Mumbai. All the
chemicals used were of laboratory grade.
Equipments
Electronic single pan balance (DS852J series, Essae
-Teraoka Ltd), Digital pH- meter (Control Dynamics,
Bangalore), Universal strength testing machine
(Hounsfield, Horsham, U.K), Digital caliper
(Aerospace), Magnetic hot plate (M B instruments,
Delhi), Melting point apparatus (Techno scientific
products), Digital ultrasonic cleaner (CD-4820 Techno
scientific pdts), Locally fabricated aluminum
mould(5*5), UV-Visible spectrophotometer (Shimadzu
UV-1800pc, Japan), FT - IR spectrometer (IR
affinity-1, Shimadzu, Japan).
Formulation of transdermal patch
Transdermal patches of Nitrendipine were prepared by
using polymers HPMC K-4 and K-15 by solvent
evaporation technique for the formulations. A solution
is prepared by dissolving weighed amount of drug and
polymer separately in water. To the mixture Dibutyl
phthalate, propylene glycol was added and mixed by
T Mangilal et al. Volume 3 (3), 2015, Page-708-719 formed. The drug-polymer solution is casted in a
bangle of area 16 cm2 which is placed in a petridish.
The mould was kept aside for 24hrs. Then, inverted
funnel was placed over the mould to prevent the
current of air. Finally, the patches were peeled from
petridish, and preserved in desiccators for further
studies.
Table 1: formulation chart of nitrendipine transdermal patches (F1-F16)
Ingredients (mg)
Formulation code
F1 F2 F3 F4 F5 F6 F7 F8 F9 F10F11F12F13F14F15 F16
Nitrendipine 40 40 40 40 40 40 40 40 40 40 40 40 40 40 40 40
HPMC-K4 100 200 300 400 500 - - - 100 200 -
-HPMC-K15 - - - 500 200 300 400 100 - - - -
-Propylene glycol
100 100 100 100 100 100 100 100 100 100 100 100 100 100 100
-Dibutylpthal ate
30 30 30 30 30 30 30 30 30 30 30 30 30 30 30 30
Water (mL) q.s q.s q.s q.s q.s q.s q.s q.s q.s q.s q.s q.s q.s q.s q.s q.s HPMC=Hydroxypropylmethylcellulose, q.s = quantity sufficient.
Method of preparation of buffer solutions18
Phosphate buffer (pH 7.4) solution: Fifty ml of 0.2M
potassium dihydrogen phosphate was taken in 200 ml
volumetric flask containing 39.1ml of 0.2M sodium
hydroxide solution and the volume was made up to the
mark with distilled water.
Potassium dihydrogen phosphate (0.2M) solution:
Potassium dihydrogen phosphate (27.218g) was added
to 1000ml volumetric flask containing distilled water
and the volume was made up to the mark with distilled
water.
Sodium hydroxide (0.2M) solution: Eight gram of
sodium hydroxide was taken in 1000ml volumetric
flask containing distilled water and volume was made
up to the mark with distilled water.
Analytical Method
Determination of λmax of Nitrendipine in
phosphate buffer (pH 7.4) solution: Preparation of
Nitrendipine standard stock solution (1000µg/ml) in
phosphate buffer (pH 7.4): standard stock solution of
Nitrendipine was prepared by dissolving accurately
weighed 100mg of Nitrendipine in the little quantity of
phosphate buffer (pH 7.4) in 100 ml volumetric flask.
Then, the volume was made up to 100 ml by using
phosphate buffer (pH 7.4) to obtain the solution of
1000µg/ml, scanning of Nitrendipine by
UV-spectrophotometer in phosphate buffer solution. From
the standard stock solution, 1ml was diluted to 100ml
with phosphate buffer solution. The resulting solution
containing 10µg/ml was scanned between
200to400nm.
Calibration curve of Nitrendipine in phosphate
buffer solution (pH 7.4): From the Nitrendipine
standard stock solution (1000µg/ml), 10ml solution
was diluted to 100ml using 7.4 pH phosphate buffer
solution (100µg/ml).appropriate aliquots were take into
different volumetric flasks and made up to 10ml with
phosphate buffer solution, so as to get drug
concentrations of 2.0 to 10.0µg/ml.The absorbencies of
these drug solutions were estimated at λmax225nm.
This procedure was performed in triplicate to validate
the calibration curve.
Evaluation of Transdermal Patches19-23
Melting point24: A small amount of drug in a capillary
tube was placed in a melting point apparatus and the
temperature at which drug melts wasrecorded. It was
performed thrice to get an average value of melting
point.
Determination of solubility25: An excess amount of
drug was taken and dissolved in a measured volume of
distilled water in a glass vial to get a saturated solution.
Then, the solution was sonicated and kept at
roomtemperature for the attainment of equilibrium.
pH Determination26:The pH of nitrendipine was
determined using potentiometer for freshly prepared
T Mangilal et al. Volume 3 (3), 2015, Page-708-719
711 Physical appearance27:Colour, surface texture and
clarity of transdermal patches were physically
examined.
Drug–Excipient Compatibility study28: FTIR spectra
of the pure drug (nitrendipine) and polymer mixer was
used to study the drug-polymer interactions in the
formulation. A drug-polymer mixture was mixed with
KBr (100:1) to prepare a sample pellet. Initially, the
base line correction was taken using KBr powder.
IRspectra of the mixture was taken at wave number
range of 4000-400 cm-1.
Thickness uniformity29:The patche thickness was
measured using a Absolute Digimetic at three different
places.
Uniformity of weight30:The patch of size 1x1 cm
weight of the patch was cut and weight of each patch
was taken individually and the average weight of the
patch was calculated.
Percentage moisture uptake:The patches were
weighed accurately and placed in a desiccator where
humidity condition of 80-90% RH was maintained by
using saturated solution of potassium chloride. After
gaining the uniform weight, the patches were then
taken out and weighed. Finally, the percentage of
moisture uptake was calculated as the difference
between final and initial weight with respect to initial
weight.
Water vapour transmission (WVT) rate:In this
study, transmission cells of equal diameter were used.
These cells were washed thoroughly and dried in an
oven. Accurately weighed 1 g of fused calcium
chloride was taken in cells and the polymeric patches
measuring 1 cm. then, the cells were kept in a closed
desiccator containing saturated solution of potassium
chloride to maintain 80-90% RH. The cells were taken
out and weighed after 24 hrs. The rate of water vapour
transmitted was calculated by the difference in weight.
Folding endurance31: The prepared films were
measured manually by the folding endurance. A strip
of film (2x2 cm) was taken and folded repeatedly at the
same place till it was broken. Count the number of
times the film was folded without breaking which gave
the exact value of folding endurance.
Tensile strength31: The prepared patches (4 x 1 cm2)
were pulled by a pulley system, in which weights were
slowly added to the pan till the patch was broken. The
breakage of patch was due to excessive pulling force
applied on the patch. The distance travelled by the
pointer was noted. Finally, the tensile strength was
caliculated by following formula.
Tensile strength = Tensile load at breat / Cross
sectional area
Drug content uniformity:The patches were tested for
the content uniformity. The patches of size 1 cm
placed in a 100 ml volumetric flask containing pH 7.4
phosphate buffer. All suspended patches were stirred
using a magnetic bead for 24 hrs to dissolve the
patches. Further dilutions were made with phosphate
buffer (pH 7.4). Finally, the observance of dilutions
was measured at 209nm using UV-visible
spectrophotometer.
In-vitro release studies: The fabricated patch were cut
into 1cm2and placed on the semi permeable membrane
(Egg membrane) and attached to the diffusion cell such
that the cell’s drug releasing surface towards the
receptor compartment which was filled with phosphate
buffer solution of pH 7.4 at 37±10c. The elution
medium was stirred magnetically. The aliquots (1ml)
was withdrawn at predetermined time intervals and
replaced with same volume of pH 7.4 phosphate buffer.
The drug content of sample was analysed using
UV-spectrophotometer at 225nm.
Drug Release kinetics32
Zero order release rate kinetics: The obtained linear
T Mangilal et al. Volume 3 (3), 2015, Page-708-719 versus time (x-axis) indicates that the release rate data
is fitted to the following equation
F = Kt
Where ‘F’ is the fraction of drug release, ‘K’ is the
release rate constant and‘t’ is the release time.
It obeys Zero-order release kinetics, with a slope equal
to K.
First order release rate kinetics: The release rate date
is fitted to the following equation
Log (100-F) = kt
If the plot (log % drug release Vs time) is linear that
means it obeys first order release rate kinetics.
Higuchi release model:
The release rate data is fitted to the following equation
F = K.t ½
Where, ‘K’ is the release rate constant, ‘F’ is the
amount of drug release, and ‘t’ is the release time.
If the plot (cumulative drug released Vs square root of
time) is straight line that indicates the drug release
follows diffusion mechanism. And the slope is equals
to ‘K’.
Korsmeyer- Peppas release model: Mt / M∞ = K.tn
Where, ‘K’ isthe release constant,Mt / M∞ is the
fraction of drug release, ‘t’ is the release time and ‘n’ is
the diffusional exponent for the drug release that
dependent on the shape of the matrix dosage form.if
the plot (Log of released Vs Log time)gives a straight
line, indicating that the slope is equals to ‘n’ and the
‘K’ can be obtained from Y–intercept.
3. RESULTS
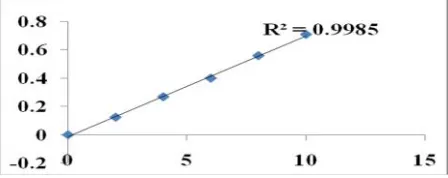
Table 2: Calibration curve of Nitrendipine in pH7.4 phosphate buffer solution
Concentration Absorbance at 225nm
0 0
2 0.124
4 0.268
6 0.399
8 0.558
10 0.708
Fig.1: Standard plot of Nitrendipine in phosphate buffer solution (pH 7.4) at 225nm
Table 3: Melting point, solubility, partition coefficient and pH of Nitrendipine
S.No Parameters Value of Parameters
1 MeltingPoint 169±1.15°C
2 Solubility 21.4mg/ml
3 Partitioncoefficient 10.38
4 pH 3.46
Fig 2: IR spectrum of Nitrendipine pure
Fig 3: IR Spectrum of Glycerin
T Mangilal et al. Volume 3 (3), 2015, Page-708-719
713
Fig 5: IRspectrum of nitrendipine, HPMC K-15 and eudragit RS100 mixture
Fig 6: Transdermal patch with HPMC_k15 polymer
Table4: Thickness uniformity data of F1 to F16 formulations Formulation code Trial1
mm
Trial2 mm
Trial3 mm
Mean±S.D.* mm
F1 0.22 0.2 0.21 0.21±0.001
F2 0.19 0.195 0.194 0.19±0.0052
F3 0.164 0.167 0.162 0.16±0.002
F4 0.18 0.18 0.18 0.18±0.000
F5 0.19 0.195 0.199 0.19±0.031
F6 0.18 0.19 0.18 0.183±0.0057
F7 0.19 0.195 0.194 0.190±0.0052
F8 0.19 0.19 0.19 0.192±0.000
F9 0.17 0.18 0.17 0.173±0.005
F10 0.19 0.18 0.19 0.186±0.005
F11 0.15 0.11 0.11 0.136±0.004
F12 0.19 0.17 0.14 0.143±0.003
F13 0.14 0.16 0.16 0.148±0.005
F14 0.14 0.17 0.11 0.142±0.004
F15 0.11 0.16 0.12 0.153±0.005
F16 0.16 0.14 0.17 0.163±0.002
S.D*:Standard deviation of three determinations
Table 5: Weight uniformity data of F1 to F16 formulations
Formulation code
Trial1 Trial2 Trial3 Mean±S.D.*
F1 0.051 0.052 0.053 0.052±0.0012 F2 0.030 0.032 0.031 0.032±0.004 F3 0.041 0.042 0.043 0.041±0.021 F4 0.034 0.034 0.032 0.033±0.016 F5 0.035 0.032 0.034 0.046±0.0015
F6 0.034 0.032 0.033 0.030±0.001 F7 0.053 0.052 0.054 0.054±0.0012
F8 0.035 0.033 0.033 0.036±0.0016 F9 0.023 0.020 0.021 0.0213±0.0015 F10 0.042 0.044 0.042 0.0426±.0011 F11 0.042 0.044 0.041 0.0442±.0017 F12 0.041 0.041 0.043 0.0435±.0014 F13 0.043 0.043 0.041 0.0412±.0016 F14 0.045 0.044 0.046 0.0456±.0011 F15 0.024 0.045 0.048 0.0436±.0014 F16 0.012 0.041 0.041 0.0416±.0012 S.D*:Standard deviation of three determinations
Table 6: Tensile strength data of F1 to F16 formulations Formulation
code
Trial1 Trial2 Trial3 Tensilestrength (Kg+S.D.) F1 2.215 2.212 2.216 2.20 ± 0.091 F2 2.158 2.152 2.150 2.15 ± 0.077 F3 1.589 1.587 1.582 1.58 ± 0.052
F4 1.475 1.471 1.473 1.47±0.05
F5 1.315 1.316 1.313 1.31 ± 0.311
F6 0.834 0.837 0.832 0.83±0.047
F7 0.562 0.561 0.564 0.56 ± 0.014 F8 0.661 0.664 0.667 0.66 ± 0.208 F9 0.318 0.317 0.314 0.31± 0.038 F10 0.130 0.135 0.132 0.13 ± 0.021 F11 0.122 0.142 0.142 0.11 ± 0.011 F12 0.136 0.141 0.135 0.11 ± 0.031 F13 0.146 0.136 0.112 0.12 ± 0.42 F14 0.145 0.121 0.145 0.14 ± 0.124 F15 0.110 0.112 0.175 0.11 ± 0.011 F16 0.120 0.126 0.125 0.12 ± 0.001 S.D*:Standard deviation of three determinations
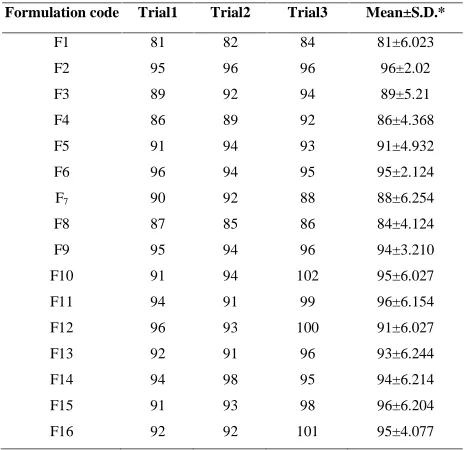
Table 7: Folding endurance data of F1 to F16 formulations Formulation code Trial1 Trial2 Trial3 Mean±S.D.*
F1 81 82 84 81±6.023
F2 95 96 96 96±2.02
F3 89 92 94 89±5.21
F4 86 89 92 86±4.368
F5 91 94 93 91±4.932
F6 96 94 95 95±2.124
F7 90 92 88 88±6.254
F8 87 85 86 84±4.124
F9 95 94 96 94±3.210
F10 91 94 102 95±6.027
F11 94 91 99 96±6.154
F12 96 93 100 91±6.027
F13 92 91 96 93±6.244
F14 94 98 95 94±6.214
F15 91 93 98 96±6.204
F16 92 92 101 95±4.077
S.D*:Standard deviation of three determinations
T Mangilal et al. Volume 3 (3), 2015, Page-708-719 Formulation code Trial1 (%)
% Trial2 (%) % Trial3 (%) % Mean±S.D* %
F1 1.28 1.27 1.28 1.29±0.21
F2 1.57 1.54 1.55 1.58±0.363
F3 1.64 1.62 1.64 1.64±0.542
F4 1.72 1.68 1.70 1.68±0.124
F5 1.74 1.72 1.70 1.72±0.952
F6 1.61 1.66 1.62 1.66±4.124
F7 1.69 1.74 1.72 1.71±0.247
F8 1.83 1.82 1.84 1.83±0.12
F9 1.90 1.91 1.92 1.92±0.134
F10 1.95 1.94 1.94 1.96±0.17
F11 1.90 1.91 1.92 1.92±0.134
F12 1.42 1.42 1.89 1.93±0.169
F13 1.84 1.53 1.91 1.91±0.158
F14 1.77 1.87 1.92 1.89±0.175
F15 1.87 1.75 1.88 1.88±0.145
F16 1.91 1.91 1.86 1.92±0.112
S.D*: Standard deviation of three determinations 1.952
Table 9: Water vapour transmission rate data of F1 to F16 formulations Formulation code Trial 1 Trial 2 Trial 3 Mean ±S.D.* F1 0.058 0.057 0.0079 0.0061±0.018 F2 0.0072 0.0083 0.0063 0.0072±0.001 F3 0.050 0.062 0.072 0.062±0.0012 F4 0.0063 0.0075 0.0075 0.0071±0.0006 F5 0.0063 0.0046 0.0072 0.006±0.001 F6 0.0061 0.0062 0.0063 0.0062±0.001 F7 0.066 0.0063 0.0066 0.0065±0.0002 F8 0.007 0.0068 0.0081 0.0071±0.0012 F9 0.0057 0.0075 0.008 0.007±0.0012 F10 0.0049 0.0077 0.0083 0.0069±0.0018 F11 0.0048 0.0071 0.0075 0.0068±0.0018 F12 0.0047 0.0065 0.0071 0.0075±0.0018 F13 0.0049 0.0077 0.0083 0.0069±0.0018 F14 0.0048 0.0071 0.0075 0.0068±0.0018 F15 0.0041 0.0074 0.0074 0.0078±0.0018 F16 0.0044 0.0075 0.0074 0.0054±0.0018 S.D*: Standard deviation of three determinations
Table 10: Percentage Drug content data of F1 to F16 formulations Formulation
Code
Trial1 % Trial2 % Trial3 % %
F1 98 99.31 99.29 99.34
F2 99.6 99.67 99.69 99.68
F3 99.7 99.78 99.80 99.78
F4 99.92 99.94 99.93 99.95
F5 99.86 99.85 99.86 99.86
F6 99.54 99.60 99.64 99.65
F7 99.34 99.32 99.34 99.34
F8 99.963 99.96 99.0 99.96
F9 99.42 99.46 99.42 99.45
F10 99.84 99.82 99.85 99.82
F11 99.84 99.82 99.85 99.82
F12 99.84 99.82 99.85 99.82
F13 99.84 99.82 99.85 99.82
F14 99.84 99.82 99.85 99.82
F15 99.84 99.82 99.85 99.82
F16 99.84 99.82 99.85 99.82
S.D*: Standard deviation of three determinations
Fig 7: Zero order release kinetic profile for F1-F5 formulation
Fig 8: Higuchi release kinetic profile of F6-F10 formulation
Fig 9: First order release kinetic profile of F11-F16 formulation
T Mangilal et al. Volume 3 (3), 2015, Page-708-719 715 0.002 F7 0.9903±0. 004 0.857 3± 0.9896±0. 005 0.9894±0.00 7 0.7872±0. 030 0.027 F8 0.8483±0. 004 0.987 0± 0.9767±0. 001 0.9873±0.00 2 0.5855±0. 003 0.004
F9 0.8789±0.124 0.9657± 0.9830±0.002 0.9920±0.001 0.6105±0.029 0.013
F10 0.8787±0.005 0.9864± 0.9840±0.008 0.9768±0.002 0.6184±0.0 0.002
F11 0.8963±0.001 0.9721± 0.9821±0.001 0.9735±0.001 0.6184±0.012 0.003 F12 0.8571±0. 007 0.986 4± 0.9840±0. 006 0.9825±0.00 5 0.6184±0. 023 0.007 F13 0.9235±0. 006 0.923 9± 0.9840±0. 003 0.9044±0.00 5 0.6184±0. 021 0.003 F14 0.8852±0. 005 0.986 4± 0.9840±0. 007 0.9932±0.00 3 0.6184±0. 058 0.002 F15 0.9239±0. 003 0.986 4± 0.9840±0. 002 0.9094±0.00 6 0.6814±0. 035 0.004 F16 0.8284±0. 002 0.975 6± 0.9392±0. 004 0.9409±0.00 1 0.6481±0. 053 0.003
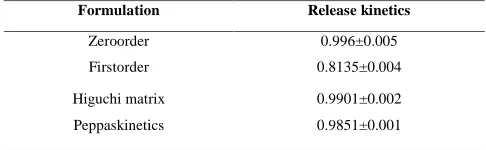
Table 12: model fitting of Formulation F6
Formulation Release kinetics
Zeroorder 0.996±0.005
Firstorder 0.8135±0.004
Higuchi matrix 0.9901±0.002
Peppaskinetics 0.9851±0.001
4. DISCUSSION
Analytical Studies
The λmax of nitrendipine was found to be 209 nm
which is same as that of literature review.
The regression coefficient (r2) of nitrendipine drawn
(fig.1) from calibration plot was 0.998. The
absorbance values at different concentrations of
nitrendipine were shown in table 2.
Preformulation Studies
Melting point of nitrendipine was found to be
150-1600C. This value is same as that of the literature
citation. Nitrendipine is soluble in phosphate buffer
pH 7.4, methanol, chloroform, acetone and ether. But
insoluble in distilled water. Partition coefficient
determination study of nitrendipine was done with
n-octanol and water. The logarithmic value of partition
coefficient (log pKa) of nitrendipine was found to be
3.27, which indicates that nitrendipine is lipophilic in
nature. The pH of freshly prepared 1% aqueous
solution of nitrendipine was found to be 3.46. The
physicochemical characteristics of nitrendipine were
given in table 3.
Drug-excipient compatibility studies: As described in
the methodology section, the FTIR studies were
carried out for pure drug alone and along with
polymers such as HPMC K-15, eudragit RS 100. It
was observed that the identical peak of Nitrendipine
(Fig.2) were not affected with other IR spectral peaks
of polymer as shown in Figures 3, 4 & 5.This indicates
there was no interaction between Nitrendipine and
polymers.
Evaluation of Patches
Physical appearance: The patches were observed to be
smooth and transparent in appearance (Fig.6)
Thickness: The average thickness of patches was
noted with the help of Digital calipers. The thickness
values of patches were given in table 4. These results
indicate that there was no much difference in the
thickness within the formulations. From the results, an
increasing order of the thickness of patches was
observed i.e. F6<F4<F3<F5< F2<
F1<F4<F7<F8<F10< F12< F14<F3<F15<F16<F9
Weight uniformity: Drug loaded patches (1x1 cm2)
were tested for uniformity of weight and the results of
weight uniformity were given in table 5. Lesser S.D.
values indicate that the patches were uniform. From
the results, an increasing order of the thickness of
patches was observed. i.e.
F5<F15<F3<F16<F2<F1<F4<F7<F8<F9< F12<
T Mangilal et al. Volume 3 (3), 2015, Page-708-719 Tensile strength: Tensile strength was determined for
drug-loaded patches by Hounse Field universal testing
machine. The results of tensile strength were given in
the table 6. The tensile strength of patches was
depended on solubility of polymer added in the
formulation. More the solubility of the polymer higher
will be the tensile strength. In present study, the
tensile strength of patches was increased with
increased proportion of HPMC was added. It indicates
that the soluble polymer develops cross linking better
than insoluble polymer. An increasing order of the
tensile strength of patches was observed i.e. F6 <
F14<F12< F5 < F8 < F10<F12 <F3<F6<F5< F4
F1<F11<F7<F9<F2
Folding endurance: The recorded folding endurance of
the patches was shown in table 7. It depicts that all
formulations have good film properties. The order of
the folding endurance of patches was observed i.e. F6
< F3<F4 < F6 < F9 <F1 <F8 <F12<F11< F2 <
F13<F14<F7<F11<F10
Percentage moisture absorption: The recorded
percentage moisture absorption of the patches was
shown in table 8. These results shown that the
moisture absorption of all the patches were within
acceptable limit. An increasing order of the percentage
moisture absorption of the prepared patches were in
following order
F6<F3<F1<F5<F6<F4<F7<F9<F10<F8<
F13<F12<F11<F14<F16<F15
Water vapour transmission rate (WVTR): The water
vapour transmission rate of different formulations was
evaluated and the results were shown in table 9. The
prepared nitrendipine patches from HPMC K-15 alone
and in combination with eudragit RS 100 shown
comparable WVTR of the prepared patches were in
following order
F6<F8<F4<F5<F7<F2<F11<F15<F10< F2 <
F9<F13<F12<F14<F10<F16
Drug content uniformity: Drug content of the patch
was carried out to ascertain that the drug was
uniformly distributed in formulation. The results
obtained were shown in table 10. From the results (i.e.
lowest S.D.values), it was clear that there was a proper
distribution of nitrendipine in the film formulations.
Therefore, it was concluded that the drug was
uniformly distributed in all the formulation.
In-vitro release studies: In vitro release studies of
nitrendipine patches were carried out in diffusion cell
using commercial available semi permeable membrane
and phosphate buffer (pH 7.4) as a diffusion medium.
The release profile data of nitrendipine were given in
table 11 respectively for patches F1to F10. From these
results, it was observed that 97.093 ± 1.71% of drug
was released within 7hrs from F1 and followed
zero-order kinetics. The faster drug release rate is due to the
use of hydrophilic polymer (HPMC K-15) alone. To
sustain the drug release copolymer was added. Hence,
eudragit RS 100 which is hydrophobic in nature was
combined with HPMC K-15 to achieve sustain release
of nitrendipine. The cumulative amount of drug
released at 12 hrs from F2 was found to be 97.37 ±
1.33 %. When compared to F1the drug release from F2
was delayed from 7 hrs to 12 hrs. This effect was due
to the use of copolymer, eudragit RS 100, which acted
as the release-controlling polymer. The sustained drug
release could be achieved by increasing the copolymer
concentration in the formulation by keeping the total
polymer concentration same i.e. 300 mg. In the
formulations F3 to F10, weight of HPMC K-15 was
decreased to 150 mg and eudragit RS 100 was
increased to 150mg. It was found that only 85.53
±2.403 % of nitrendipine was released from F3for 24
hrs. but it lacks complete drug release so it was
necessary to conduct further study to release the
T Mangilal et al. Volume 3 (3), 2015, Page-708-719
717
Review of literature gave an idea of using permeation
enhancer to improve the drug release from the
formulation. In the current study, Oleic acid, DMF and
DMSO were chosen as permeation enhancers used in
formulations F4, F5and F6respectively. Oleic acid was
used in the formulation F4 as a permeation enhancer
and the drug release response from this patch was
found to be 97.626 ± 1.142 %. The result reveals that
oleic acid significantly increased the drug release
when compared to the formulation without permeation
enhancer i.e. F3. DMSO and DMF were the most
popularly used permeation enhancers in the research
work reported for transdermal drug delivery. In the
formulation F5, DMSO was shown 96.37 ± 1.117 % of
drug was released for 24 hrs. In the formulation F6,
DMF was used instead of DMSO as permeation
enhancer and observed the response. It was clearly
indicated that 94.573 ± 0.534 % of the nitrendipine
was released for 24hrs. The patch containing oleic acid
emerges as a better formulation. Because it shows
maximum drug release by comparing all the patches
which are sustained for 24 hrs.
The drug release kinetics was evaluated by making use
of first order, zero order, korsemeyer-peppas equation
and Higuchi’s diffusion. Based on the higher
regression values (r2), the best fit model for F1and F2
formulations was zero-order. Whereas, first order
release for F3, F4, F5, F7, F8, F9, F10, F11, F12, F15 and
F16 Formulations. In addition, the release kinetics was
following the diffusion controlled mechanism. The
drug release kinetics of nitrendipine from all
formulations (F1-F16) were shown in figure 7, 8 and 9.
Release kinetic profile of nitrendipine TDDS for zero
order, first order, peppas and Higuchi respectively.
The peppas model is widely used when the release
mechanismis not well known or when more than one
type of release phenomenon could be involved.
Formulation F6 follows higuchi release and shows
(Table 12) best drug release than other formulations.
5. CONCLUSION
The aim of the present study was to formulate
transdermal patch of anti-hypertensive drug
Nitrendipine using polymers HPMC K-4 and K-15,
Propylene glycol (permeation enhancer) with
Dibutylpthalate (plasticizer) by solvent evaporation
method. From the preformulation studies such as
solubility, melting point, pH, partition coefficient and
absorbance maxima, it was confirmed that the drug
was pure and not degraded. The compatibility between
drug and polymer was studied by FTIR studies. The
result shows that there was no significant interaction
between drug and polymer was observed.
Physicochemical parameters weight uniformity,
thickness, tensile strength, folding endurance,
percentage moisture uptake, percentage moisture loss,
drug content and skin irritation study were carried out
in order to know the pattern of release of nitrendipine
from patches. In vitro release studies were formed
with Franz diffusion cell using pH 7.4 phosphate
buffer solution in a receptor compartment.
From the results of the drug content determination, it
was assured that there was uniform distribution of
drug in the patches and the deviations were within the
acceptable limits. Among all the prepared
formulations, F6 containing HPMC K-15 (500mg)
showed better drug release of 99.62 at 48hrs. the best
formulation F6 is being compared with
anti-hypertensive drug clonidine (centrally acting
alpha-agonist) catapress patch. The formulation F6 showed
better drug release than clonidine patch. On the basis
of in-vitro characterization, it was concluded that
Nitrendipine could be administered as transdermal
patch.
The obtained best formulation of in-vitro studies are
T Mangilal et al. Volume 3 (3), 2015, Page-708-719 is to establish the therapeutic utility of this system by
pharmacokinetics and pharmacodynamic studies on
humanbeings.
6. REFERENCES
1. R.PnannerSelvam, Anoop Kumar Singh, T.
Sivakumar, Transdermal drug delivery systems
for antihypertensive drugs - A review, Int J Pharm
Biomed Res 2010, 1(1), 1-8.
2. BhaskarK, Krishna Mohan C, Lingam M, Jagan
Mohan S, Venkateswarlu V, MadhusudanRao Y,
Bhaskar K, Anbu J, Ravichandran V.,
Development of SLN and NLC enriched hydrogels
for transdermal delivery of nitrendipine: in vitro
and in vivo characteristics, Drug DevInd Pharm.
2009, 35(1), 98-113.
3. Bhaskar K, Krishna Mohan C, Lingam M,
Prabhakar Reddy V, Venkateswarlu V,
MadhusudanRao Y, Development of nitrendipine
controlled release formulations based on SLN and
NLC for topical delivery: in vitro and ex vivo
characterization, Drug DevInd Pharm. 2008,
34(7), 719-725.
4. Gannu, R., Vamshi, Y.V., Kishan V., Rao, Y.M.:
(2007) Development of Nitrendipine transdermal
Patches: In vitro and Ex vivo Characterization.
Current Drug Delivery, 4, 69-76.
5. Patel et al. Formulation and evaluation of
transdermal patch of Aceclofenac.International
Journal of Drug Delivery.2009; 1: 41‐51.
6. Rathore R P S, Chauhan C S, Naruka P S, Tanwar
Y S, Chauhan LS. Transdermal Formulation of
TerbutalineSulphate.Pharmacy online. 2006.
7. Mukherjee et al. Comparative studies between
Povidone‐Ethyl cellulose and Povidone‐Eudragit
Transdermal Dexamethasonematrix patches. Eur J
Pharm Biopharm 2005;59: 475‐83.
8. Aggarwal S S, MunjalPriya. Permeation Studies of
Atenolol and Metoprolol Tartrate from Three
Different Matrices forTransdermal Delivery.
Indian J. Pharm. Sci. 2007; 69(4): 535‐539.
9. Satturwar P M, Fulzele S V,Dorle A K. Evaluation
of Polymerized Rosin for the Formulation and
Development of Transdermal Drug Delivery
System: A Technical Note. AAPS
PharmSciTech.2005; 6 (4): E649‐E654.
10. Karen, L.G.; Eugene, M.S. Drugs 1987, 33,
123-155.
11. Kann J, Krol GJ, Raemsh KD, Burkholder DE,
Levitt MJ.J. Cardiovasc. Pharmacol.1984; 6:
968-973.
12. Ruan LP.; Liang, B.W.; Tao, J.Z.; Yim, C.H. J.
Controll. Rel.1992, 20, 231-236.
13. Minghetti, P.; Cilurzo, F.; Montanari,L. Drug Dev.
Ind. Pharm.1999, 25, 1-6.
14. Gannu, R., Vamshi, V.Y., Kishan, V.,
Madhusudan R.Y., Current DrugDelivery, 2007, 4,
69-76.
15. Aqil M, Ali A, Sultana Y, Najmi AK. Fabrication
and evaluation of polymeric films for transdermal
delivery of pinacidil.Pharmazie 2004; 59(8):
631-635.
16. ShindeAJ,GaralaKC,MoreHN.Developmentandch
aracterizationoftransdermal therapeutics system of
tramadol hydrochloride.AsianJPharm2008, 2,
265-269.
17. DasMK, BhattacharyaA, GhosalSK.
Transdermal delivery of trazodon ehydrochloride
from acrylic films prepared from aqueous
latex.Indian J Pharm Sci 2006; 68(1):41-46.
18. A.Mittal, U. V.S. Sara, A. Asgar and M. Aqil, The
effect of penetration enhancers on permeation
kinetics of nitrendipine in two different skin
models, Biol. Pharm. Bull. 31 (2008) 1766–1772;
T Mangilal et al. Volume 3 (3), 2015, Page-708-719
719
19. Aggarwal G. Development, Fabrication and
Evaluation of Transdermal Drug Delivery‐A
Review. Pharmainfo.net. 2009
20. Kumar JA, Pullakandam N, Prabu SL,
GopalV.Transdermal drug delivery system: an
overview.Int. J. Pharm. Sci. Rev. and Res. 2010;
3(2): 49-54.
21. Barhate SD, Bavaskar KR, Saoji YS,
PotdarM,Gholap TN. Development of
Transdermal drugdelivery system of Ketoprofen.
Int. J. Parma.Res. Develop. 2009; 1(10): 1-7.
22. Keleb E, Sharma RK, Mosa EB,
AljahwiAZ.Transdermal Drug Delivery
System-Design andEvaluation. Int. J. Adv. Pharm. Sci.
2010;1:201-211.
23. Kumar SR, Jain A, Nayak S. Development and
Evaluation of Transdermal patches of
Colchicine.Der Pharmacia Lettre. 2012, 4
(1):330-343.
24. Diez, H. Colom, J. Moreno, R. Obach, C. Peraire,
J. Domenech, A comparative in vitro study of
transdermal absorption of a series of calcium
channel antagonists, J Pharm Sci. 1991, 80 (10),
931-934.
25. Shiva kumar VG, Mulla JS, Vinay BL.
Formulation, characterization and evaluation of
matrix-type transdermal patches of a model
antihypertensive drug. Asian J Pharm 2009; 3:
59-64.
26. Meier P, Maillard M and Burnier.M. The future of
angiotensin II inhibition in cardivascular
medicine. Curr Drug Targets-Cardiovas & Haemat
Dis 2005,5(1), 15-30.
27. Morgan TM, Reed BI, Finnin BC. Metered-Dose
Transdermal Spray. In: Rathbone MJ, Hadgraft J,
Roberts MS, editors. Modified-Release Drug
Delivery Technology. New York: Marcel Dekker,
Inc: 2002, p. 523-525.
28. K.Shivanand, S.A.Raju, B.Jayka.Mucoadhessive
Bilayered Buccal Tablets of Tizanidine
Hydrochloride. Int. J. Pharm. Tech. Res.2010;
2(3):1861-1869.
29. Patel RP, Patel G, Baria A. Formulation and
evaluation of transdermal patch of aceclofenac.
Int. J Drug Deliv 2009; 1: 41-51.
30. Ubaidulla U, Reddy MVS, Ruckmani K, Ahmad
FJ, Khar RK. Transdermal therapeutica system of
carvedilol: effect of hydrophilic and hydrophobic
matrix on in vitro and in vivo characteristics.
AAPSPharmSci Tech. 2007; 8(1): E13-E20.
31. Kusum Devi V. Saisivam S. (2003) Design and
evaluation of matrix diffusion controlled
transdermal patches of verapamil hydrochloride.
Drug Dev. Ind. pharm; 29: 495-503.
32. Ashu Mittal, Udaivirsinghsara,
Asgarali.Formulation and evaluation of monolithic
matrixpolymer films for transdermal delivery of
nitrendipine. Acta.Pharm. 2009; 59: 383–393.
Conflict of Interest: None