Forex Trading Robot with Technical and Fundamental
Analysis
Luciana Abednego
*, Cecilia Esti Nugraheni, Irvan Rinaldy
Parahyangan Catholic University, Bandung, Indonesia.* Corresponding author. Tel.: +62 811 22 10 705; email: [email protected]
Manuscript submitted May 10, 2018; accepted July 8, 2018. doi: 10.17706/jcp.13.9.1089-1097
Abstract: Nowadays currency trading can be done online through a platform called Meta-Trader4. MetaTrader 4, also known as MT4, is an electronic trading platform widely used by online retail foreign exchange speculative traders. It was devel-oped by MetaQuotes Software and released in 2005. Traders can open market execution (buy or sell) any currency pair just through one mouse click.
Two trading robots that can automate open and close transaction in forex was build in the previous paper [5]. These robots are designed to analyze the market price based on tools and indicators that are provided by MT4. This type of analy-sis is called technical analysis. Experiments show that the profit was not optimal in times of sideways.
The other type of analysis in forex trading is based on forex-related news and events that affect forex trends. News reports, economic data, and political events that come out about a country is used by the robots to gain a decision support. This paper build forex robot that analyze forex market based on fundamental analysis. Fundamental news periodically extracted from a website that provide forex news calendar, www.forexfactory.com. This calendar is used to know the news impact to the market price. The robot decisions to open, close, or hold a po-sition are reinforced by the news impact that are parsed from the website. Exper-iments show that the performance of technical robot is more stable than the fun-damental robot.
Key words: Forex trading, forex robot, metatrader 4.
1.
Introduction
Compare with other investment instrument, online forex trading has become very popular in the past decade because it offers traders several advantages. Forex offers high (even unlimited) return on investment. It can be started with a relatively small amount of capital, but a trader can buy or sell up to 500 times more funds than he actually has. This can be happened when a trader employ leverage. Leverage is an important weapon in the armoury of Forex benefits. This way one can easily gener-ate more substantial gains (or losses) even without having a large capital at disposal. Forex is the most liquid market in the world. There always be a constant supply and demand for money and the market is open 24 hours a day, 5 days a week. This means that traders do not have to adjust schedule for the market opening hours, as the traders can trade all day long, anywhere at anytime.
open market execution (buy or sell) any currency pair just through one mouse click.
In the previous paper [5], two trading robots that can automate open and close transaction in forex was designed to analyze the market price based on tools and indicators that are provided by MT4. Two technical indicators that are used in this paper are Simple Moving Average and Moving Average Convergence Divergence. These robots work based on the crossover of different interval of Simple Moving Average. Experiments show that traders cannot depend only to the technical analysis based on indicators. There is no 100% accurate indicator to predict the market prices and trends. Because of this reason, traders must know the reasons behind the price movement like market sentiment, political events, economic data, world news that affect the market price. This kind of analysis is called fundamental analysis.
This paper build a robot that work based on fundamental analysis to compare its performance with robot in [5] that work based on technical analysis. Fundamental news periodically extracted from a forex website, www.forexfactory.com, to know the news impact to the market price. The robot decisions to open, close, or hold a position are reinforced by the news impact that are parsed from the website.
2.
Forex Analysis
There are two ways to examinate changes in forex market [1], [5]. First is by using charting tools (also known as technical analysis). Second is by using economic or forex related news and events (also known as fundamental analysis). These exami-nation results can then be used by a trader to determine whether to buy or sell a cur-rency pair at any one time.
2.1
Technical Analysis [1]
Technical analysis examine market changes by analyzing signals and then interpret-ing these signals whether to open, close, or modify a buy or a sell trade. There are some chart forms in forex trading. One of the mostly known and used by a trader is candlestick chart.
2.1.1
Candlestick chart
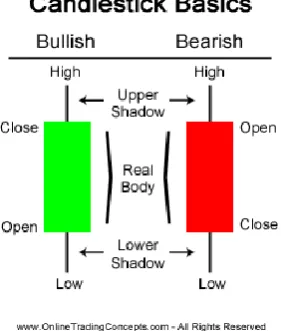
Candlestick chart is a chart that displays price movement in forex trading. Each can-dlestick represents many price information in one time. It represents the highest, the lowest, the opening, and the closing price for a specific period. It can also represents whether the closing price was higher or lower than the opening price. Black/red candle indicates that the price closed lower and the white/green candle indicates that the price closed higher. Fig. 1 shows two candlesticks and informations inside its repre-sentations. The green candle shows that the close price is higher than the open price (also known as a bullish candle). The red candle shows that the close price is lower than the open price (also known as a bearish candle).
2.1.2
Indicators
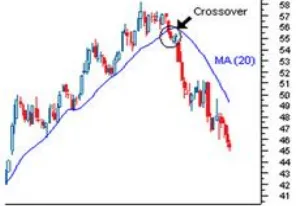
Indicators are some tools in forex that help traders to determine the best time to open a buy or a sell order. A widely used indicator is Simple Moving Average (SMA). This indicator represents the average closing price over a period of time. For example, 20 SMA represents the average of the last twenty closing price. The blue curve in Fig. 2 shows an 20 SMA that cross the candlestick at a point. This crossover can give a reversal trend signal to a trader. In this example, at the point of crossover, there is a reversal trend from bullish (uptrend) to bearish (downtrend).
Fig. 2. Representation and information of a candlestick in forex.
2.2
Fundamental Analysis
2.2.1
Forex related news and events
Fundamental analysis studies the core underlying elements that influence the economy of a particular entity, like a stock or currency. It attempts to predict price action and trends by analyzing economic indicators, government policy, societal and other factors within a business cycle framework.
If the market is a big clock, fundamentals are the gears and springs that move the hands around the face. Anyone can tell what time it is now, but the fundamentalist knows about the inner workings that move the clock's hands towards times (or prices) in the future.
Given the impact these indicators can have on exchange rates, it is important to know beforehand when they are due for release. It is also likely that exchange rate spreads will widen during the time leading up to the release of an important indicator and this could add considerably to the cost of trade.
Therefore, traders should regularly consult an economic calendar which lists the release date and time for each indicator. Economic calendars that is used in this research is parsed from www.forexfactory.com.
Fig. 3. Forex news from forex factory calendar.
2) Currency: currency that is affected by the news.
3) Impact: that gives the information about how big is the new’s influence to the forex price. There are four kinds of legends in this column: red, orange, yellow, and white. Each mean the news has high, medium, and low impact to the forex market price. While white means non-economic news.
4) News title: that is the title of each news. 5) Detail: the detail information of each news.
6) Actual: is what the actual reported value for this time is. There are two kinds of this number’s colour: green and red. Each means good for currency (better than forecast) and vice versa. Some data, such as Non Farm Payroll, are reported in thousands (K), and trade balances and what not are in millions (M) or billions (B). The negative value means that the value went down over the period.
7) Forecast: is what the analysts/economists think the value will be this time. 8) Previous: is the value of the data the last time it was released.
9) Chart: is the chart of market price.
2.2.2
Parse fundamental news
Forex Factory calendar is used to know when market-moving news is expected and thereby avoid or prepare for periods of high volatility. In order to do this, JSoup is used to parse the news released get from www.forexfactory.com. These extracted news are then used to support the forex trading robot decisions. Parsing is a process of breaking a data block into smaller chunks by following a set of rules, so that it can be more easily interpreted, managed, or transmitted by a computer [2]. JSoup is a Java library to parse HTML documents. It is an open source project distributed under the liberal MIT license. The result of extraction prosess is in the form of *.csv files which then be used by the robot to make such a decision. Fig. 4 shows an example of this *.csv file format. Each row of this extracted information represents each news from the forex news website. At each row, there are seven informations, separated by a semicolon in between. The first represents the news’ title. The second represents the currency that affected by the news. The third is the date when this news arise. The fourth explain the affect of this news to the currency movement (high/medium/low impact). The next three is the actual, forecast and previous value.
Fig. 4. The extraction result from forex news website.
3.
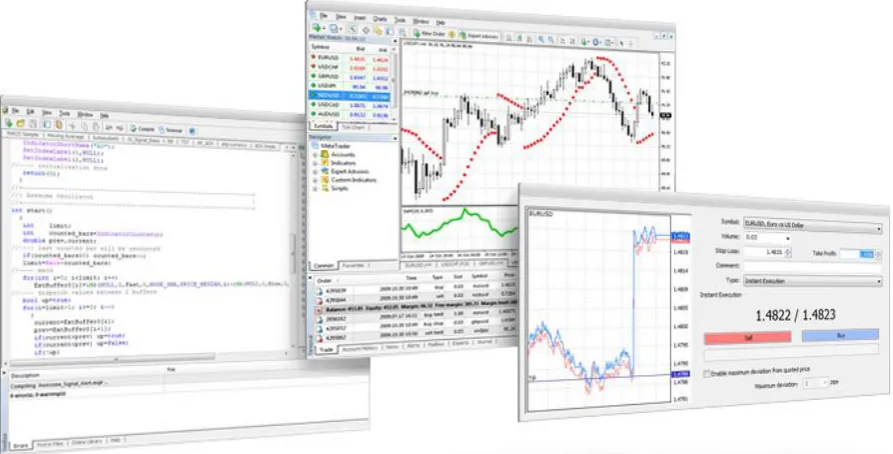
MetaTrader 4
Fig. 5. MetaTrader 4 trading terminal.
4.
Automated Forex Trading Robot
Forex trading robot is a computer program that helps determine whether to buy or sell a currency pair at any one time and open this trading position automatically based on a set of forex trading signals. Forex robots are designed to remove the psychologi-cal element of trading, which can be detrimental. Forex trading robot can help the forex trader to test and develop strategies that work. It can trade 24 hours a day and unemotional, logical, ever-vigilant for profitable trades and who executes trades al-most instantly when the opportunity arises and then posts the profit to the robot owner’s account [4].
In this paper one robot that was developed from the previous paper [5] that based on the technical analysis is compared with a robot that works based on fun-damental analysis to make a trading decision. Below are the details of technical and fundamental analysis for each robot.
4.1.
Technical Robot
As explained in the previous paper [5], a cross below a moving average can signal the beginning of a downtrend and would likely be used by traders as a signal to close out any existing long positions. Conversely, a cross above a moving average from below may suggest the beginning of a new uptrend.
This technical robot works based on the crossing of Moving Average. This robot uses 50 MA as the fast MA period and 100 MA as the slow MA period. The principle is to keep on buying when the 50 MA is above the 100 MA and conversely, is to keep on selling when 100 MA is above the 50 MA.
This robot uses a trailing stop. It uses loop to modify multiple orders which moves the stop loss up or down with the order price as the order gains in profit. This "locks in" profit and provides excellent loss protection. The trailing stop is expressed as a maximum number of pips. Trailing stop for this robot is set to 50 pips, means the stop loss will never be more than 50 pips away from your price. If the price reverses and the profit declines, the stop loss will stay where it is. The stop only moves in the direc-tion of profit – never in reverse.
Robot’s rules for open buy position:
1. Once the price has broken below the closest SMA by 10 pips or more. 2. Exit trade when the price breaks above the 50 SMA by 10 pips.
4.2.
Fundamental Robot
In this research, the algorithm of the trading robot works based only on fundamental analysis. This robot analyze news from a news website (www. forexfactory.com). This robot use the news to gauge market sentiment that will move the market price. News influences people’s bullish or bearish sentiment on a particular market, which in turn creates volatility as those people buy and sell.
This robot consider only the high impact news, which is label as a red legend in forex factory website. The reason of this choice is because the low-impact news are likely to cause increased volatility which in turn results minimum or in fact negative profit.
This robot doesn’t understand the outcome of these news event but rather the way a market reacts based on the outcome. The way a market behaves following a significant event can be telling as to whether “the market” is bullish or bearish on that particular currency.
For each high impact news, this robot will see the Actual value five minutes prior the news’ release time. It will compare the Actual, Forecast, and Previous values. If the Forecast is bigger than Previous, it will open a buy order. Otherwise, it will open a sell order.
5.
Experimental Setup and Result
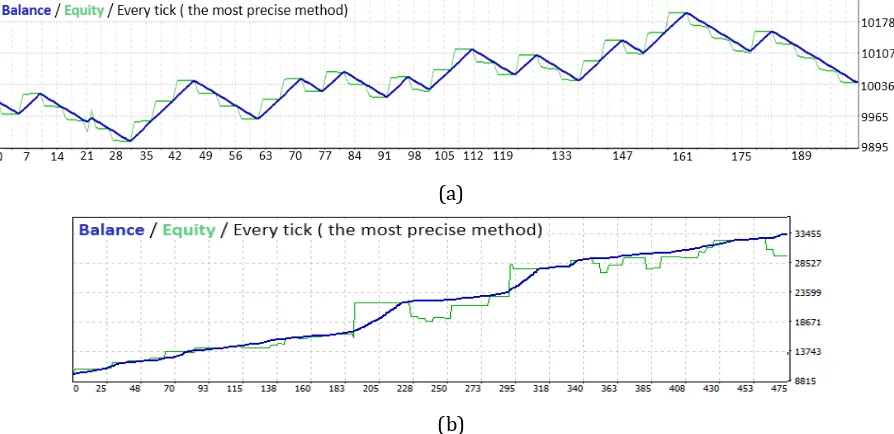
Some experiments were conducted to compare the performance attained by the fundamental robot and the technical robot. To obtained this purpose, three of the most dynamic currency pairs in forex trading were used: EUR/USD, USD/JPY, and GBP/USD. These experiments use backtesting strategy which run the robot against 1 hour - historical price data, means that every candlestick in chart shows opening and closing price every one hour. To do backtest in MetaTrader 4, there is a built-in back tester tool named Strategy Tester. Fig. 6-8 shows the experiment result of fundamental robot versus technical robot in EUR/USD (Fig. 6), USD/JPY (Fig. 7), and GBP/USD (Fig. 8). Each of these figures (Fig. 6 - Fig. 8) consist of 2 figures: Fig. (a) shows the performance of fundamental robot and Fig. (b) shows the performance of technical robot in 1 hour timeframe. The testing duration for all of these experiments is 30 days. The blue and green lines in these figures each show the growth of the account’s balance and equity. The x axis shows the timeline of these experiments, while the y axis shows the account’s balance value.
(a)
(b)
(a)
(b)
Fig. 7. Sampling of performance of fundamental robot (a) and technical robot (b) in USD/JPY, H1.
(a)
(b)
Fig. 8. Sampling of performance of fundamental robot (a) and technical robot (b) in GBP/USD, H1.
From these experiments, as can be seen from Fig. 6 – Fig. 8, the performance charts of technical robot form rising linear curve, while the performance charts of fundamental robot form jagged saw curve. This means that the performance of technical robot is more likely to be stable in profiting compared with fundamental robot. This result match with the reference [3] which state that fundamental strategy is a long term strategy. This means fundamental strategy needs longer period (some years) to profit. These experiments use a short time period of testing (30 days).
6.
Conclusion and Future Work
Experiments show that the performance of technical robot is more robust and stable compare with fundamental robot. The reason is because there are a lot of factors that affect the news, like market’s sentiments, multiple news in one time, countinuos effect of the previous news. This makes fundamental robot can’t depend only on the forecast, previous, and actual value from the news website, but also other factor such as the affect of the previous subsequence news. On the same timeframe, the tech-nical robot result the more profitable balance than fundamental robot. In this re-search, the technical robot makes trading decision based on the statistics of the latest market movement.
The future work for this research is to build a fundamental robot that can manage multiple news in a row. The performance of this robot also can be improved by dy-namically change all the forex trading’s parameters, such as stoploss and take profit. Another technique that can also be done is by using information integration from multiple news resource, because many factors can affect market’s movements.
References
[1] Burgess, G. (2010). Trading and Investing in the Forex Markets Using Chart Techniques. John Wiley & Sons.
[2] Grune, D., & Jacobs, C. J. H. (2008). Parsing Techniques. Springer.
[3] Kritzer, A. (2012). Forex for Beginners: A Comprehensive Guide to Profiting from the Global Currency
Markets. Apress.
[4] Young, A. R. (2010). Expert Advisor Programming: Creating Automated Trading Systems in MQL for
MetaTrader 4. Edgehill Publishing.
[5] Abednego, L., & Nugraheni, C. (2015). Development of Forex robot in MetaTrader 4. Proceedings of
International Congress on Engineering and Information.
[6] Evans, M. D. D., & Lyons, R. K. (2004). Do currency markets absorb news quickly? Journal of
International Money and Finance, 24(2), 197-217.
Luciana Abednego, S.Kom., M.T. was born in Bandung, March 10, 1981. She received magister degree in informatics at Bandung Institute of Technology, Indonesia. Now, she is a full time lecturer at Parahyangan Catholic University. Her publications includes as below:
Sudoku as a Problem Domain in Studying Multiagent Systems. Proceedings of International
Conference on Software Engineering 2016.
On the Development of Hyper- heuristics based Framework for Scheduling Problems in Textile Industry. Proceedings of International Conference on Software Engineering 2016. Development of Forex Robot in MetaTrader 4. Proceedings of International Congress on
Engineering and Information 2015.
rer.nat. Cecilia Esti Nugraheni, S.T., M.T. was born in Solo, November 27, 1969. She received the doctoral degree in informatics at Ludwig-Maxi-milians Universität (University of Munich), Germany in 2014. She received the magister degree in informatics at Bandung Institute of Technology, Indonesia. She is a full time lecturer at Parahyangan Catholic University. Her publications includes:
Sudoku as a Problem Domain in Studying Multiagent Systems. Proceedings of International
On the Development of Hyper- heuristics based Framework for Scheduling Problems in Textile Industry. Proceedings of International Conference on Software Engineering 2016. Development of Forex Robot in MetaTrader 4. Proceedings of International Congress on
Engineering and Information 2015.