Impact Factor- 4.015
I
NTERNATIONAL
J
OURNAL OF
E
NGINEERING
S
CIENCES &
M
ANAGEMENT
COMPRESSION RATIO AND PSNR OF GRAYSCALE IMAGE USING WAVELET
Pappu Kumar*
1& Kumar Rajan
2*1
Lecturer, Government Women’s Polytechnic, Ranchi
2Research Scholar, EEE Department, BIT, Mesra, Ranchi
ABSTRACT
Technology needs to touch every aspect of life, ranging from household appliances to robots for the expedition in space. The development of science and technology grow exponentially. This results in increase of the amount of information managed by computer. This causes serious problems in storage and transmission of image data. Therefore, the need is to consider a way to compress data so that the storage capacity required will be smaller.In this research work, the aim is to know the influence of wavelet to the compression ratio and to the PSNR (Peak Signal to Noise Ratio). Then the compression ratio and PSNR results that were obtained are compared, which has a high compression ratio and PSNR. Waveletused are Daubechies, Coiflet, and Symlet families. Test images used are 8-bit grayscale images of size 512x512. Wavelet which has the highest compression ratio in each family is Haar, Coiflet 1, and Symlet 2. While the wavelet which has the highest PSNR in each family is Haar, Coiflet 3, and Symlet 5. For wavelet which has a compression ratio and PSNR values are optimal for each family are Haar, Coiflet 3, and Symlet 5.
Keywords:Compression, PSNR, compression ratio, wavelet transform
I.
INTRODUCTION
The development of the Internet and multimediatechnologies grows exponentially.This results in the amount of information to be managed by computers [1]. In addition, the useof digital images is growing rapidly. This causes serious problemsin image data storage and transmission. Therefore, the administratorneeds to consider the volume of image data storage capacity and transmission bandwidth [2]. Gibson, et.al [3] warns that digital signal requires more bits per second (bps) in both the storage and delivery, so it results in higher costs.
The concept of graphs and images appear to represent pages of numerical data that need a lot of time to waste. Image data is a combination of information and redundancy, the information is maintained by the data because it contains the meaning and designation data. While the redundancies are part of data that can be reduced, compressed, or eliminated.
Therefore, it is important to consider a way to compress data in order to minimize the storage capacity required. If, at any time,the data are needed the user can just return it to the original size.Although, today the price of storage is also getting cheaper and bigger in size but it will still be more effective if the data sizecan be reduced so that it can save more space for other dataneeded. Besides, in the field of multimedia communications network, if the data is not compressed a large bandwidth and along time are needed to process the transmission of the data [4].
The solution of this problem is to compress data to reduce storage space and transmission time [1]. This proves the importance ofdata compression on large data to be transmitted. For examplea video will save more bandwidth use when the data is already compressed.
Impact Factor- 4.015
II. RELATED WORK
Currently, many applications want a representation of the image with minimal storage [5]. In general, the representation of digital image requires a large memory. The greater the size of a particular image, the greater the memory it needs. On the other hand, most images contain duplicate data. There are two duplicated parts of data in the image. The first is the existence of a pixel that has the same intensity as its neighbouringpixels. These duplicated pixels waste more storage space. The second is that the image contains many repeated sections (regions). These identical sections do not need to be encoded many times to avoid redundancies and, therefore, we need an image compression to minimize the memory requirement in representing a digital image. The general principle used in the process of image compression is to reduce duplication of data within the image so that the memory needed to represent the image is smaller than the original image [5].
Wavelet is a mathematical function that divides the data into different frequency components, and then fits each component witha resolution suitable for its scale [6]. Wavelet is a waveformthat effectively has a duration limit of zero mean value. Some applications that have been successfully realized by utilizing suchwavelet are image data compression, watermarking, edge detection,radar systems, and encoding fingerprints.
Stollnitz et.al [7] says that one of the natures of wavelet is its frequency. In fact, there aremany coefficients in the representation of wavelet with very small or zero value. This characteristic gives the opportunity to performimage data compression. The application of wavelet transform indigital image processing uses the Discrete Wavelet Transform or DWT. Wavelet is a base, the wavelet base is derived from a scalingfunction which properties are assembled from a number of self copies that has been dilated, translated and scaled. This function is derived from the dilation equation, which is considered as the basis of wavelet theory. From the scaling equation of this function a wavelet equations of the first (known as mother wavelet) can be formed as follows:
a
b
x
a
x
(
)
1
ψa,b(·) is obtained by scaling the wavelet at time b and scale a, where ψ(x) represents the wavelet.
Impact Factor- 4.015 LL2 HL2
HL1 LH2 HH2
LH1 HH1
Fig.1 – Wavelet Decomposition
Currently, wavelet applications receive much attention in the research world, one of which functions is to analyze an image. As atechnique of 2-dimensional discrete signal analysis, for example inanalyzing images, wavelet decomposes signal into signal average,details of vertical, horizontal and diagonal at some desired level. In addition, wavelet decomposes the original signal into signals in some frequency bands (called multi-resolution analysis.) Theanalysis can be done by applying the Discrete Wavelet Transform[8] or standard decomposition techniques and non-standard Haarwith wavelet [9, 10]. The feature (signature) image generated by wavelet is taken from a wavelet coefficient at a certain level (3, 4 or 5) and can be transformed to a much smaller than the original image.
Benchmarks in image data compression are the compression ratio and PSNR (Peak Signal to Noise Ratio). The compression ratiois used to measure the ability of data compression by comparingthe size of the image being compressed to the size of the originalimage. The greater the compression ratio means the better the wavelet function. PSNR is one of the parameters that can be used to quantify image quality. PSNR parameter is often used as a benchmark level of similarity between reconstructed image and the original image. Larger PSNR will produce better image quality.
III. METHODOLOGY
The wavelet used in this research is Daubechies family, (Daubechies 1, Daubechies 2, Daubechies 3, Daubechies 4, Daubechies 5), Coiflet families, and Symlet family. The test images used are 8-bit grayscale images, namely Football.bmp, Saturn.bmp and Office_6.bmp with size 512 x 512. The test images can be seen in Fig. 2.
Fig.2 – Test Image: (a) Football (b) Saturn (c) Office_6
Impact Factor- 4.015
IV. RESULTS AND DISCUSSION
One important measurement in image data compression is the compression ratio. The compression ratio is to measure the ability of data compression by comparing the sizes of the image being compressed with the original size. The greater the compression ratio means the better the wave function.
Table 1: Compression Ratio Results (in %) for wavelet and Test Image
Wavelet/Image Football Saturn Office_6
Haar 99.312 99.313 99.312
Db 2 99.237 99.237 99.237
Db 3 99.156 99.156 99.156
Db 4 99.075 99.075 99.075
Db 5 98.987 98.987 98.987
Coiflet 1 99.156 99.156 99.156
Coiflet 2 98.902 98.902 98.902
Coiflet 3 98.682 98.682 98.682
Coiflet 4 98.401 98.401 98.401
Coiflet 5 98.103 98.103 98.103
Symlet 2 99.237 99.237 99.237
Symlet 3 99.156 99.156 99.156
Symlet 4 99.075 99.075 99.075
Symlet 5 98.992 98.987 98.987
Symlet 6 98.902 98.902 98.902
Symlet 7 98.812 98.812 98.812
Symlet 8 98.723 98.723 98.723
The test results of the wavelet influence towards the compression ratio of several test images can be seen in table 1. Based on table 1, it isshown that Haar has the highest compression ratio, Coiflet 1 for family Coiflet, and wavelet Symlet 2 for Symlet family. PSNR is one success measurement in image data compression. PSNR is used to quantify the image quality. The larger PSNR value means the better its wavelet function is, it means the reconstructed image is so much closer to the original image. Table 2 shows the PSNR value in some wavelet and some of the test image
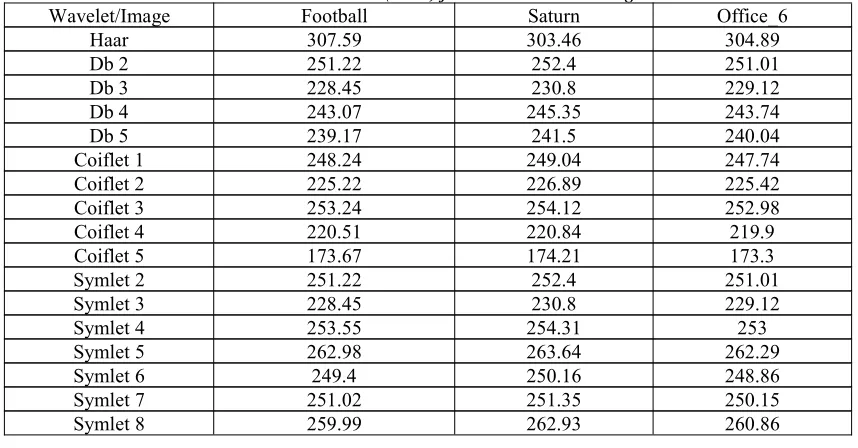
Table 2: PSNR results (in dB) for wavelet and Test Image
Wavelet/Image Football Saturn Office_6
Haar 307.59 303.46 304.89
Db 2 251.22 252.4 251.01
Db 3 228.45 230.8 229.12
Db 4 243.07 245.35 243.74
Db 5 239.17 241.5 240.04
Coiflet 1 248.24 249.04 247.74
Coiflet 2 225.22 226.89 225.42
Coiflet 3 253.24 254.12 252.98
Coiflet 4 220.51 220.84 219.9
Coiflet 5 173.67 174.21 173.3
Symlet 2 251.22 252.4 251.01
Symlet 3 228.45 230.8 229.12
Symlet 4 253.55 254.31 253
Symlet 5 262.98 263.64 262.29
Impact Factor- 4.015
In table 2, it is shown that wavelet Haar has the highest PSNR for the Daubechies family, while Coiflet 3 for Coiflet family, as well Symlet 5 for Symlet family.
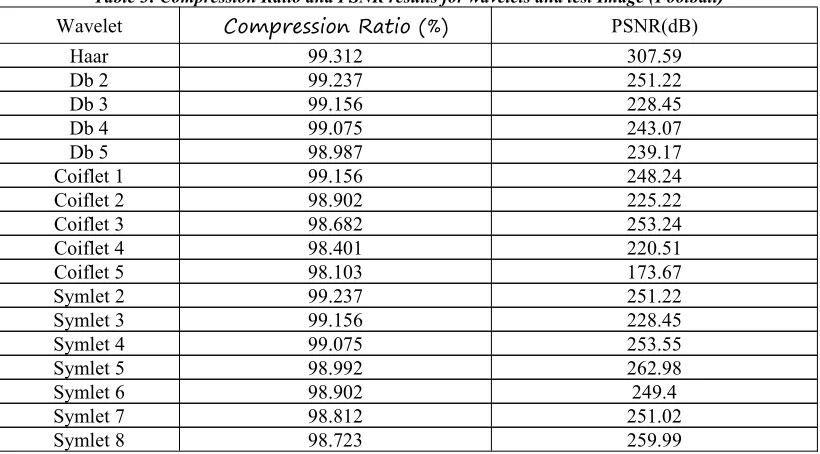
Last section analyzes two aspects of image compression, the compression ratio and PSNR,. The test image used here is football.bmp that is of 512 x 512 grayscale. From the results of this analysis optimum wavelet will be obtained.
Table 3: Compression Ratio and PSNR results for wavelets and test Image (Football)
Wavelet Compression Ratio (%) PSNR(dB)
Haar 99.312 307.59
Db 2 99.237 251.22
Db 3 99.156 228.45
Db 4 99.075 243.07
Db 5 98.987 239.17
Coiflet 1 99.156 248.24
Coiflet 2 98.902 225.22
Coiflet 3 98.682 253.24
Coiflet 4 98.401 220.51
Coiflet 5 98.103 173.67
Symlet 2 99.237 251.22
Symlet 3 99.156 228.45
Symlet 4 99.075 253.55
Symlet 5 98.992 262.98
Symlet 6 98.902 249.4
Symlet 7 98.812 251.02
Symlet 8 98.723 259.99
a. Daubechies family
Based on table 3, it is noticed that wavelet Haar has a good compression ratio and highest PSNR. However, when comparing the two aspects, the three top results are of Haar, Daubechies 2 and Daubechies 4.
b. Coiflet Family
From table 3 it appears that wavelet Coiflet2 has the highest compression ratio, and Coiflet 3 has the highest PSNR. However, when comparing the two aspects, the result is as follows: Coiflet 3, Coiflet 1, and Coiflet 2.
c. Symlet Family
Table 3 shows that wavelet Symlet 5 has the highest PSNRas well as the highest compression ratio. But while comparing the two aspects, the three best results are Symlet 5, Symlet 8, and Symlet 4.
V. CONCLUSION
Based on the results of testing and discussion it can be drawn that Haar gives good results for both compression ratio as well PSNR values. While for coiflet2 giveshighst compression ratio and coiflet 3 shows highest PSNR, coiflet 3 gives the optimal results.
For the symletfamlySymlet 5 gives the highest PSNR value as well as the highest compression ratio. So it is the optimal.
REFERENCES
1) Tan, C.L., "Still Image Compression Using Wavelet Transform", The University of Queeslands, 2001. 2) Talukder, K.,H., dan Harada, K., "Haar Wavelet Based Approach for Image Compression and Quality
Impact Factor- 4.015
3) Gibson, J., D., Berger, T., Lookabaugh, T., Linbergh, D., dan Baker, R.,L., "Digital Compression for Multimedia", Morgan Kaufman Publishers, Inc. San Fransisco, California, 1998.
4) Effelsberg, W., dan Steinmetz, R., "Video Compression Technique", Dpunkverlag for digitaleTechnologie, Muthig GMBH, Jerman, 1998.
5) Munir, R.,. "Pengolahan Citra Digital denganPendekatanAlgoritmik", PenerbitInformatika, Bandung, 2004. 6) Mubarak, R., "Pemampatan Data Citra DenganMenggunakan Transform Gelombang-Singkat", UGM,
Yogyakarta, 2003.
7) Stollnitz, E.J, DeRose, T.D., danSalesin, D.H., "Wavelets For Computer Graphics: Theory and Applications", Morgan Kaufman Publisher, USA, San Fransisco, 1996.
8) Mallat, S, "A Wavelet Tour Of Signal Processing", Academic Press, USA, 1999.
9) Chakrabarti,K., Garofalakis, M., Rastogi, R., dan Shim, K., "Approximate Query Processing Using Wavelet", Proceedings of the 26th VLDB Coference, Cairo, Egypt,
2000.