Comparative Study of Wind Analysis with
Horizontal Irregularities in Multi-Storied
Buildings using STAAD.PRO
Kintali Sai Nanda Kishore K Satya Narasimha Rao
M. Tech Student M. Tech Student
Department of Structural Engineering Department of Civil Engineering Andhra University College of Engineering Andhra University College of Engineering
Dr. Shaik Yajdhani
Assistant Professor
Department of Structural Engineering Andhra University College of Engineering
Abstract
In designing the multi-storied buildings, irregularities in structures are inevitable due to functional requirements of the building.In the present paper horizontally irregular buildings are analyzed for their stability. A multi-storey horizontally irregular building as described in IS 875-1987(Part III) were modelled in Staad.pro. Irregular plans like L-shape, U-shape are considered for study along with Regular Building. Each building is raised 15 storeys height and assessment is done for each shape. Buildings are analyzed for dead loads, live loads and wind loads as described in IS 875-1987(Part I,II,III) respectively. Combinations of loads are taken as per the relevant Indian standard codes. Parameters like bending moment, nodal displacement, storey drift are used for assessment. Results are plotted for beams, columns and structure as a whole for different shapes. Keywords: Horizontal Irregularity, Wind Load, Multistory R/c Buildings, Staadpro
________________________________________________________________________________________________________
I.
I
NTRODUCTIONOver the last two decades, wind engineering has increasingly focused on the modest low rise and high rise structures, since much of the damage and financial loss associated with extreme wind events happens to these minimally engineered buildings like low rise buildings and also huge loss if encountered by the high rise buildings. As some of these model and full scale wind engineering data filters into the design codes and standards, one may expect to see reduced hurricane/cyclone damage. However, when one combines the more rapid increase in population along the world’s tropical coasts with a generally unacceptably low standard of new building construction inspection, it seems quite likely that loss of life, as well as insured and uninsured property losses will continue to be the norm in the foreseeable future. The wind engineering community needs to be more responsible in forcefully transferring our technical knowledge to the designer and builder.
This analysis mainly deals with the study of a Regular, L, and U shaped plan using Staadpro. A 19.64m x 16.88m 15-storeys structure is modelled using Staadpro. The height of each storey is taken as 3m, making total height of the structure 45m. Loads considered are taken in accordance with the IS-875(Part1, Part2), IS-1893(2002) code. Post analysis of the structure, maximum shear forces, bending moments, and maximum storey displacement are computed and then compared for all the analysed cases.
II.
M
ETHOD OF ANALYSISCode-based Procedure for Wind Analysis A.
The basic wind speed for any site shall be obtained from Fig 2.1 and shall be modified to include the following effects to get design wind speed, Vz at any height, Z for the chosen structure: (a) Risk level, (b) Terrain roughness and height of structure, (c) Local topography, and (d) Importance factor for the cyclonic region. It can be mathematically expressed as follows:
V
z = Vb k1 k2 k3 k4, Where,
V
k
3 = topography factor (see 5.3.3), and k
4 = importance factor for the cyclonic region (see 5.3.4).
NOTE: The wind speed may be taken as constant upto a height of 10 m. However, pressures for buildings less than 10m high may be reduced by 20% for stability and design of the framing.
Fig. 1: Risk coefficients for different classes of Structures in Different Wind Speed Zones
III.
M
ODELLING ANDA
NALYSISAn RCC framed structure is basically an assembly of slabs, beams, columns and foundation inter-connected to each other as a unit. The load transfer mechanism in these structures is from slabs to beams, from beams to columns, and then ultimately from columns to the foundation, which in turn passes the load to the soil. In this structural analysis study, we have adopted three cases by assuming different shapes for the same structure, as explained below.
(1). Regular Plan; (2). L-shape Plan; (3). U-shape Plan
Design Parameters: Here the Analysis is being done for G+14 (rigid joint frame) building by computer software using STAAD-Pro.
Design Characteristics: The following design characteristic are considered for Multi-storey rigid jointed plane frames Table - 1
Design Data of RCC Frame Structures:
S.No Particulars Dimension/Size/Value
1 Model G+14
2 Wind Speed 50m/S
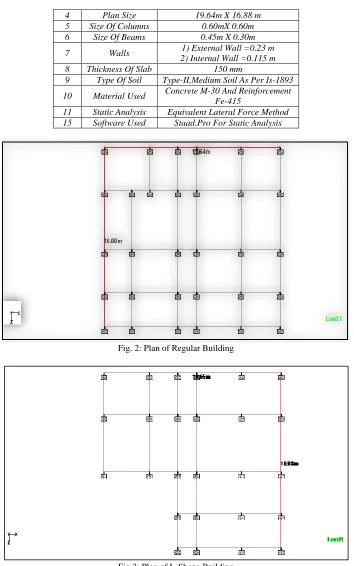
4 Plan Size 19.64m X 16.88 m
5 Size Of Columns 0.60mX 0.60m
6 Size Of Beams 0.45m X 0.30m
7 Walls 1) External Wall =0.23 m
2) Internal Wall =0.115 m
8 Thickness Of Slab 150 mm
9 Type Of Soil Type-II,Medium Soil As Per Is-1893
10 Material Used Concrete M-30 And Reinforcement Fe-415
11 Static Analysis Equivalent Lateral Force Method 15 Software Used Staad.Pro For Static Analysis
Fig. 2: Plan of Regular Building
Fig. 4: Plan of U-Shape Building
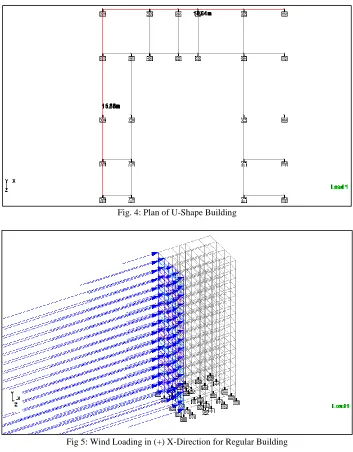
Fig 5: Wind Loading in (+) X-Direction for Regular Building
Fig 7 Wind Loading in (+) X-Direction for U-Shape Building
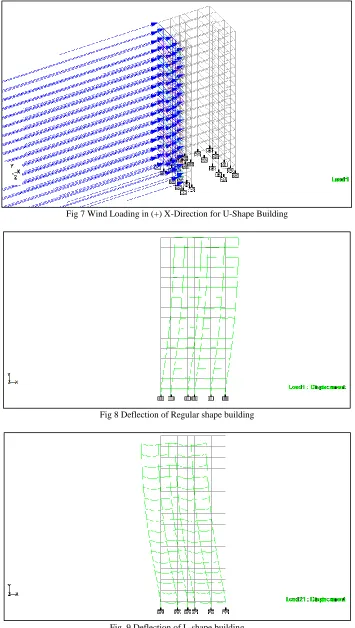
Fig 8 Deflection of Regular shape building
Fig. 10: Deflection of U-shape building
IV.
R
ESULTS AND DISCUSSIONSComparison of Bending Moment in Beams: A.
Table – 2
Comparison of Bending Moment in Beams
Storey Number Regular Building(KN-m) L Shape Building(KN-m) U shape Building (KN-m)
15 57.5 67.6 58.1
14 84.4 97.0 86.1
13 86.2 100.7 90.2
12 87.9 104.0 94.2
11 90.0 107.3 98.2
10 92.1 110.5 102.2
9 94.3 113.5 106.0
8 98.3 116.3 109.6
7 100.1 118.8 113.0
6 101.6 121.0 116.2
5 102.8 122.7 118.9
Fig. 11: Graph 1
Comparison of Bending Moment in Columns: B.
Table – 2
Storey Number Regular Building (KN-m)
L Shape Building (KN-m)
U shape Building (KN-m)
15 40.5 58.4 49.9
14 41.1 60.2 52.9
13 42.1 62.6 55.4
12 44.4 64.9 60.6
11 47.5 66.8 65.0
10 51.5 68.6 67.0
9 53.5 70.2 68.7
8 54.4 71.6 70.2
7 57.2 72.7 71.3
6 58.9 73.3 71.1
5 60.6 72.5 70.1
Fig. 12: Graph 2
Comparison of Bending Moments in Continuous Beams: C.
Table – 3
Comparison of Bending Moments in Continuous Beams: Storey
number
Regular&U-shape Continuous Beam No.
L-shape Building Continuous Beam No.
Regular (KN-m)
L-shape (KN-m)
U-Shape (KN-m)
14 1166-1170 965-969 88.4 96.6 117.7
13 1085-1089 898-902 87.1 97 121.4
12 1004-1008 831-835 86.5 97.7 126.0
5 356-360 295-299 79.2 92.7 146.9
4 275-279 228-232 77.7 90.5 145.3
Fig. 13: Graph 3
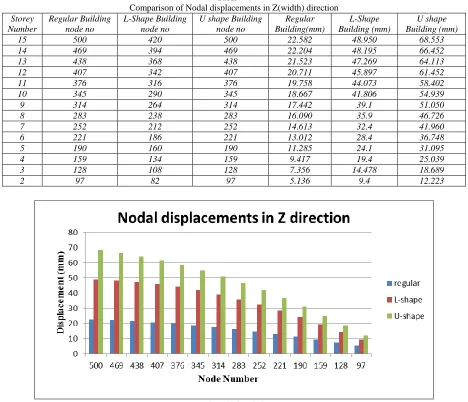
Comparison of Nodal displacements in Z(width) direction D.
Table – 4
Comparison of Nodal displacements in Z(width) direction Storey
Number
Regular Building node no
L-Shape Building node no
U shape Building node no
Regular Building(mm)
L-Shape Building (mm)
U shape Building (mm)
15 500 420 500 22.582 48.950 68.553
14 469 394 469 22.204 48.195 66.452
13 438 368 438 21.523 47.269 64.113
12 407 342 407 20.711 45.897 61.452
11 376 316 376 19.758 44.073 58.402
10 345 290 345 18.667 41.806 54.939
9 314 264 314 17.442 39.1 51.050
8 283 238 283 16.090 35.9 46.726
7 252 212 252 14.613 32.4 41.960
6 221 186 221 13.012 28.4 36.748
5 190 160 190 11.285 24.1 31.095
4 159 134 159 9.417 19.4 25.039
3 128 108 128 7.356 14.478 18.689
2 97 82 97 5.136 9.4 12.223
Comparison of Storey Drift in Z(width) Direction E.
Table – 5
Comparision of Storey Drift in Z(width) Direction Storey Height Regular Building node no L-Shape Building node no
U shape Building node no Regular Building(mm) L-Shape Building (mm) U shape Building (mm)
15 500 420 500 0.378 0.755 2.101
14 469 394 469 0.681 0.926 2.339
13 438 368 438 0.812 1.372 2.661
12 407 342 407 0,953 1.824 3.05
11 376 316 376 1.091 2.267 3.5
10 345 290 345 1.225 2.706 3.9
9 314 264 314 1.352 3.2 4.7
8 283 238 283 1.777 3.5 4.8
7 252 212 252 1.601 4 5.2
6 221 186 221 1.727 4.3 5.7
5 190 160 190 1.868 4.7 6
4 159 134 159 2.061 4.92 6.4
3 128 108 128 2.22 5 6.466
Fig. 15: Graph 5
Column End Forces On Frame 4-A-B: F.
Table – 5
Column End Forces On Frame 4-A-B :
COLUMN L/C Node Shear-Y KN Shear-Z KN Moment-Y KN-m Moment-Z KN-m
C1066 Dead Load 416 0.457 -0.003 -0.025 -0.653
447 -0.457 0.003 0.034 2.025
Wind Loads 416 -13.186 -10.151 14.882 -19.871
447 13.186 10.151 15.572 -19.688
Dead Load+Wind Loads 416 -19.8 -9.95 16.884 -29.836
447 19.8 9.95 12.966 -29.566
C1067 Dead Load 417 2.114 0.267 -0.382 1.904
448 -2.114 -0.267 -0.419 4.437
Wind Loads 417 -20.344 -9.474 13.988 -29.975
448 20.344 9.474 14.435 -31.058
Dead Load+Wind Loads 417 -30.54 -8.893 15.486 -44.996
448 30.54 8.893 11.194 -46.624
C1147 Dead Load 447 0.001 0.009 -0.086 -1.31
478 -0.001 -0.009 0.06 1.313
C1148 Dead Load 448 1.219 0.238 -0.321 0.724
479 -1.219 -0.238 -0.394 2.932
Wind Loads 448 -17.881 -10.549 14.241 -28.853
479 17.881 10.549 17.406 -24.789
Dead Load+Wind Loads 448 -26.842 -11.947 17.65 -43.303
479 26.842 11.947 18.191 -37.223
C1228 Dead Load 478 -1.069 0.155 -0.232 -1.984
509 1.069 -0.155 -0.232 -1.222
Wind Loads 478 -15.621 -10.851 14.877 -18.154
509 15.621 10.851 17.675 -28.709
Dead Load+Wind Loads 478 -23.444 -12.885 19.512 -27.236
509 23.444 12.885 19.143 -43.094
C1229 Dead Load 479 0.586 0.235 -0.246 0.073
510 -0.586 -0.235 -0.458 1.686
Wind Loads 479 -21.612 -12.376 17.899 -23.59
510 21.612 12.376 19.228 -41.246
Dead Load+Wind Loads 479 -32.424 -15.14 24.024 -35.388
510 32.424 15.14 21.395 -61.883
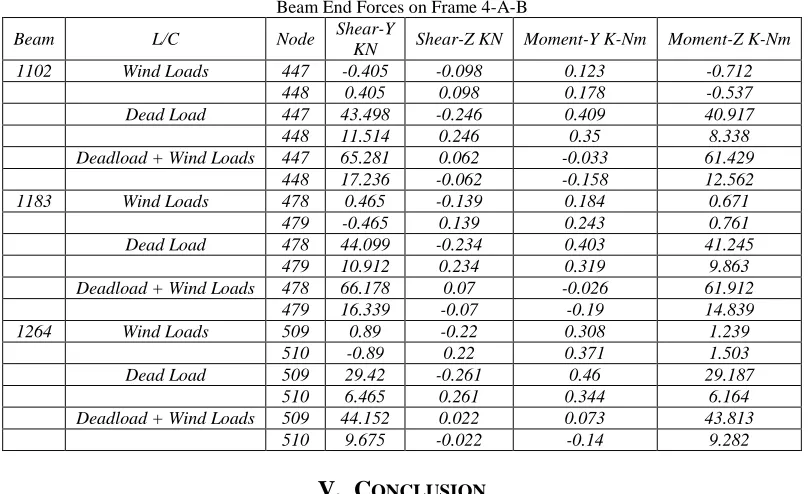
Beam End Forces on Frame 4-A-B: G.
Table – 6
Beam End Forces on Frame 4-A-B
Beam L/C Node Shear-Y
KN Shear-Z KN Moment-Y K-Nm Moment-Z K-Nm
1102 Wind Loads 447 -0.405 -0.098 0.123 -0.712
448 0.405 0.098 0.178 -0.537
Dead Load 447 43.498 -0.246 0.409 40.917
448 11.514 0.246 0.35 8.338
Deadload + Wind Loads 447 65.281 0.062 -0.033 61.429
448 17.236 -0.062 -0.158 12.562
1183 Wind Loads 478 0.465 -0.139 0.184 0.671
479 -0.465 0.139 0.243 0.761
Dead Load 478 44.099 -0.234 0.403 41.245
479 10.912 0.234 0.319 9.863
Deadload + Wind Loads 478 66.178 0.07 -0.026 61.912
479 16.339 -0.07 -0.19 14.839
1264 Wind Loads 509 0.89 -0.22 0.308 1.239
510 -0.89 0.22 0.371 1.503
Dead Load 509 29.42 -0.261 0.46 29.187
510 6.465 0.261 0.344 6.164
Deadload + Wind Loads 509 44.152 0.022 0.073 43.813
510 9.675 -0.022 -0.14 9.282
V.
C
ONCLUSION Bending moments in Beams and columns show a rise in the Regular Shape, L shape, U shape values as the storey height reduces, with L shape having the greatest value.
Bending moments in continuous beams show a rise in u shape building as the storey height is decreased.
Nodal displacements Z directions falls gradually as the storey height is decreased. Displacements in U shape are about 2 times of displacements in Regular Shape building.
Storey drift in Z directions rise gradually as the storey height is decreased. Drift in U shape building rise to more than 4.5 times of Regular Shape building.
As the calculated drift is more than the allowable drift (h/500) due to combination of loads, lateral-load resisting element such as lateral bracings are provided to the RCC structure .
Bending moments in Beams and Columns due to wind forces are observed to have much larger values compared to that due to static loads.
R
EFERENCES[1] Abhay Guleria, “Structural Analysis of a Multi-Storeyed Building using ETABS for different Plan Configurations” International Journal For Engineering
[2] Stefano Pasto “ Equivalent static wind loads on tall buildings,” BBAA VI International Colloquium on: Bluff Bodies Aerodynamics & Applications, Milano, Italy, July, 20–24, 2008.
[3] Swati D.Ambadkar, Vipul S. Bawner,” Behaviour of multi-storeyed building under the effect of wind load”, International Journal Applied Science And
Engineering Research, Vol. 1, Issue 4, 2012.
[4] BIS (1987). ―IS 875 (Part 1,2,3) – 1987 ―Indian Standard code of practice for design loads (other than earthquake) for buildings and structures‖, Bureau
of Indian Standard, New Delhi.