46
PERFORMANCE EVALUATION OF PARTITION BASED
CLUSTERING ALGORITHMS IN GRID ENVIRONMENT
USING DESIGN OF EXPERIMENTS
DEVI PRASAD BHUKYA#1, S RAMACHANDRAM, #2, REETA SONY A L #
College of Engineering, Computer Science Department, Osmania University, Hyderabad, Andhra Pradesh, India
E-mail: {deviprasad,schandram}@osmania.ac.in, [email protected]
ABSTRACT
Clustering is one of the most important research areas in the field of data mining. Clustering means creating groups of objects based on their features in such a way that the objects belonging to the same groups are similar and those belonging to different groups are dissimilar. Here K Means, K Medoids are basic partition based clustering algorithms. One of the disadvantages of using these algorithms its unsuitability for larger data sets. To solve this problem Grid environment has been selected. The main objective of this paper is to implement the partition based clustering algorithms in the Grid environment on Grid Gain middleware and analyze their performance for large datasets with Design of Experiment (DOE) framework. K-means cluster data faster than K-medoids when tested with large data sets and the results are found to be satisfactory.
Keywords— Grid Gain, K-Means, K-Medoids, DOE
.
I. INTRODUCTION
Data Mining [2] (DM) or Knowledge Discovery in Databases (KDD) means searching for valuable information in large volumes of data. Knowledge Discovery in Databases consists of an iterative sequence of the following steps: data selection, data cleaning, data transformation, pattern generation, validation, and visualization. Recently, several KDD systems have been implemented on parallel computing platforms to achieve high performance in the analysis of large data sets that are stored in a single site. However, KDD systems must be able to handle and analyses multi-site data repositories. Clustering can be considered the most important unsupervised learning problem; so, as every other problem of this kind, it deals with finding a structure in a collection of unlabeled data. A loose definition of clustering could be “the process of organizing objects into groups whose members are similar in some way”. A cluster is therefore a collection of objects which are “similar” between them and are “dissimilar” to the objects belonging to other clusters. Unlike classification, in which objects are assigned to predefined classes, clustering does not have any predefined classes. The main advantage of clustering is that interesting patterns and structures can be found directly from very large data sets with little or none of the background knowledge. A number of algorithms for clustering have been proposed by researchers, of which this study
establishes with a comparative study of K-Means and K-Medoids clustering algorithms in Grid Environment.
In next section we discuss K MEANS and K MEDOIDS Algorithms, Section (3) discuss about Grid Environment, section (4) discuss about Design of Experiments, Section (5) presents Experiment and Results and finally (6) presents Conclusion and future work
II. K MEANS AND K MEDOIDS ALGORITHMS
A. K-Means
47 centroids, a new binding has to be done between the same data points and the nearest new centroids. A loop has been generated. As a result of this loop it may notice that the k centroids change their location step by step until no more changes are done.
K-Means algorithm is composed of the following steps:
1. It classifies a given dataset through certain number of clusters (assume k clusters). These points represent initial group centroids.
2. Grouping is done based on the Euclidean's distance.
3. And the centroids are formed on the basis of mean value of that object group.
4. The steps 2 & 3 repeats until the centroids no longer move.
B. K-Medoids
The k-Medoids[6] algorithm is a clustering algorithm related to the k-means algorithm and the medoid shift algorithm. Both the k-means and k-medoids algorithms are partitional (breaking the dataset up into groups) and both attempt to minimize squared error, the distance between points labeled to be in a cluster and a point designated as the center of that cluster. In contrast to the k-means algorithm, k-Medoids chooses data points as centers (Medoids). A medoid can be defined as the object of a cluster, whose average dissimilarity to all the objects in the cluster is minimal i.e. it is a most centrally located point in the given data set.The most common realisation of k-medoid clustering is the Partitioning around Medoids (PAM) algorithm
PAM algorithm is composed of the following steps:
1) It classifies a given dataset through certain number of clusters (assume k clusters). These points represent initial group centroids.
2) Grouping is done based on the Manhattan's distance. 3) Here the centroid is the most centrally located object in a cluster.
4) The steps 2 & 3 repeats until the centroids no longer move.
Partition based clustering methods work in the following manner
Fig1.Work Flow of Partition based cluster algorithms.
III. GRID ENVIRONMENT
Grid computing [1] is applying the resources of many computers in a network to a single problem at the same time-usually to a scientific or technical problem that requires a great number of computer processing cycles or access to large amounts of data.
There are three main issues in Grid computing are: 1) Heterogeneity: a Grid involves a multiplicity of
resources that are heterogeneous in nature and might span numerous administrative domains across a potentially global expanse. As any cluster manager knows, their only truly homogeneous cluster is their first one.
2)Scalability: A Grid might grow from few resources to millions. This raises the problem of potential performance degradation as the size of a Grid increases. Consequently, applications that require a large number of geographically located resources must be designed to be latency tolerant and exploit the locality of accessed resources. Furthermore, increasing scale also involves crossing an increasing number of organizational boundaries, which emphasizes heterogeneity and the need to address authentication and trust issues. Larger scale applications may also result from the composition of other applications, which increases the ‘intellectual complexity’ of systems.
48 can extract the maximum performance from the available resources and services.
Computational grids are sometime mischaracterized as applicable only for calculation/computational tasks. In fact, however, you can just replace word "computational" with word "processing" and you will get a clearer meaning. Word "computational" traditionally stuck with this type of grid computing due to historical context from which grid computing has originated, namely High Performance Computing (HPC) and clustered computing used initially in academic quantitative research. Grid computing appears to be a promising trend for three reasons: (1) its ability to make more cost-effective use of a given amount of computer resources, (2) as a way to solve problems that can't be approached without an enormous amount of computing power, and (3) because it suggests that the resources of many computers can be cooperatively and perhaps synergistically harnessed and managed as a collaboration toward a common objective.
A. Grid Gain Middleware
We choose GridGain as the core of Middleware layer in grid computing platform. GridGain is a Java-based open sourced grid computing infrastructure. It is free and is dual licensed under LGPL and Apache 2.0 licenses. It is built in Java and for Java and embodies the best the modern Java 6 programming model has to offer. GridGain is a state of the art computational grid product. In a nutshell, it allows user to parallelize the execution of the piece of code onto a set of computing resources. Computing resource can be a laptop, desktop computer, workstation, rack-server, mainframe or any other computing device with Java 6 or higher compatible JVM available. Set of computing resources can be homogenous (same kind) or heterogeneous (different kinds), can be generally located locally, within enterprise, globally or any combination of the above. Grid Gain provides virtualization on a different level. It virtualizes a set of potentially very different computing resources by providing consistent and uniform Java programming model for writing software whether it is going to be running on one computer or on the hundreds of them. GridGain is free for one node or for a thousand. Simple and clear. As long as within LGPL license it will cost nothing to use GridGain in almost any way. Compare with Globus Toolkits which is used widely,
GridGain has the following advantages
• It’s easier to install and deploy. This is helpful to focus on the application of the grid technology.
• The most important thing is GridGain can perfectly run on Windows platforms.
Considering the grid nodes use Windows 7 system, using GridGain to build grid computing environment is more reasonable and effective. In addition, Grid Gain also has other advantages: provide enterprise-class support; AOP-based grid support; easy to operate; can perfectly integrate with Spring and JBoss, etc.
B. Development Environment
Development environment and tool layer consist of system software, Java Virtual Machine, Eclipse integrated develop and program software, compile and test software.
• As mentioned above, for the convenience of the research, we use Windows XP as the operational system software.
• GridGain is based on Java platform, running on the Java virtual machine, and also use the JDK compiler, so each node must firstly install the JDK. This paper uses the JDK1.6 Windows version.
• The Eclipse platform is designed for building integrated development environments (IDEs) that can be used to create applications as diverse as web sites, embedded Java programs, we used version 3.2.
C. Architecture of Grid Computing Environment
To setup the grid environment we used five nodes each of the configuration represented in table 1.
TABLE I
SHOWS GRID ENVIRONMENT Operating System Windows 7
Professional
Processor Intel Core2 Duo Main Memory 2GB
Secondary Memory 120GB
49
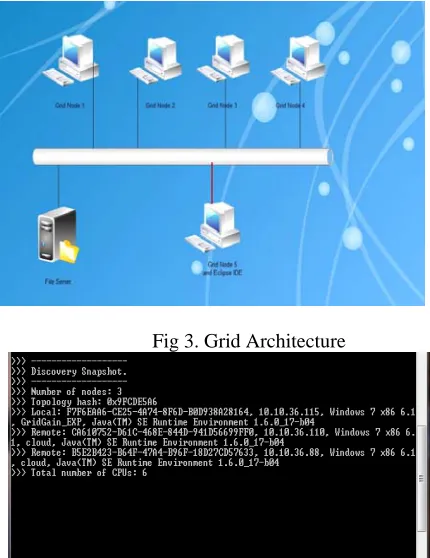
Fig 3. Grid Architecture
Fig 4.Grid Gain Start Message
IV. DESIGN OF EXPERIMENTS
In industry, designed experiments can be used to systematically investigate the process or product variables that influence product quality. After you identify the process conditions and product components that influence product quality, you can direct improvement efforts to enhance a product's manufacturability, reliability, quality, and field performance. For example, you may want to investigate the influence of coating type and furnace temperature on the corrosion resistance of steel bars. You could design an experiment that allows you to collect data at combinations of coatings/temperature, measure corrosion resistance, and then use the findings to adjust manufacturing conditions. Because resources are limited, it is very important to get the most information from each experiment you perform. Well designed experiments can produce significantly more information and often require fewer runs than haphazard or unplanned experiments. In addition, a well-designed experiment will ensure that you can evaluate the effects that you have identified as important. For example, if you believe that there is an interaction between two input variables, be sure to include both variables in your design rather than doing a "one factor at a time" experiment. An interaction
occurs when the effect of one input variable is influenced by the level of another input variable. Designed experiments are often carried out in four phases: planning, screening (also called process characterization), optimization, and verification.
V. EXPERIMENT AND RESULTS
A. Data Set
The data set we used includes data objects each one with six attributes. The sample data is shown in figure 5.
Fig5.Data set
The experiment trails are indicated in table 3, and total runs are 54.The factors considered are indicated in table 2
TABLE 2
FACTORS IN EXPERIMENT Cluster Size Constant(=5) No of Nodes 3 ,4,5
No Of data Objects 50K,100K,200K Algorithms
K-means,K-mediods(PAM)
TABLE 3 EXAMPLE RUNS
Run Algorith DataObjects Nodes
Execution Time
In(MiSec)
1 K means 50000 4 34.187 2 K means 200000 3 125.9 3 K means 50000 4 34.153
4 K
50 mediod
8 K
mediod 100000 5 61.43 9 K means 200000 4 127.87
10 K
mediod 100000 4 61.652 11 K means 200000 4 127.56 12 K means 100000 3 59.64
13 K
mediod 200000 5 131.56 14 K means 50000 3 35.662 15 K means 50000 5 33.967
16 K
mediod 50000 5 31.86 17 K means 50000 5 33.123
18 K means 200000 3
126.60 1
19 K
mediod 100000 4 61.846
20 K
mediod 50000 4 32.394
21 K
mediod 100000 3 60.467
22 K
mediod 50000 4 32.359 23 K means 50000 4 34.991 24 K means 50000 5 33.442
25 K
mediod 50000 3 33.317
26 K
mediod 200000 4 133.45
27 K
mediod 100000 3 60.34 28 K means 100000 3 59.871
29 K
mediod 100000 5 61.57 30 K means 100000 4 59.653
31 K
mediod 100000 3 60.696
32 K
mediod 200000 3 153.47
33 K
mediod 200000 5 131.38
34 K
mediod 50000 5 31.74
35 K
mediod 100000 5 61.96
36 K
mediod 200000 5 131.57 37 K 50000 4 32.784
mediod
38 K means 50000 3 35.255 39 K means 100000 3 59.877
40 K means 200000 5
127.84 3
41 K means 200000 5 126.42
42 K
mediod 50000 3 32.957
43 K means 200000 3
126.28 5
44 K
mediod 200000 3 153.34 45 K means 100000 4 59.707 46 K means 200000 4 128.4
47 K
mediod 200000 4 132.57 48 K means 50000 3 34.261 49 K means 200000 5 127.22
50 K
mediod 50000 5 31.754
51 K
mediod 100000 4 61.744
52 K
mediod 200000 3 154.20 8
53 K means 100000 5 60.42 54 K means 100000 5 60.7
The dataset and trials we used was perfectly normalized as indicated by the residual plots in figure 6 and we continued further analyses.
Residual Pe rc en t 0.5 0.0 -0.5 -1.0 99 90 50 10 1 Fitted Value Re si du al 150 100 50 0.5 0.0 -0.5 -1.0 Residual Fr eq ue nc y 0.8 0.4 0.0 -0.4 -0.8 20 15 10 5 0 Observation Order Re si du al 50 45 40 35 30 25 20 15 10 5 1 0.5 0.0 -0.5 -1.0
Normal Probability Plot of the Residuals Residuals Versus the Fitted Values
Histogram of the Residuals Residuals Versus the Order of the Data
Residual Plots for Execution Time in MiliSeconds
51
B. Main Effects study
The main effects study from figure 7 shows that 1) K means slightly performs better than k
mediods in general in this scenario keeping cluster size and dataset size constant.
2) When we take average case analyses of both algorithms there is steep increase in execution time from 100k to 200k.
3) When we take average performance of both algorithms based on no of nodes there is more decrease in execution time from three to four nodes but no significant decrease in execution time upon addition of one more node.
M e a n o f E xe cu tio n Tim e in M ili S e co n d s K mediod K means 120 100 80 60 40 200000 100000 50000 5 4 3 120 100 80 60 40 Algorith DataObjects Nodes
Main Effects Plot (data means) for Execution Time in MiliSeconds
Fig 7.Main Effects plot
C. Interaction Effects Study
The interaction effects study gives the interaction between different factors, like here in case three different interactions are described which are of interest.
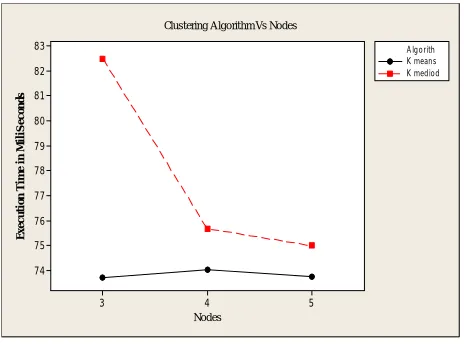
1) Interaction between Execution time and No of nodes for algorithms: When we take the interaction plot between Clustering Algorithm and Number of Nodes. The following can be observed.
• When K-means is considered there is a decrease of 0.424% of performance from three to four nodes but an increase of .388% of performance upon adding one more node.
• When K-mediods is considered there is increase of 8.2626 % of performance from 3 to four nodes but only 0.906% of increase is observed on adding one more node.
Nodes E x ec u tio n T im e in M iliS ec o n d s 5 4 3 83 82 81 80 79 78 77 76 75 74 K means K mediod Algorith Clustering Algorithm Vs Nodes
Fig8. Clustering algorithm Vs Nodes
2) Interaction between Execution time and no
data objects for algorithms:
Dataobjects Ex e cu tio n T im e in M ili S e co n d s 200000 100000 50000 150 125 100 75 50 K means K mediod Algorith Clustering Algorithm Vs DataOnjects
Fig 9. Clustering algorithm Vs Data Objects
When we consider the interaction plot between Execution time and no of data objects the following can be observed.
• When we take no of data objects to be 50000 the k–mediods registers 5.5829% more performance than k –means.
• When we take no of data objects to be 100000 the case is getting reversed the k means registers 2.127% more performance than k-mediods.
52
3) Interaction between Execution time and no of nodes for data objects:
Nodes
E
x
e
c
u
tio
n
T
im
e
in
M
iliS
e
c
o
n
d
s
5 4
3 150
125
100
75
50
50000 100000 200000 DataObjects
DataObjects Vs Nodes
Fig10. Execution time vs. No of nodes for Data Objects
When we take the performance of both algorithms together the following can be observed.
• In the case of 50000 objects upon increase of nodes from three to four there is 2.00931% increase in performance and 2.4801% increase on adding one more node.
• In the case of 100000 objects upon increase of nodes from three to four there is 0.00931% decrease in performance and 0.6256% decrease on adding one more node.
• In the case of 200000 objects upon increase of nodes from three to four there is 6.786% increase in performance and 0.7748% increase on adding one more node.
IV. CONCLUSION
The experiments were conducted on K-means and K-medoids in a grid environment using DOE frame work. Here the K-means algorithm overcomes the problem of clustering larger datasets by using the grid environment and from the figures 6 to 8 we can conclude that means clusters the data faster than K-mediod when given with large data sets and the results are found to be satisfactory. Further experimentation can be done by implementing other clustering algorithms like Fuzzy c-means and Fuzzy K-means in
grid environment and compare their performances with this partition based algorithms.
REFERENCES:
[1] GRID COMPUTING: A Practical Guide to Technology and Applications. Ahmar Abbas. Charles River Media Inc, 2004.
[2] “Data Mining Concepts and Techniques” by Jiawei and Micheline Kamber, University of Illinois at Urbana-Champaign 2000© Morgan Kaufmann Publishers.
[3] YA-PING ZHANG, JI-ZHOU SUN, “PARALLEL IMPLEMENTATION OF CLARANS USING PVM” Proceedings of the Third International Conference on Machine Learning and Cybernetics, Shanghai, 26-29 August 2004.
[4] Zhijie Xu, Laisheng Wang, Jiancheng Luo and Jianqin Zhang , “A Modified Clustering Algorithm for Data Mining”.
[5] Huimin Wang, Guihua Nie and Kui Fu , “Distributed data mining based on semantic web and grid” in 2009 International Conference on Computational Intelligence and Natural Computing. [6] T. Velmurugan, T. Santhanam “Computational
Complexity between K-Means and K-Medoids Clustering Algorithms for Normal and Uniform Distributions of Data Points” at Journal of Computer Science 6 (3), 2010 Science Publications.
[7]Shu-chuhan chu, John F Roddick, Tsong Yi Chen and Jeng Shyang pan“Efficient search Approaches for K-medoids-based Algorithms” at IEEE TENCON’02.
[8] Raju G, Binu Thomas, Sonam Tobgay and Th. Shanta Kumar, “Fuzzy Clustering Methods in Data Mining: A comparative Case Analysis” at 2008 International Conference on Advanced Computer Theory and Engineering.
[9] Devi Prasad Bhukya, Prof. S Ramachandram,“Performance Evaluation of Virtualization and Non Virtualization on Different Workloads using DOE Methodology”, IACSIT International Journal of Engineering and Technology Vol.1,No.5,December,2009.
[10] Ping Luo, Kevin Li, Zhongzhi Shi, Qing He, “Distributed data mining in grid computing environments”.
53 [12] Miroslav N. Velev, Ping Gao, “ Efficient
SAT-Based Techniques for Design of Experiments by Using Static Variable Ordering” , 10th Int'l Symposium on Quality Electronic Design.
[13] Stacy Gleixner, greg young ,linda vanasupa, Yasser dessouky,Emily allen and david parent, “Teaching Design Of Experiments And Statistical Analysis Of Data Through Laboratory Experiments” , 32 nd ASEE/IEEE Frontiers in Education Conference, November 6-9-2002,Boston,MA.
[14] Dean S. Hoskins, Charles J. Colbourn, Douglas C. Montgomery "Software performance testing using covering arrays: efficient screening designs with categorical factors” WOSP '05: Proceedings of the 5th international workshop on Software and performance, July 2005.
[15] Xiang Li, “System Regularities in Design of experiments and Their Application” Phd Thesis ,Massachusetts Institute of Technology,June2006.
http://dspace.mit.edu/bitstream/1721.1/35303/1/756 0345.pdf
[16] David Bauer, Garrett Yaun, Christopher D. Carothers, Murat Yuksel, Shivkumar Kalyanaraman "A case study in meta-simulation design and performance analysis for large-scale networks”Proceedings of the 36th conference on Winter simulation, December 2004.
[17]Minitab Inc, http://www.minitab.com/products/minitab/