http://www.sciencepublishinggroup.com/j/ijee doi: 10.11648/j.ijee.20190403.11
ISSN: 2575-1727 (Print); ISSN: 2575-1735 (Online)
Ecological Assessment for Trace Metal Pollution in a
Freshwater Ecosystem
Ezeonyejiaku Chigozie Damian
1, *, Okoye Charles Obinwanne
2, Ezenwelu Chijioke Obinna
31
Department of Zoology, Nnamdi Azikiwe University Awka, Anambra State, Nigeria
2Department of Zoology & Environmental Biology, University of Nigeria Nsukka, Enugu State, Nigeria 3
Department of Applied Biochemistry, Nnamdi Azikiwe University, Awka, Nigeria
Email address:
*
Corresponding author
To cite this article:
Ezeonyejiaku Chigozie Damian, Okoye Charles Obinwanne, Ezenwelu Chijioke Obinna. Ecological Assessment for Trace Metal Pollution in a Freshwater Ecosystem. International Journal of Ecotoxicology and Ecobiology. Vol. 4, No. 3, 2019, pp. 58-65.
doi: 10.11648/j.ijee.20190403.11
Received: June 25, 2019; Accepted: July 19, 2019; Published: August 6, 2019
Abstract:
Heavy metals in the aquatic environment is of great ecological importance; hence, the study was carried out to evaluate the presence and effects of heavy metals on the water column, fish and sediment composition of Anambra River in July, 2011 and February, 2012 which covered both wet and dry season. The results of the physico- chemical properties showed significant variations (P<0.05) which occurred in DO and conductivity over the sampling seasons on different locations. pH, temperature and salinity showed seasonal difference at P<0.05 in different locations studied. There was no seasonal difference at P>0.05 among the heavy metal concentrations detected in sediment. Post Hoc test also showed no statistical variation (P>0.05) over the five locations: namely Enugu Otu, Ezi - Agulu Otu, Otuocha, Otu Nsugbe and Ukwuibili. There was stable relative non-statistical variations among the heavy metal concentration in the water column but numerical differences demonstrated variability (Otu-Nsugbe > Ezi Agulu Otu > Ukwuibili > Enugu Otu > Otuocha. For the fish species caught both in the rainy and dry season, Clarias gariepinus andMugil cephalus showed higher (P <0.05) concentrations of Zn in dry than rainy season, while Heterotis niloticus showed higher (P<0.05) concentrations of Zn in rainy than dry season. The highest concentrations of heavy metals were detected in the sediment followed by the fish and finally the water column in a decreasing order of concentrations.Keywords:
Heavy Metal, Sediment, Fish, River1. Introduction
Metals are considered very important and highly toxic pollutants affecting various ecosystems. However, ecotoxicologists and environmental scientists use the term “heavy metals” to refer to metals that have caused series of environmental problems [19]. According to Eneji et al. [5], the discharge of industrial wastes containing toxic heavy metals into water bodies may have significant effects on fish and other aquatic organisms, which may endanger public health through consumption of contaminated seafood and irrigated food crops. Heavy metals including both essential and non-essential elements have a particular significance in ecotoxicology, since they are highly persistent and all have
and fishes in Anambra River because of its daily usage by man and exposure to urban pollution.
2. Methods
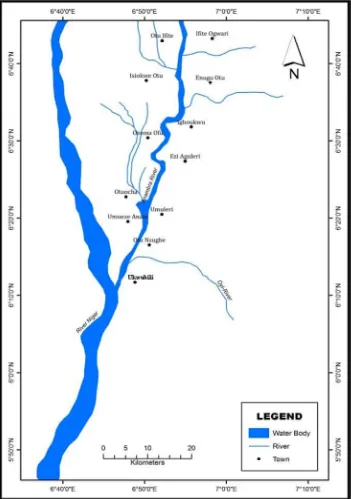
2.1. Study Area
Anambra River is located in Anambra State. The State is located between latitudes 05o 401E and 70o 10N1 and longitude 06o 351E and 07o 201E. It is made up of 21 local government areas and located in South-eastern Nigeria. Two climatic seasons exist in Anambra State, namely rainy season (March-October) and dry season (November-March). This variation in season across the year and the relative annual
rainfall accounts for the fluctuating water level and also the economic activities that depend on the river [14].
2.2. Sampling Design
Due to the nature of the study, a judgmental purposive sampling technique was adopted in choosing the stations from which (water and sediment) samples were collected. In this case, the researcher selected the stations purposively based on the settlement of people along the stretch of the river and activities carried out in the stations. The stations chosen are shown in Table 1.
Table 1. Sampled Stations.
Station Location Activities
A Enugu Otu Farming, Fishing, domestic activities, rice mill industries.
B Ezi-Agulu Otu Farming, fishing, domestic activities
C Otuocha
Farming, fishing, market, rice mill industry, domestic activities and refuse dumping.
D Otu-Nsugbe Farming, fishing, domestic activities, sewage disposal and market
E Ukwuibili Farming, fishing, domestic activities, sewage disposal, market.
2.3. Sampling Operation
Sampling operation at the designated stations (Fig 1) was carried out on an open man-powered canoe. All sample collections were made during the morning time (6am-11.46am each day). The timing of sampling was dictated by the two hydrological seasons prevalent in the tropics. Samples of water, sediment and fish were taken over a one year period and investigated for their heavy metal contents following the schedule given below:
2011, Wet season sampling, July 2012, Dry season sampling, Feb.
2.4. Collection of Samples (Water, Sediment and Fish) From Anambra River
Samples were collected and analyzed for seven heavy metals, (Arsenic (As), Cadmium (Cd), Chromium (Cr), Copper (Cu), Iron (Fe), Lead (Pb) and Zinc (Zn).
2.5. Collection of Water
Water samples from the experimental stations were collected by dipping plastic containers 6-10cm below the surface film of the water body. To prevent adsorption of metals unto the walls of the containers during storage, the five water samples were acidified to pH < 2 [2].
2.6. Collection of Sediment
Five sediment samples from the experimental stations were collected with the aid of a stainless steel grab of the Van-veen type. The sediment samples each were put into a
clean polythene bag while awaiting chemical analysis, according to [4].
2.7. Collection of Fish
Fish samples from Anambra River were caught by employing paid fishermen. A total of seven hundred and twenty (720) fish samples of eighteen (18) different species were used for the study.
2.8. Measurement of Physicochemical Parameters
Salinity and temperature were determined in situ using a Becman Electrodeless salinometer (Model Rs. 5-3). Dissolved oxygen (DO) was determined in situ using digital DO meter (Jenway product, Model 3000). pH was determined using a digital pH meter (Kahl Instrument, Model 11 4W13) calibrated with freshly prepared buffer solutions (pH 4, 7, and 9) and Conductivity determined using conductivity meter (Palintest Waterproof, Model 800).
2.9. Statistical Analyses
Statistical analyses carried out in this study using SPSS (version 17) include determination of mean and analysis of variance, while differences between mean were separated using Duncan’s new multiple Range Test. Two sampled T- test was used to analyze for significant difference (p<0.05) due to the heavy metals and physicochemical parameters detected in the samples between the two seasons.
3. Results
3.1. Distribution of Physicochemical Properties of the Anambra River Water Column
Measurement of some physicochemical characteristics with influential capacity on the environmental mobility and toxicity of heavy metals are shown in Table 2 below. Significant variations (P<0.05) occurred in DO and conductivity over the sampling seasons on different locations. pH, temperature and salinity showed seasonal difference at P<0.05 in different locations studied.
Table 2. Mean (+SD) Physicochemical Properties of Water at Anambra River in Rainy and Dry Season.
Sample Location
Physicochemical Properties
pH D. O Temperature Salinity Conductivity
Rainy Dry Rainy Dry Rainy Dry Rainy Dry Rainy Dry
A Enugu-Out 8.4400+ 0.156* 7.0300+ 0.014* 6.3500+ 0.071a 5.8000+ 0.000b 25.5000+ 0.283* 28.5000+ 0.000* 0.0100+ 0.000 0.0140+ 0.000 39.0500+ 5.303b 23.3000+ 0.000c B Ezi-Agulu Out 8.1950+ 0.021* 6.9250+ 0.007* 5.7500+ 0.212b 6.0000+ 0.000a 25.5000+ 0.141* 28.3000+ 0.000* 0.0400+ 0.000* 0.0170+ 0.000* 68.2000+ 4.525a 23.6000+ 0.000c C Otuocha 8.3200+ 0.170* 6.7150+ 0.007* 5.9500+ 0.212b 6.1000+ 0.000a 25.6000+ 0.000* 28.5000+ 0.000* 0.0200+ 0.014 0.0110+ 0.000 21.4500+ 2.333c 17.2000+ 0.000d D Otu-Nsugbe 8.4050+ 0.134* 6.9300+ 0.000* 6.5000+ 0.141a 5.9000+ 0.000b 25.4500+ 0.707* 28.7000+ 0.000* 0.0300+ 0.000* 0.0140+ 0.000* 19.1000+ 3.253d 31.5000+ 0.000a E Ukwuibili 8.3200+ 0.141* 6.8600+ 0.000* 6.1000+ 0.141a 6.2000+ 0.000a 25.7000+ 0.141* 28.4000+ 0.000* 0.0150+ 0.007 0.0170+ 0.000 15.9500+ 0.919e 25.8000+ 0.000b
3.2. Distribution of Heavy Metals in the Anambra River Water Column
The observed concentrations of heavy metals detected in the water column were shown to portray no difference (P>0.05) with respect to season and location. Season-location interaction effect was also insignificant (P>0.05) over the regimes of sampling (Table 3). Generally, there was stable
relative non-statistical variations among the heavy metal concentration in the water column but numerical differences demonstrated variability (Otu-Nsugbe > Ezi Agulu Otu > Ukwuibili > Enugu Otu > Otuocha. Arsenic (As) and Cd were not detected below 0.001mg/L limit over the seasons while Cr remained undetected throughout the dry season.
Table 3. Mean (+ SD) Concentration (mg/l) of Heavy Metals in Water Samples Collected from Different Locations in Anambra River in Rainy and Dry Season.
Sample Location
Heavy Metal Concentrations
As Cd Cr Cu
Rainy Dry Rainy Dry Rainy Dry Rainy Dry
A
Enugu-Out ND ND ND ND 0.0030+ 0.001 ND 0.0060+ 0.003 0.0120+ 0.000
B
Ezi-Agulu Out ND ND ND ND 0.0040+ 0.001 ND 0.0270+ 0.024 0.0100+ 0.000
C
Otuocha ND ND ND ND 0.0010+ 0.001 ND 0.0050+ 0.001 0.0040+ 0.000
D
Otu –Nsugbe ND ND ND ND ND ND 0.0015+ 0.001 0.0200+ 0.000
E
Ukwuibili ND ND ND ND ND ND 0.0015+ 0.001 0.0180+ 0.000
WHO 0.001 0.001 0.003 0.003 0.01 0.01 0.029 0.029
NESREA 0.05 0.05 0.005 0.005 0.001 0.001 0.001 0.001
Table 3. Continued.
Sample Location
Heavy Metal Concentrations
Fe Pb Zn
Rainy Dry Rainy Dry Rainy Dry
A
Enugu-Out 0.0140+ 0.008 0.0360+ 0.000 0.0015+ 0.001 ND 0.1340+ 0.044
0.2015+ 0.001 B
Ezi-Agulu Out 0.0410+ 0.001 0.0410+ 0.000 0.0030+ 0.000 ND 0.2585+ 0.036
0.2160+ 0.000 C
Otuocha 0.0055+ 0.002 0.0150+ 0.000 0.0010+ 0.000 ND 0.0450+ 0.028
0.1480+ 0.000 D
Otu –Nsugbe 0.0035+ 0.001 0.0600+ 0.000 ND 0.0040+ 0.000 0.0360+ 0.004
0.4100+ 0.000 E
Ukwuibili 0.0040+ 0.001 0.0560+ 0.000 ND 0.0020+ 0.000 0.0365+ 0.008
0.2560+ 0.000
WHO 0.03 0.03 0.01 0.01 <1 <1
NESREA 0.05 0.05 0.01 0.01 0.1 0.1
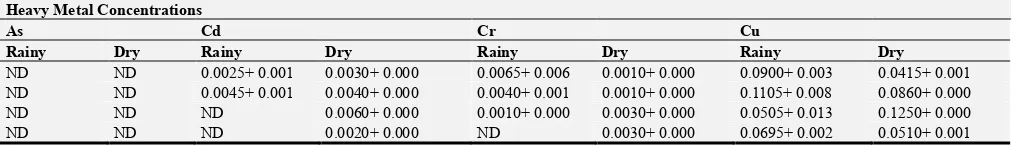
3.3. Distribution of Heavy Metals in the Anambra River Sediment
Table 4 shows the occurrences and distributions of sampled heavy metals in sediments of the Anambra River from various locations of study over the sampling regime. There was no seasonal difference at P>0.05 among the heavy metal concentrations detected. Post Hoc test also showed no statistical variation (P>0.05) over the five locations: namely
Enugu Otu, Ezi - Agulu Otu, Otuocha, Otu Nsugbe and Ukwuibili. Consequently, numerical variations exist among the metal concentrations, detected in the studied locations as follows, Otuocha > Ezi-Agulu Otu> Otu Nsugbe > Ukwuibili > Enugu Otu. Arsenic (As) was not detected in all the locations over the sampling regime. Cd, Cr, and Pb exhibited detected (D) and not detected (ND) variations during the sampling in different locations.
Table 4. Mean (+SD) Concentration (mg/kg) of Heavy Metals in Sediment Samples Collected from Different Locations in Anambra River in Rainy and Dry Season.
Heavy Metal Concentrations
As Cd Cr Cu
Rainy Dry Rainy Dry Rainy Dry Rainy Dry
ND ND 0.0025+ 0.001 0.0030+ 0.000 0.0065+ 0.006 0.0010+ 0.000 0.0900+ 0.003 0.0415+ 0.001
ND ND 0.0045+ 0.001 0.0040+ 0.000 0.0040+ 0.001 0.0010+ 0.000 0.1105+ 0.008 0.0860+ 0.000
ND ND ND 0.0060+ 0.000 0.0010+ 0.000 0.0030+ 0.000 0.0505+ 0.013 0.1250+ 0.000
Heavy Metal Concentrations
As Cd Cr Cu
Rainy Dry Rainy Dry Rainy Dry Rainy Dry
ND ND 0.0060+ 0.001 0.0030+ 0.000 0.0020+ 0.001 0.0020+ 0.000 0.1255+ 0.021 0.0595+ 0.001
0.027 0.027 0.006 0.006 0.025 0.025 0.04 0.04
Table 4. Continued.
Heavy Metal Concentrations
Fe Pb Zn
Rainy Dry Rainy Dry Rainy Dry
0.0505+ 0.022 0.1750+ 0.000 0.0060+ 0.007 ND 0.3435+ 0.018 0.5200+ 0.000
0.0880+ 0.018 0.2400+ 0.000 0.0015+ 0.0010 0.0030+ 0.000 0.4220+ 0.002 0.7805+ 0.001
0.0310+ 0.006 0.2620+ 0.000 ND 0.0050+ 0.000 0.2905+ 0.063 0.9300+ 0.000
0.0635+ 0.013 0.2060+ 0.001 ND 0.0010+ 0.000 0.1955+ 0.127 0.7040+ 0.000
0.0625+ 0.067 0.2380+ 0.000 0.0015+ 0.001 0.0020+ 0.000 0.4210+ 0.154 0.7700+ 0.000
0.04 0.04 0.03 0.03 0.123 0.123
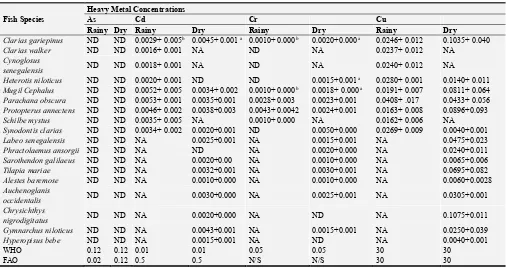
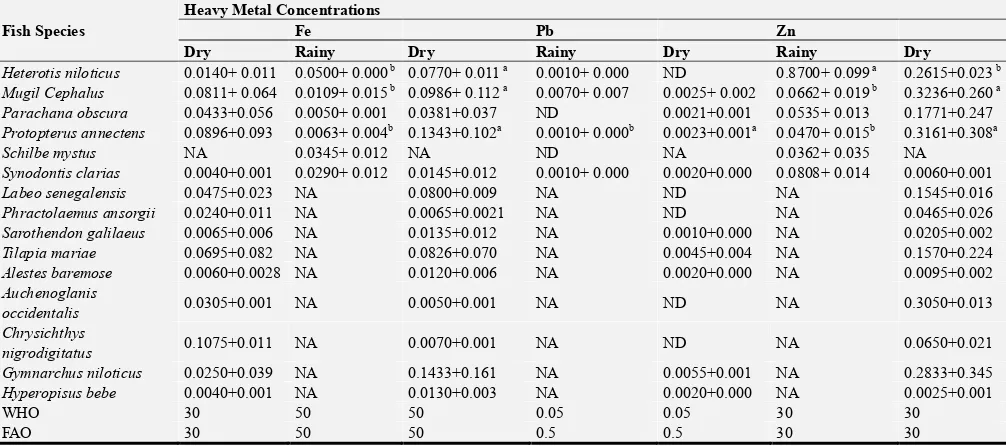
3.4. Distribution of Heavy Metals in Fishes in the Anambra River
The heavy metals detected in the tissue of the sampled fishes in the Anambra River are presented in Table 5. There was difference in the abundance and availability of various fish species studied. Some fish species caught in rainy season were not caught in dry season. On the basis of heavy metal concentrations in the fish species caught both in the rainy and dry season, Clarias gariepinus and Mugil cephalus showed
higher (P <0.05) concentrations of Zn in dry than rainy season, while Heterotis niloticus showed higher (P<0.05) concentrations of Zn in rainy than dry season. In similar fashion, (Clarias gariepinus, and Heterotis niloticus)
recorded higher (P<0.05) concentrations of Cr, Fe, and Cd in dry season than rainy season, respectively. While Mugil cephalus recorded higher (p<0.05) concentrations of Cr and Fe in dry season than rainy season. Protopterus annectens
singularly recorded higher (P<0.05) concentrations of Fe, Pb & Zn in dry season than in rainy season.
Table 5. Mean (+SD) Concentration (mg/kg) of Heavy Metals in Fish Samples Collected from Anambra River in Rainy and Dry Season.
Fish Species
Heavy Metal Concentrations
As Cd Cr Cu
Rainy Dry Rainy Dry Rainy Dry Rainy Dry
Clarias gariepinus ND ND 0.0029+ 0.005b 0.0045+ 0.001 a 0.0010+ 0.000 b 0.0020+0.000 a 0.0246+ 0.012 0.1035+ 0.040
Clarias walker ND ND 0.0016+ 0.001 NA ND NA 0.0237+ 0.012 NA
Cynoglosus
senegalensis ND ND 0.0018+ 0.001 NA ND NA 0.0240+ 0.012 NA
Heterotis niloticus ND ND 0.0020+ 0.001 ND ND 0.0015+0.001 a 0.0280+ 0.001 0.0140+ 0.011
Mugil Cephalus ND ND 0.0052+ 0.005 0.0034+ 0.002 0.0010+ 0.000 b 0.0018+ 0.000 a 0.0191+ 0.007 0.0811+ 0.064
Parachana obscura ND ND 0.0053+ 0.001 0.0035+0.001 0.0028+ 0.003 0.0023+0.001 0.0408+ .017 0.0433+ 0.056
Protopterus annectens ND ND 0.0046+ 0.002 0.0038+0.003 0.0043+ 0.0042 0.0024+0.001 0.0163+ 0.008 0.0896+0.093
Schilbe mystus ND ND 0.0035+ 0.005 NA 0.0010+ 0.000 NA 0.0162+ 0.006 NA
Synodontis clarias ND ND 0.0034+ 0.002 0.0020+0.001 ND 0.0050+0.000 0.0269+ 0.009 0.0040+0.001
Labeo senegalensis ND ND NA 0.0025+0.001 NA 0.0015+0.001 NA 0.0475+0.023
Phractolaemus ansorgii ND ND NA ND NA 0.0020+0.000 NA 0.0240+0.011
Sarothendon galilaeus ND ND NA 0.0020+0.00 NA 0.0010+0.000 NA 0.0065+0.006
Tilapia mariae ND ND NA 0.0032+0.001 NA 0.0030+0.001 NA 0.0695+0.082
Alestes baremose ND ND NA 0.0010+0.000 NA 0.0010+0.000 NA 0.0060+0.0028
Auchenoglanis
occidentalis ND ND NA 0.0030+0.000 NA 0.0025+0.001 NA 0.0305+0.001
Chrysichthys
nigrodigitatus ND ND NA 0.0020+0.000 NA ND NA 0.1075+0.011
Gymnarchus niloticus ND ND NA 0.0043+0.001 NA 0.0015+0.001 NA 0.0250+0.039
Hyperopisus bebe ND ND NA 0.0015+0.001 NA ND NA 0.0040+0.001
WHO 0.12 0.12 0.01 0.01 0.05 0.05 30 30
FAO 0.02 0.12 0.5 0.5 N/S N/S 30 30
Table 5. Continued.
Fish Species
Heavy Metal Concentrations
Fe Pb Zn
Dry Rainy Dry Rainy Dry Rainy Dry
Clarias gariepinus 0.1035+ 0.040 0.0136+ 0.017 b 0.1660+ 0.119 a 0.0016+ 0.001 0.0050+0.000 0.0672+ 0.022 b 0.4460+0.009 a
Clarias walker NA 0.0032+ 0.002 NA ND NA 0.0440+ 0.015 NA
Fish Species
Heavy Metal Concentrations
Fe Pb Zn
Dry Rainy Dry Rainy Dry Rainy Dry
Heterotis niloticus 0.0140+ 0.011 0.0500+ 0.000 b 0.0770+ 0.011 a 0.0010+ 0.000 ND 0.8700+ 0.099 a 0.2615+0.023 b Mugil Cephalus 0.0811+ 0.064 0.0109+ 0.015 b 0.0986+ 0.112 a 0.0070+ 0.007 0.0025+ 0.002 0.0662+ 0.019 b 0.3236+0.260 a
Parachana obscura 0.0433+0.056 0.0050+ 0.001 0.0381+0.037 ND 0.0021+0.001 0.0535+ 0.013 0.1771+0.247
Protopterus annectens 0.0896+0.093 0.0063+ 0.004b 0.1343+0.102a 0.0010+ 0.000b 0.0023+0.001a 0.0470+ 0.015b 0.3161+0.308a
Schilbe mystus NA 0.0345+ 0.012 NA ND NA 0.0362+ 0.035 NA
Synodontis clarias 0.0040+0.001 0.0290+ 0.012 0.0145+0.012 0.0010+ 0.000 0.0020+0.000 0.0808+ 0.014 0.0060+0.001
Labeo senegalensis 0.0475+0.023 NA 0.0800+0.009 NA ND NA 0.1545+0.016
Phractolaemus ansorgii 0.0240+0.011 NA 0.0065+0.0021 NA ND NA 0.0465+0.026
Sarothendon galilaeus 0.0065+0.006 NA 0.0135+0.012 NA 0.0010+0.000 NA 0.0205+0.002
Tilapia mariae 0.0695+0.082 NA 0.0826+0.070 NA 0.0045+0.004 NA 0.1570+0.224
Alestes baremose 0.0060+0.0028 NA 0.0120+0.006 NA 0.0020+0.000 NA 0.0095+0.002
Auchenoglanis
occidentalis 0.0305+0.001 NA 0.0050+0.001 NA ND NA 0.3050+0.013
Chrysichthys
nigrodigitatus 0.1075+0.011 NA 0.0070+0.001 NA ND NA 0.0650+0.021
Gymnarchus niloticus 0.0250+0.039 NA 0.1433+0.161 NA 0.0055+0.001 NA 0.2833+0.345
Hyperopisus bebe 0.0040+0.001 NA 0.0130+0.003 NA 0.0020+0.000 NA 0.0025+0.001
WHO 30 50 50 0.05 0.05 30 30
FAO 30 50 50 0.5 0.5 30 30
3.5. Bioaccumulation Factors (BAF) of Fishes in the Anambra River
The ecological survey carried out in this study has shown that the levels of some heavy metals in the bodies of the fishes resident in the Anambra River were atimes higher than
the concentrations of the metals prevailing in the Anambra River water and/or sediment. The bioaccumulation factors (BAF) for the sampled fish species for rainy and dry season are shown in Tables 6 and 7.
Table 6. Bioaccumulation Factors of Fish Species in the Anambra River in Rainy Season
.
Fish Species
Heavy metals
Cd Cr Cu Fe Pb Zn
Water Sediment Water Sediment Water Sediment Water Sediment Water Sediment Water Sediment
Clarias
gariepnius 3.0 1.0 1.0
mugil cephalus 1.6 1.2 2.4 1.0
Schilbe mystus 1.0 2.0 2.5
Synodontis
clarias 3.4 2.1
Clarias
walkeri 3.0
Heterotis
niloticus 3.5 3.6 8.5 2.6
Protopterus
annectens 1.3 1.3 1.0 2.0
Parachanna
obscura 1.2 1.0 5.1
Cynoglosus
senegalensis 3.0 2.6
Table 7. Bioaccumulation Factors of Fish Species in the Anambra River in Dry Season.
Fish Species
Heavy metals
Cd Cr Cu Fe Pb Zn
Water Sediment Water Sediment Water Sediment Water Sediment Water Sediment Water Sediment
Alestes baremose Sarotherodon galiliaeus Hyperopisus bebe Parachanna
obscura 1.0 1.0 2.9
Protopterus
annectens 1.0 1.0 5.9 1.2 3.2 1.3
Tilapia mariae 4.6 2.0 1.7 1.7
Fish Species
Heavy metals
Cd Cr Cu Fe Pb Zn
Water Sediment Water Sediment Water Sediment Water Sediment Water Sediment Water Sediment
nigrodigitatus
Synodontis clarias 2.5
Mugil cephalus 1.0 5.4 1.0 2.4 1.0 1.0 1.3
Phractolaemus
ansorgii 1.6 1.0
Clarias gariepinus 1.2 1.0 7.0 1.4 4.0 1.7 1.7 1.8
Auchenoglanis
occidentalis 1.5 2.1 1..2
Heterotis niloticus 1.0 1.8 1.0
Gymnarchus
niloticus 1.0 1.0 1.7 3.4 2.0 2.0 1.0
Labeo senegalensis 1.0 3.2 2.0
4. Discussion
The temperature of the two seasons ranged between 25.45-28.70°C. This is in line with the temperature range of 24°C to 31°C recorded by Odo [13] and Obiakor [12]. The heavy metal concentrations detected were shown to have varying concentrations at different locations of study over the sampling regimes. The highest concentrations of metals detected in sediment and water column in Otuocha and Otu-Nsugbe, respectively could be attributed to the fact the areas are surrounded by heavy populations, industries and markets unlike other zones, Otuocha and Otu-Nsugbe regularly receive very high quantities of domestic, industrial and market wastes, which have been reported to contain appreciable quantities of heavy metals [8]. However, the detection of high concentration of heavy metals in Anambra River implies that apart from domestic, commercial and industrial wastes/effluents discharged into the river, Ezu River and Oyi River which drains into Anambra River might also be major contributors to the overall metal content in the Anambra River. Comparisons of the concentrations of most of the metals detected in the various media (sediment, fish and water) revealed that generally, the highest concentrations of most of the metals were detected in the sediment, followed by the fish and finally, the water sample. The detection of higher concentrations of heavy metals in fish samples in freshwater ecosystem has been reported by many authors [7]. Furthermore, the comparisons of heavy metal concentrations detected in the water, fish and sediment of the Anambra River during the sampling regimens to that of other water bodies in some other locations around the world revealed it to be higher than levels detected in River of South Carolina [10], however, lower than the levels reported by Ekeanyanwu
et al. [6] but the water column comparable to the value concentrations of Warri River, Delta State of Nigeria [20].
The biological significance of increasing concentrations of heavy metals with time in the principal media (water, biota and sediment) of the Anambra River is the danger or risk of potential disruption of the delicate ecological balance of the ecosystem. That could occur when concentrations of the metals in the water body reach levels that will cause harmful effects such as reduction in mobility, immobilization,
emigration or death of a significant percentage of populations of important plant and animal species. Such reductions in numbers of individuals if sustained, would subsequently lead to loss of biological diversity of the river ecosystem.
The bioaccumulation of heavy metals by fish observed in this work likely occurred because the experimental animals were able to absorb the metals directly across body surfaces, membranes and ingested food at a faster rate than they were able to metabolize and excrete the absorbed metals. The findings of the study are also in line with the observations of Rajeshkumar and Li [17], in their study on bioaccumulation of heavy metals in fish species from the Meiliang Bay, Taihu Lake, China where they concluded that bioaccumulation of heavy metals in fish species and water have led to various potential health hazards associated with their consumption.
5. Conclusion
The observed increase in metal concentrations over the sampling regimes should justify the need to carryout regular monitoring of the metal content of the river. It should also necessitate the development and enforcement of a stricter effluent and water body metal limitation standards and guidelines, as well as, the installations of wastewater treatment plants in the various industrial establishment in Anambra State.
References
[1] Adebayo, I. A. (2017). Determination of Heavy Metals in Water, Fish and Sediment from Ureje Water Reservoir. Journal of Environmental & Analytical Toxicology, 7 (4) 486.
[2] APHA-AWWA-WPCF (1995). Standard Methods for the Examination of Water and Waste Water (16th Edition). American Public Health Association.
[3] Chi Q. Q., Zhu G. W., Alan L. Bioaccumulation of heavy metals in fishes from Taihu Lake, China. J. Environ. Sci. 2007; 19: 1500–1504.
[5] Eneji, I. S., Sha’Ato, R. and Annune, P. A. (2011). Bioaccumulation of heavy metals in fish (Tilapia zilli and Clarias gariepinus) Organs from River Benue, North-Central Nigeria. Pakistan Journal of Analytical and Environmental Chemistry, 12 (1-2): 25-31.
[6] Ekeanyanwu , C. R., Oguinyi, C. A and Etienajirhevwe, O. F. (2010). Trace metals distribution in fish, bottom sediments and water from Okumeshi River in Delta State, Nigeria. Ethopian Journal of Environmental Studies and Management, 3 (3): 16-23.
[7] Ezeonyejiaku C. D, Obiakor M. O, Nwuba L A. and Okonkwo C. N (2014). Bioaccumulation of heavy metals in fish sourced from environmentally stressed axis of River Niger: Threat to ecosystem and public health. International Journal of Environmental Protection 2 (4) 126-131.
[8] Igwilo, I. O., Afonne, O. J., Maduabuchi, U. J. and Orisakwe, O. E. (2006). Toxicological study of the Anam River in Otuocha, Anambra State, Nigeria. Arch. EnvIron. Occup. Health, 61 (5): 205-208
[9] Khangarot, B. S., Sehgal, A. and Bhasin, M. K. (1983). Man and biosphere studies on sikkim himalayas, Part 1: Acute toxicity of copper and zinc to common carp Cyprinus carpio (Linn.) in soft water. Acta Hydrochim. Hydrobiol., 11 (6) : 667-673.
[10] Koli, A. K., Williams, W. R., Maclay, E. B., Wright, E. L and Burrell, T. M., (1977). Mercury levels in freshwater fish of the State of South California. Bull. Environ. Contain Tovicol., 17: 82-89.
[11] Langston, W. J and Zhua, M. (1987). Cadmium accumulation, distribution and metabolism in the gastropod Littorina littorea; the role of metal binding proteins. J. Mar. Biol. Ass. UK., 67 (3): 587-601.
[12] Obiakor, M. O (2010). Genotoxic Evaluation of Anambra River Using Biomarker. M. Sc Thesis. Department of
Environmental Management. Nnamdi Azikiwe University, Awka, Anambra State, Nigeria.
[13] Odo, G. E (2004). Studies on the Ecology of Macro Invertebrate. Fauna as Fish Food in Anambra River Basin, Nigeria. Ph.D. Thesis. University of Nigeria, Nsukka, Nigeria.
[14] Okoye, C. O. (2016). Comparative limnological studies of Unizik and Amansea streams in Awka South L. G. A, Anambra State, Nigeria. Scientific Review, 2 (4): 53-56.
[15] Öztürk, M., Özözen, G., Minareci, O., and Minareci, E., (2008). Determination of heavy metals in of fishes, water and sediment from the Demirköprü Dam Lake (Turkey). Journal of Applied Biological Sciences, 2 (3): 99–104
[16] Pote, J., Haller, L., Loizeau, J. L., Bravo, A. G., Sastre, V., and Wildi, W., (2008). Effects of a sewage treatment plant outlet pipe extension on the distribution of contaminants in the sediments of the Bay of Vidy, Lake Geneva, Switzerland. Bioresource Technol., 99: 7122–7131.
[17] Rajeshkumar, S., and Li, X. (2018). Bioaccumulation of heavy metals in fish species from the Meiliang Bay, Taihu Lake, China. Toxicology Reports, 5, 288–295.
[18] Storelli, M. M., Storelli, A., D’ddabbo, R., Marano, C., Bruno, R., and Marcotrigiano, G. O., (2005). Trace elements in loggerhead turtles (Caretta caretta) from the eastern Mediterranean Sea: Overview and evaluation. Environ. Pollut., 135: 163–170.
[19] Valavanidis, A and Vlachogianni, T. (2010). “Metal Pollution in Ecosystems: ecotoxicology studies and risk assessment in the marine environment”. Science advances on Environment, Toxicology & Ecotoxicology issues, 1: 10-16.