PARAMETER OPTIMIZATION OF
CARBIDIC AUSTEMPERED DUCTILE
IRON USING TAGUCHI METHOD
P.DHANAPAL1+
Professor in Mechanical Engineering Karpagam Institute of Technology
Coimbatore -641 105, Tamilnadu
India.
1+
Corresponding Author.
DR.S.S.MOHAMED NAZIRUDEEN Professor in Metallurgical Engineering
PSG College of Technology, Coimbatore -641 004,
Tamilnadu, India.
Abstract
Carbidic austempered ductile iron [CADI] is the family of ductile iron containing wear resistance alloy carbides in the ausferrite matrix. This CADI is manufactured by selecting proper material composition through the melting route.In an effort to obtain the optimal production parameters, Taguchi method is applied. To analyse the effect of production parameters on the machanical properties, signal-to-noise (S/N) ratio is calculated based on the design of experiments and the linear graph. The analysis of varience is calculated to find the amount of contribution of factors on individual mechanical properties and its significancy. The analytical results of taguchi method are compared with the experimental values, and it shows both are identical.
Key words: Austempering; Wear; Carbide; Microstructure:
1. Introduction
1.1.Carbidic austempered ductile iron
Recently a new ADI, containing carbides in the ausferrite matrix has been introduced in the market. This is called as Carbidic Austempered Ductile Iron CADI. Carbides are the known strong wear resistance compounds when compared to other materials and are produced easily. But these carbides are not directly used due to their higher brittleness. They are combined with the tough ausferrite matrix; the combination gives a superior quality material.
The addition of carbides in the ausferrite matrix may decrease the toughness. So the challenges related to the development of the material and processing parameters are obtained in order to get both the constitutions in the final microstructure. The available literature related to CADI material shows only the application examples, microstructure and the abrasive wear resistance of CADI [Rimmer, (2006); Hayrynen and Brandenberg, (2003) and Keough and Hayrynen, (2000)].
Carbide content of the material is increased by Reducing the graphitizing elements such as Si.
The other method is increasing cooling rate of the castings by chills.
A third option is introducing carbide stablishing elements like Cr, Mo, Mn and Ti. Carbides produced by any of the first two methods may dissolve during austempering heat treatment.
The literature [Laino, (2008)] shows the combined effect of high cooling rate with copper chills and the addition of carbide stabilizing elements. In practical application, use of chill in intricate components like hollow part with profiles is complicated. So a method of production of CADI without chill is to be investigated. This study explains about the production of carbidic ductile iron by melting route, its austempering heat treatment parameters and their characteristics. Use of chills and reduction of graphitizing elements have not been applied. Carbide stabilizing agents like manganese and molybdenum has a tendency to segregate in the grain boundaries. This will decrease the properties of the ADI [Hayrynen, (2002)]. Alternatively the chromium content of the base metal is increased to induce the carbides.
1.2.Taguchi method
Optimization is a key step to improve the performance and to find the optimal process parameters based on the responses. There are several optimization tools such as the gradient search method, the FEM neural network method and Taguchi method. Taguchi method is a problem solving tool which can improve the performance of the product, process design and system in a short development cycle with reduced cost. This method combines the experimental and analytical concepts to determine the most influential parameter on the result response for the significant improvement in the overall performance. To solve this task, the taguchi method uses a special design of orthogonal array to study the entire process parameter space with a small number of experiments. Many of the researchers has attempted to analyzed and optimized single and multi performance responses of foundry process using Taguchi methodology. Among them multiple progressive tool [Surace, (2010)] and utility concept [Zhizhong, (2008)] are used. But the final results is not deliberately states the effect of process parameter on the responses. So, in this present study the effect of factors on the responses are separately [Muhanned et al (2009) and Jadoun et al (2009)] studied. A loss function is defined to calculate the deviation between the experimental value and the desired value. In the proposed methodology, S/N ratio of different responses is calculated separately. A statistical analysis of variance (ANOVA) is performed to see which process parameter is statistically significant. Finally the optimal process parameters obtained from the parameter design is correlated with the experimental results.
2. Materials and Methods
2.1. Design of experiment
linear graph is employed to identify suitable treatments and the interactions of the factors. The linear graph for the orthogonal array is shown in the fig.1.
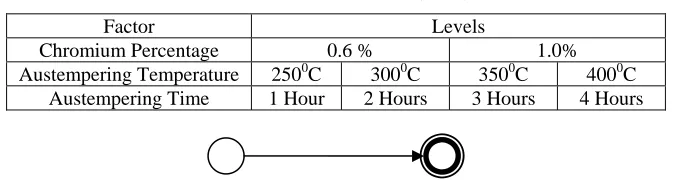
Table 1. Factors and Levels - L32 (21 x 42)
Factor Levels
Chromium Percentage 0.6 % 1.0%
Austempering Temperature 2500C 3000C 3500C 4000C Austempering Time 1 Hour 2 Hours 3 Hours 4 Hours
Fig.1.Linear Graph for L32 (21 x 42) OA.
2.2. Foundry Considerations for the Production of CADI
The base composition of ductile cast irons usually is hypereutectic, where the carbon and silicon contents are typically 3.6 and 2.7 respectively [CE = 4.3]. High silicon content is to be retained to reduce the formation of the secondary carbides which will deposit in the grain boundaries and subsequent reduction of mechanical properties [3]. Thus, the first constituents to appear during solidification are graphite nodules, which nucleate and grow without any austenite, but eventually with austenite enclosing the graphite nodule.
Iron scraps raw material, turnings are melted in a medium frequency induction furnace, composition is adjusted by adding carbon, silicon and heated upto 1540oC. The melt is magnesium treated in a custom designed magnesium treatment ladle [Skaland]. The magnesium alloy consists of MgFeSi with 9wt % of Mg. The melt is transferred to pouring ladle and inoculated with FeSi (75wt% Si). Now, calculated amount of heated ferrochrome is added to increase the chromium level in the pouring ladle. Sand mold is prepared using ordinary silica and dried. The melt is poured into the prepared sand mold within the desired temperature and time. Long time interval may fad the magnesium.
Standard Y-block castings are prepared and the dimension of the casting is as per the ASTM standards. This casting production is done in a ductile iron foundry. The objective is any foundry producing ductile iron can make this CADI without altering their production line. The composition of the sample is analyzed using 40 element vacuum spectrometer and the results are shown in table.2. The material casted is called as Carbidic Ductile Iron [CDI] before heat treatment.
Table: 2. Chemical composition of the samples by wt %.
2.3.The Austempering Process
The Austempering process begins with austenitization followed by rapid cooling and maintaining that temperature for longer period. The austenitization is carried in a salt bath (Nitride & Nitrate mix) at 910oC, for two hours. Salt bath distributes the heat uniformly compared to the atmospheric heating [Dhanapl, et al (2009)]. In the Austempering process, the quenching media is held at a temperature above the martensite start temperature. Austempering temperature varies between 250oC to 400oC in nitrate salt mix.
Austempering time varies between one to four hours in a time interval of one hour. After austempering the specimens are cooled to room temperature in air quenching. This cooling rate will not affect the final microstructure as the carbon content of the austenite is high enough to lower the martensite start temperature to a temperature significantly below room temperature.
Melt Identifi
cation
C Si Mn P S Ni Cr Mo Cu Mg Zn Fe CE
CADI
-0.6 3.593 2.705 0.500 0.038 0.009 0.008 0.630 0.013 0.406 0.046 0.015 91.92 4.507 CADI -
2.4.Characterization
2.4.1. Microstructure examination
Microstructure analysis is carried out on the specimens using metallurgical microscope. Specimens are polished by following standard metallographic procedures, etched in 5% nital [Collins and Watson, (1990)] and examined under optical microscope equipped with high resolution digital camera. The microphotograph is taken using the Nikon Epiphot-Dx microscope at various magnifications. The specimens are polished, etched in 10 % ammonium persulfate and the amount of carbide is measured using “Metal Plus Version-1.0” image analysis software.
Fig.2. Microstructures of (A) DI, (B) ADI, (C) 1 % Cr-CDI and (D) CADI
2.4.2. Strength and hardness
2.3.3. Wear
Abrasion resistance of the material is measured using Pin-on-disk wear testing machine as per ASTM standard G99-05. Disc hardness of HRC – 65, Load of 98.1N is applied to the specimen, with a travel velocity of 1m/s and a distance of 10,000m is considered for the measurement of weight loss. The weight loss values are measured by means of a 0.01 mg precision scale.
3. Results and Analysis
3.1. Orthogonal Array
The taguchi a method provides laying out the experimental conditions using specially designed tables called Orthogonal Array (OA). An appropriate choice of orthogonal array depends upon the degrees of freedom. The L32 (21 x 42) orthogonal array provides the required number of experiments (shown in the table.3). This array
consists of 32 rows, each representing an experiment the columns are assigned to the factor levels. Linear graph shows interactions of factors are not necessary for the experiment. The plan of experiments is made of 32 tests in which the first column is assigned to the chromium content (Cr), second column to the austempering temperate (AT)
and the third column for the austempering time (At).
3.2. Signal-to-Noise (S/N) Ratio
Signal-to-noise ratio where signal represents the desirable value and the noise represents the undesirable value. Therefore, the S/N ratio consolidates several repetitions into one value, which reflects the amount of variation present. There are three S/N ratios available, higher is the better (HB) is used for the Impact toughness, Hardness and the lower is the better (LB) is applied to the wear loss. The equations associated with the S/N ratios are given below.
r
i i HB
y r N
S
1 2
1 1 log 10 /
(1)
r
i i
LB
y
r
N
S
1 2
1
log
10
/
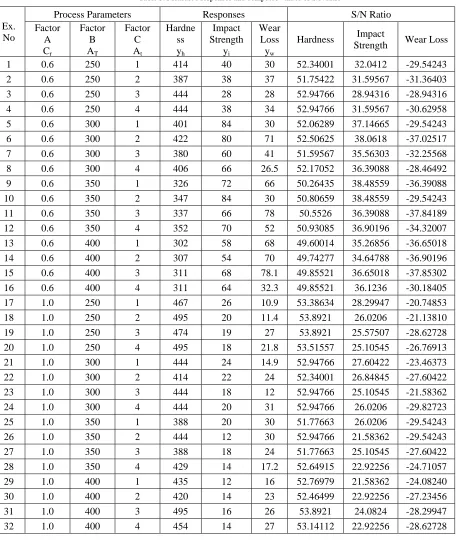
Table 3. Measured responses and computed values of S/N ratio
Ex. No
Process Parameters Responses S/N Ratio
Factor A Cr
Factor B AT
Factor C At
Hardne ss yh
Impact Strength
yi
Wear Loss yw
Hardness Impact
Strength Wear Loss
1 0.6 250 1 414 40 30 52.34001 32.0412 -29.54243
2 0.6 250 2 387 38 37 51.75422 31.59567 -31.36403
3 0.6 250 3 444 28 28 52.94766 28.94316 -28.94316
4 0.6 250 4 444 38 34 52.94766 31.59567 -30.62958
5 0.6 300 1 401 84 30 52.06289 37.14665 -29.54243
6 0.6 300 2 422 80 71 52.50625 38.0618 -37.02517
7 0.6 300 3 380 60 41 51.59567 35.56303 -32.25568
8 0.6 300 4 406 66 26.5 52.17052 36.39088 -28.46492
9 0.6 350 1 326 72 66 50.26435 38.48559 -36.39088
10 0.6 350 2 347 84 30 50.80659 38.48559 -29.54243
11 0.6 350 3 337 66 78 50.5526 36.39088 -37.84189
12 0.6 350 4 352 70 52 50.93085 36.90196 -34.32007
13 0.6 400 1 302 58 68 49.60014 35.26856 -36.65018
14 0.6 400 2 307 54 70 49.74277 34.64788 -36.90196
15 0.6 400 3 311 68 78.1 49.85521 36.65018 -37.85302
16 0.6 400 4 311 64 32.3 49.85521 36.1236 -30.18405
17 1.0 250 1 467 26 10.9 53.38634 28.29947 -20.74853
18 1.0 250 2 495 20 11.4 53.8921 26.0206 -21.13810
19 1.0 250 3 474 19 27 53.8921 25.57507 -28.62728
20 1.0 250 4 495 18 21.8 53.51557 25.10545 -26.76913
21 1.0 300 1 444 24 14.9 52.94766 27.60422 -23.46373
22 1.0 300 2 414 22 24 52.34001 26.84845 -27.60422
23 1.0 300 3 444 18 12 52.94766 25.10545 -21.58362
24 1.0 300 4 444 20 31 52.94766 26.0206 -29.82723
25 1.0 350 1 388 20 30 51.77663 26.0206 -29.54243
26 1.0 350 2 444 12 30 52.94766 21.58362 -29.54243
27 1.0 350 3 388 18 24 51.77663 25.10545 -27.60422
28 1.0 350 4 429 14 17.2 52.64915 22.92256 -24.71057
29 1.0 400 1 435 12 16 52.76979 21.58362 -24.08240
30 1.0 400 2 420 14 23 52.46499 22.92256 -27.23456
31 1.0 400 3 495 16 26 53.8921 24.0824 -28.29947
32 1.0 400 4 454 14 27 53.14112 22.92256 -28.62728
3.3. Data Analysis
higher value. The optimum level setting for the hardness should be A2B1C4. Table.3 (a). Experiment No. 20 shows these conditions and produces the optimal hardness result.
Table.4 (a). S/N Hardness Response table
Symbol Parameters S/N Ratio Max.-Min Rank
Level-1 Level-2 Level-3 Level -4 Cr Chromium
Content 51.246 52.955 _ _ 1.710 1
AT
Austempering
Temperature 53.084 52.440 51.463 51.415 1.669 2 At
Austempering
Time 51.893 52.057 52.182 52.270 0.376 3 Total Mean value of S/N ratio = 52.1060dB
The table 4(b) shows the average of selected characteristics of each level of factor for the impact toughness. The optimum level setting for the impact toughness is A1B2C1. Experiment No. 5 shows these levels of factors and this is the optimum impact toughness among the other values.
Table.4 (b). S/N Impact Toughness Response table
Symbol Parameters S/N Ratio
Max.-Min Rank Level-1 Level-2 Level-3 Level -4
Cr Chromium
Content 35.261 24.857 - - 10.404 1
AT
Austempering
Temperature 28.647 31.592 30.724 29.275 2.945 2 At
Austempering
Time 30.793 30.020 29.781 29.747 1.0453 3
Total Mean value of S/N ratio = 30.0702dB
The table 4(c) shows the average of selected characteristics of each level of factor for the wear loss. The optimum level setting for the wear loss is A2B1C1. Experiment No.17 shows this level of factors and this is the optimum wear resistant of CADI.
Table.4 (c). S/N Wear Loss Response table.
Symbol Parameters
S/N Ratio
Max.-Min Rank Level-1 Level-2 Level-3 Level -4
Cr
Chromium
Content -32.965 -26.212 _ _ 6.7529 1
AT Austempering
Temperature -27.220 -28.720 -31.186 -31.229 4.0088 2 At
Austempering
Time -28.745 -30.044 -30.376 -29.191 1.6307 3 Total Mean value of S/N ratio = -26.977dB
austempering time increase the hardness. This line is not steep when compared to other factors; this shows a less change in the hardness. Comparing the three factors the chromium content line is steeper; which means this affects the hardness drastically.
HARDNESS
50 51 52 53 54
Level-1 Level-2 Level-3 Level -4
S
/N Ra
ti
o
Cr AT At
A
IMPACT TOUGHNESS
24 26 28 30 32 34 36
Level-1 Level-2 Level-3 Level -4
S/
N
R
a
ti
o
Cr AT At
B
Figure.3. Response graph of S/N ratio (a) Hardness, (b) Impact toughness, (c) Wear Loss.
Among the plots in the figure 3(a), gradient of the chromium content plot is more. The same trend is followed in all the graphs 3(b) and 3(c). Effect of chromium content is higher when compared to other factors. Gradient of austempering temperature line is less when compared with the chromium content. So, the next controllable parameter is austempering temperature and the least is the austempering time.
4. Analysis of Variance
Table.5 (a). ANOVA for Hardness
Symbol Source of
Variation DOF
Sum of Squares
Mean
Square F-Statistics F,1% P(%) Cr
Chromium
Percentage 1 123740 123740 95.77091 6.84 23.93 AT Austempering
Temperature 3 234016 78005.3 60.3737 3.94 45.25 At
Austempering
Time 3 4364 1454.67 1.125867 2.13* 0.84
Error 120 155045 1292.04 29.98
Total 127 517165 100.00
Table.5 (b). ANOVA for Impact Toughness.
Symbol Source of
Variation DOF
Sum of Squares
Mean
Square F-Statistics F,1% P(%) Cr
Chromium
Percentage 1 14535 14535 287.0250 7.12 76.04
AT Austempering
Temperature 3 1610 537 10.5959 4.16 8.42
At Austempering
Time 3 135.25 45 0.8903 2.19* 0.71
Error 56 2836 51 14.84
Total 63 19116 100.00
The F-statistics of factors chromium content and austempering temperature are significant upto 99% confidence in all the responses, but the austempering time is not significant. The percentage contribution of chromium content is higher in the impact toughness and the wear loss response. A maximum of 76% contribution is attained in the impact toughness. But the percentage of contribution of chromium content is not that much for the hardness. Austempering temperature contributes more to the hardness.
Table.5 (c). ANOVA for Wear
Symbol Source of
Variation DOF
Sum of Squares
Mean
Square F-Statistics F,1% P(%) Cr
Chromium
Percentage 1 5663.14 5663.14 67.427 7.12 45.69
AT
Austempering
Temperature 3 1641.91 547.30 6.516 4.16 13.25
At
Austempering
Time 3 386.47 128.82 1.534 2.19* 3.12
Error 56 4703.38 83.99 37.95
Total 63 12394.90 100.00
* Not significant upto 90% confidence.
5. Conclusion
Chromium content in the metal is the most significant factor for all the responses. (1% Cr) Level 2 is the optimal for more wear resistance and (0.6%Cr) Level 1 is the optimum for the hardness and the Impact toughness.
Austempering Time is the least significant for all the responses.
An optimal parameter level calculated by the Taguchi method coincides with the experimental results.
Acknowledgments
The author likes to thank the staff members in the Department of Metallurgical Engineering, PSG College of Technology, Coimbatore. The supports of Mr.N.Visvanathan, Managing Director and Mr.V.Venkateswaran, General Manager, AMMARUN FOUNDRIES Coimbatore for their cooperation and the facilities provided to do this study are also acknowledged with gratitude.
References:
[1] Arron Rimmer. (2006): Furnace is the key to CADI Solutions, Foundry Trade Journal. March. PP. 58-59.
[2] Batra, U.; Ray, S.; Prabhakar, SR. (2004): The influence of Nickel and Copper on the Austempering of Ductile iron. Journal of materials
Engineering and Performance. Volume 13(1) February, PP. 64-68.
[3] Brezina, R.; Filipek, J.; Senberger, J. (2004): Application of ductile iron in the manufacturing of ploughshares. Research Agricultural Engg.
50, (2) PP. 75-80.
[4] Collins,W.K.; Watson,J.C. (1990).: Metallographic Etching for Carbide Volume Fraction of High-Chromium White Cast Irons. Materials
Characterization 24: PP.379-386.
[5] Dhanapal. P.; Premkumar,R.; Mohamed Nazirudeen,S.S. (2009).: A study on the influence of heat treatment on the wear resistance of
alloyed Austempered Ductile Iron, Indian foundry journal, Vol: 55. No: 3 March. PP. 32-38.
[6] Hayrynen, K.L. (1995): ADI Another avenue for ductile iron foundries, Modern Casting, 8 PP.35-38.
[7] Hayrynen,KL. (2002): The Production of Austempered Ductile iron. World Conference on ADI.
[8] Hayrynen, K.L.; Brandenberg, K.R.: (2003) Carbidic Ductile iron (CADI) – The New wear material, AFS Transsactions. PP. 03-08.
[9] Jadoun, R.S.and etal. (2009): Taguchi’s optimization of process parameters for production accuracy in ultrasonic drilling of engineering
ceramics. Prod. Engg. Res. Devel. 3: PP. 243-253.
[10] Keough John, R.,PE.; Hayrynen,K.L. (2000): Carbidic Ausempered Ductile iron (CADI) Presented on November
[11] Laino, S.; Sikora, JA.; Dommarco, RC.(2008): Development of Wear Resistant carbidic austempered ductile iron (CADI), wear. 265. PP.
1-7.
[12] Olivera Eri, and etl. (2005): An austempering study of ductile iron alloyed with copper. J. Serb. Chem. Soc. 70 (7) PP.1015–1022.
[13] Osama Muhammed and Etal. (2009): Using of Taguchi method to optimize the casting of Al-Si / Al2O3 Composites. Engg &Tech Journal.
Vol.27, No.6, PP. 1143-1150.
[14] Prasad Rao, P.; Putatunda,Susil K. (2003): Investigations on the fracture toughness of austempered ductile irons austenitized at different
temperatures, Materials Science and Engineering. A349 PP. 136 – 149.
[15] Rossella Surace and etal (2010): Application of Taguchi method for the multi-objective optimization of aluminium foam manufacturing
parameters. Int. J. Mater Form 3. PP. 1-5.
[16] Seshan,S. (1998): Austempered Ductile Iron – The under exploited wonder cast iron, Indian foundry journal October, PP. 84 – 92.
[17] Torbjorn Skaland. Developments in cast iron Metallurgical Treatments. Elkem ASA Research, Norway.
[18] Trudel, A.; Gagne, M. (1997): Effect of composition and heat treatment parameters on the characteristics of austempered ductile irons.
Canadian Metallurgial Quarterly, Vol.36, No.5, PP 289-298.
[19] Zhizhong SUN. etal (2008).: Gating system design for a magnesium alloy casting. Jou.Mater. Sci. Tech. Vol-24, No.1.PP. 93-95.
[20] Zimba,J.; Simbi,DJ.; Navara,E. (2003): Austempered ductile iron: an alternative material for earth moving components. Cement & concrete