POTENTIAL OF SOLAR ENERGY IN
TROPICS
R. BHATTACHARYA
Department of Environmental Science, University of Kalyani, Kalyani 741235 rinaenv@yahoo.com
S. PAL
Department of Environmental Science, University of Kalyani, Kalyani 741235 sudiptaenv@yahoo.com
G. BISWAS
Department of Environmental Science, University of Kalyani, Kalyani 741235 gourab.biswas07@gmail.com
S. KARMAKAR
Department of Environmental Science, University of Kalyani, Kalyani 741235 ts.karmakar007@gmail.com
P. BARMAN
Department of Environmental Science, University of Kalyani, Kalyani 741235 piyalibarman2912@gmail.com
P. MALI
National Centre for Medium Range Weather Forecasting, Noida 201307 p_mali2000@yahoo.co.uk
Abstract:
Solar radiation data along with bright sunshine hours over four major cities Delhi, Chennai, Pune and Kolkata for the period 1997 to 2008 are extensively analyzed to estimate the seasonal distribution of global and diffuse radiation. The contribution of diffuse radiation is high during the end of pre-monsoon and monsoon months. Annual bright sunshine duration ranges from 2229 hours to 2784 hours. Therefore the solar energy can be utilized and at the same time proper precautions should be taken to combat heat stress and UV exposure particular for outdoor workers.
Key words: Global radiation; Diffuse radiation; Sunshine hours; Clearness Index 1. Introduction
Solar radiation is the primary source of energy to all living beings and significant for global energy balance [Ahmad, et al., (2009)]. Solar energy received per year is 1.5× 10¹⁵MW. 8.2×10¹³ KW is used for driving atmospheric motion and 4×10¹³kW is utilized in hydrocyclic cycle. Photosynthesis process on earth absorbs 4x10⁹kW. Even green canopy needs 7 watt/m2 solar energy. The balance of solar radiation in earth-atmosphere system is given by [Sellers, (1965); Conley and Mckee, (1983)].
Qs = Cr+ Ar+ Ca+ Aa + (Q +q) (1-α) + (Q + q) α (1)
where Qs = Amount of solar radiation incident at the top of atmosphere, Cr = Reflected and scattered amount of
solar radiation by clouds, Ar = Reflected back amount of solar radiation by Aerosols, Ca = Solar radiation
absorbed by clouds, Aa = Solar radiation absorbed by aerosols, Q = Direct solar radiation incident on ground, q
= Diffused solar radiation, α = Albedo of the surface.
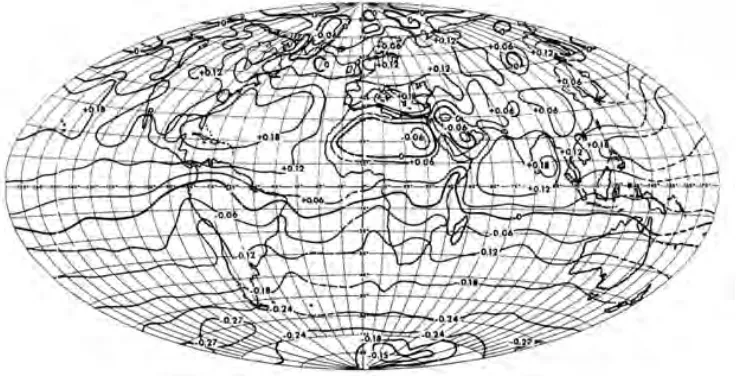
Fig. 1 represents the radiation balance of earth atmosphere system [NASA, (1996)]. The data was taken by Nimbus II MRIR instrument during July 1 – 15, 1966 [Raschke et al., (1967); Bhattacharya et al., (1996)]. Main source of energy supply comes from fossil fuel. But due to rapid urbanization and industrialization, the requirements of energy are increased day by day which in turn depleted the availability of fossil fuels. Solar energy may be one of the eco-friendly sources which can be utilized as a good alternative of fossil fuels [Tiwari and Suleja, (1997); Abdullah and Farugh, (1998); Kumar, (2011)]. Moreover solar energy controls the atmospheric dynamics. Therefore radiation budget estimations of a particular site will give the picture of the abundance of solar energy [Liu and Jordan, (1960); Ahmed and Intikhab, (2004); Ahmed et al., (2009); Okundamiya and Nzeako, (2010); Okundamiya and Nzeako, (2011)]. The need has been recognized by agriculturists, engineers and hydrologists over the globe since 1940 [Moon, (1940); Page, (1964); Lacis and Hansen, (1974);Duffie, (1991); Ashjaee et al. (1993); Ahmed and Hassan (2011); Safaripour and Mehrabian, (2011);]. Field workers are exposed to solar energy and therefore embedded in environmental heat stress [Wing,
Fig. 1. Radiation balance of earth atmosphere system (Raschke et al., 1967).
(1965); Epstein et al., (1980); Parsons, (2003); Epstein and Moran, (2006); Bhattacharya et al., (2012a)]. Some ultraviolet part of solar radiation also penetrates our atmosphere and causes health hazards [Burlon et al., (1991); Khogali and Bar, (1992); Bhattacharya et al., (2012b)]. Information about solar radiation has different type of applications viz crop drying, sowing of seeds, photosynthesis, solar cell, precautions from UVB etc [Ahmed and Naqvi, (1981); Ahmad et al., (2009); Abbasi, (2012); Bhattacharya et al., (2012c)]. In India insolation is abundant throughout the year. The average insolation varies from 5.2 – 6.6 kWh/m2. Here an attempt is made to investigate the characteristic distribution of global and diffuse solar radiation over four Indian cities.
2. Methodology Study Locations
Four cities at different locations are selected in our studies. The cities are Delhi, Pune, Chennai and Kolkata. Climatologically features of the cities are furnished below.
New Delhi (29.01oN, 77.38oE) lies West of the Yamuna River and a part of the Aravalli Range. New Delhi has a monsoon-influenced humid subtropical climate with extreme weather variations. The temperature varies from 46°C in summer to around 0°C in winter. Summers are long, from early April to October with temperature around 30o C. The average annual rainfall is 714 mm with a peak in August 258.7 mm.
Chennai (13.08oN, 80.27oE) the “Gateway to South India” is located on the South–Eastern coast of India in the North–Eastern part of Tamil Nadu. Its average elevation is around 6.7 m. Two major rivers meander through Chennai, the Cooum River and the Adyar River. Chennai has a tropical wet and dry climate. The city lies on the thermal equator and variation in seasonal temperature is negligible. The weather is hot and humid for most of the year. The hottest part of the year prevails from late May to early June, known regionally as Agni Nakshatram with maximum temperatures ranges from 35–40°C. The coolest part of the year is January when minimum temperatures are around 15–22°C. The city gets seasonal rainfall from July to November when the average rainy days vary from 6.9 to 11 days. Average annual rainfall is 1391.5mm.
Pune (18.52oN, 73.84oE) has a tropical wet and dry climate with average temperatures ranging between 20.2°C to 29.7°C. Summer months are from March to May, with maximum temperatures ranging from 35°C to 38°C. Sometimes it goes beyond 40°C but the nights are cool. The monsoon lasts from June to October, with moderate rainfall ranges from 68mm to163mm. The average annual rainfall is around 722 mm. July is the wettest month with average of 17 rainy days whereas January is the driest having on an average 0.1 rainy days.
Kolkata (22.57 o N, 88.34oE) is situated beside the East bank of the Hooghly River, within the lower Ganges Delta of Eastern India. Kolkata has a tropical wet-and-dry climate. Summers (March–May) are hot and humid. In April and May, the city is struck by pre monsoon thunderstorms known as norwesters or Kalbaisakhi which brings relief from the prevailing heat stress. The daily mean temperature ranges from 20.1oC (January) to 30.7oC (May). Rainy season prevails from June to first week of October, with a peak in July (411 mm) and annual rainfall of 1800 mm. Winter lasts for about two months. The city annually receives 2112.5 hours of sunshine with a peak exposure in April (234 hrs).
Data Source
Extra terrestrial radiation
Extra terrestrial radiation is the solar radiation outside the atmosphere incident on a horizontal surface and according to Angstrom (1924)
(H/H0) = a + b (n/N) (2)
where H and H0 are respectively the monthly mean global radiation at a particular site and extra terrestrial
radiation on a horizontal surface in absence of atmosphere. The two parameters a and b are expressed by the following relations [Tiwari and Sangeeta, (1977); Frere et al., (1980)].
a= 0.110 + 0.235 Cos φ + 0.323 (n/N) (3) b = 1.449 – 0.553 Cos φ – 0.694 (n/N) (4)
where n and N are respectively the monthly average sunshine hours and total day length. Clearness Index
The amount of solar radiation reaches the earth surface will depend on the transparency of the atmosphere to extraterrestrial radiation The degree of clearness of the sky Kt and Kd in relation to global and diffuse radiation
may be obtained from the equations [Frere et al., (1980); Duffie and Beckman, (1991)] Kt = H/H0 (5)
Kd = Hd/ H0 (6)
where H and Hd are the daily global and diffuse radiation.
3. Results and Discussion
Daily average global radiation, diffuse radiation, bright sunshine hours for the period 1997 – 2008 are utilized in the analysis.
Daily Global and Diffuse radiation
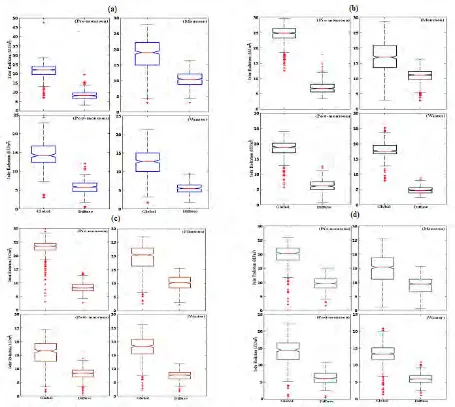
Delhi, Chennai, Pune and Kolkata have different geographical and climatological characteristics. As the solar radiation penetrates through the atmosphere, it will be attenuated due to scattering and absorption of solar radiation by cloud and aerosol particles. Some part of the scattered radiation is returned back to the earth surface and some part is lost. The amount of diffuse radiation depends on the turbidity of the atmosphere. Fig. 2 represents the notched box plot of global and diffuse radiation over Delhi, Chennai, Pune and Kolkata. The upper and lower line of the box gives the 75th and 25th percentiles of the daily global and diffuse radiation. The middle line gives the sample median. The ‘+’ points are outliers i.e. 1.5 times the inter quartile range. The notches are confidence interval about the median. It is observed from the graph that skewness of data in global radiation is large for Pune in winter whereas for Delhi in post-monsoon season. Maximum global radiations are 47.59 MJ/m2 (20.04.1998), 34.62 MJ/m2 (01.06.1997), 29.69 MJ/m2 (30.05.1997) and 22.72 MJ/m2 (22.04.2007) over Delhi, Chennai, Pune and Kolkata respectively as obtained from the available data during the period 1997 to 2008.
Delhi receives maximum diffuse radiation in July but the highest value recorded in May which is 19.43 MJ/m2. In general diffuse radiation is greater than 12.78 MJ/m2 during April to September. The higher values in summer and monsoon may be due to increased value of turbidity and cloudiness. In Pune, the highest diffuse radiation is recorded in June 16.31 MJ/m2 but in general the diffuse radiation is higher from May to October. In Kolkata, higher values of diffuse radiation prevail from March to September and highest values are recorded in June 16.4 MJ/m2. In Chennai the diffuse radiation varies from 12.68 to 15.53 MJ/m2 from March to October. Lowest value of diffuse radiation is 0.38 MJ/m2 in November at Delhi. The lowest values 0.522 MJ/m2 (October), 0.83 MJ/m2 (October), 0.88 MJ/m2 (November) are respectively obtained over the cities Kolkata, Chennai and Pune. The values of diffuse to global radiation are found to vary from 23% to 64% which indicates that about 64% of the terrestrial radiation is scattered sky radiation during cloudy days. The variation is highest in Pune 23% (February) to 73% (August). The variation is least in Kolkata where the range is from 41% (November) to 64% (July). The lowest variation in Chennai 33% (February) to 57% (August) may be due to general cloudiness throughout the year [Bhattacharya et al., (1996)].
Clearness of the Sky
Clearness of the sky Kt and Kd in relation to global and diffuse radiation are estimated using the relation (2) and
(3). Table 1(a) and 1(b) describe the monthly average, maximum and minimum values of Kt and Kd for the four
cities.
Sunshine Hours
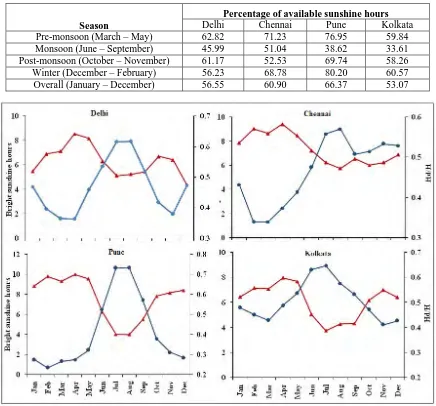
The ratio of sunshine hours to total day length ranges from .001 to 0.98 for all the cities. The bright sunshine hours is also found highest in the month of April and lies in the range 7.97 (Kolkata) to 10.01(Pune). Table 2 illustrates the percentage of available sunshine hours in pre-monsoon (March-May), monsoon (June-Sept.), post-
Fig. 2. Seasonal distribution of global and diffuse radiation over (a) Delhi, (b) Chennai, (c) Pune and (d) Kolkata
monsoon (Oct. and Nov.) and Winter (Dec.-Feb.) months. Annual average of sunshine hours over Delhi, Chennai, Pune and Kolkata is about 59.22%.
Fig. 3 represents the monthly mean variation of Hd/H with sunshine hours throughout the year. Bright sunshine
hour and the ratio Hd/H are inversely related to each other. Correlation coefficient between Hd/H and bright
sunshine hours varies from 0.910 to 0.923 with p values <0.00002. It is also noted that relation between Hd/H
and bright sunshine hours fits well with 5th degree polynomial.
Table 1(a). Monthly variation of clearness index Kt
Month
Table 1 (b). Monthly variation of clearness index Kd
Month
Delhi Chennai Pune Kolkata Mean Max Min Mean Max Min Mean Max Min Mean Max Min
Jan 0.36 0.58 0.18 0.37 0.61 0.10 0.25 0.63 0.10 0.38 0.61 0.19 Feb 0.32 0.53 0.09 0.30 0.54 0.13 0.21 0.40 0.11 0.35 0.59 0.19 Mar 0.29 0.62 0.15 0.29 0.51 0.15 0.24 0.61 0.12 0.36 0.58 0.15 Apr 0.31 0.49 0.14 0.32 0.50 0.15 0.25 0.59 0.12 0.40 0.66 0.23 May 0.37 0.65 0.17 0.33 0.54 0.15 0.28 0.52 0.11 0.43 0.59 0.21 Jun 0.40 0.61 0.20 0.36 0.56 0.15 0.37 0.54 0.21 0.40 0.61 0.21 Jul 0.42 0.57 0.28 0.24 0.39 0.07 0.44 0.60 0.31 0.38 0.54 0.13 Aug 0.42 0.59 0.29 0.40 0.59 0.19 0.45 0.56 0.31 0.38 0.64 0.08 Sep 0.36 0.55 0.18 0.37 0.61 0.18 0.41 0.65 0.17 0.37 0.66 0.09 Oct 0.34 0.63 0.06 0.38 0.60 0.10 0.32 0.68 0.14 0.37 0.58 0.15 Nov 0.31 0.51 0.14 0.40 0.76 0.20 0.27 0.52 0.04 0.33 0.55 0.11 Dec 0.33 0.54 0.16 0.41 0.66 0.19 0.25 0.47 0.12 0.33 0.55 0.14
Table 2 Seasonal variation of sunshine hours
Season
Percentage of available sunshine hours
Delhi Chennai Pune Kolkata
Pre-monsoon (March – May) 62.82 71.23 76.95 59.84
Monsoon (June – September) 45.99 51.04 38.62 33.61
Post-monsoon (October – November) 61.17 52.53 69.74 58.26
Winter (December – February) 56.23 68.78 80.20 60.57
Overall (January – December) 56.55 60.90 66.37 53.07
Fig. 3. Annual variation of Hd/H (blue line) and bright sun shine hours (red line) over Delhi, Chennai, Pune and Kolkata
4. Conclusions
This paper reports the distribution of global and diffuse radiation over Delhi, Chennai, Pune and Kolkata. Average duration of sunshine hours is highest at Pune. Annually received sunshine hours of Delhi, Chennai, Pune and Kolkata are respectively 2301.21 hours, 2679.85 hours, 2784.56 hours and 2228.99 hours. The
analysis shows that maximum solar radiation is obtained in the month April irrespective of the locations and it ranges from 239.1 to 300.3 hours. Therefore summer months are stressful to the outdoor workers. Stresses come from both heat and ultraviolet radiation and proper precautions should be taken for them following the guide lines ISO 7243, 1982 (www.iso.org) and National Weather Service, 1994 (www.epa.gov). Again the analysis shows that solar radiation may be utilized as an alternative source of energy.
Acknowledgements
Financial support of University Grants Commission, New Delhi and DST-PURSE Programme of Kalyani University, West Bengal are thankfully acknowledged. Thanks are also due to India Meteorological Department, for providing some of the relevant data.
References
[1] Abbasi, A. A; Qureshi, M. S. (2012): Solar radiation potential study and assessment of a 13 KWP grid connected solar photovoltaic power plant on 100 m2 available area in the Rohri, Sindh, Pakistan. Int. J. Res. IT, Management and Engineering, 2(5), pp. 14-22.
[2] Abdullah, Y. A. G.; Farugh, G. M. (1998): Contribution to the study of solar radiation in Abu Dhabi. Energy Conv. Management, 28 (1), pp. 63-67.
[3] Ahamed, M. ; Hassan, F .(2011): Cumulative effect of temperature and solar radiation on wheat yield. Not. Bot. Horti. Agrobo., 39,pp. 146-152.
[4] Ahmad, F.; Hussain, S A.; Naqvi, SMMR; Akhtar, M. W.; Naqvi, S. A. (1981): Characteristic distribution of total, direct and diffuse solar radiation at Karachi. Pak. J. Sci. Res., 24 (5-6), pp. 171-174.
[5] Ahmad, F; Intikhab, U. (2004): Empirical model for the correlation of monthly average daily global solar radiation with hours of sunshine on a horizontal surface at Karachi, Pakistan. Turkish J. Physics, 28, pp. 301-307.
[6] Ahmed, A. M.; Ahmad, F.; Akhtar, M. W. (2009): Estimation of global and diffuse solar radiation for Hyderabad, Sindh, Pakistan. JBAAS, 5(2), pp. 73-77.
[7] Angstrom, A. (1924): Solar and terrestrial radiation. Q.J.R, Met. Soc., 50, pp. 121-126.
[8] Ashjaee, M.; Roomina, M. R; Ghafouri, A. R. (1993): Estimating direct, diffuse, and global solar radiation for various cities in Iran by two methods and their comparison with the measured data. Sol. Energy, 50 (5), pp. 441-446.
[9] Bhattacharya, A. B.; Kar, S. K.; Bhattacharya, R. (1996): Diffuse solar radiation and associated meteorological parameters in India. Ann. Geophys., 14, pp. 1051-1059.
[10] Bhattacharya, R.; Pal, S.; Biswas, G.; Karmakar, S.; Banik, R. (2012a): An estimation of heat stress in tropics. Int. J. Engg. Sci. Tech., 4, pp. 4302-4307.
[11] Bhattacharya, R.; Pal, S.; Bhowmick, A.; Barman, P. (2012b): Annual variability and distribution of ultraviolet index over India using TEMIS data. Int. J. Engg. Sci. Tech., 4, pp. 4577-4583.
[12] Bhattacharya, R.; Bhoumick, R. (2012c): Measurement of surface solar Ultraviolet radiation at tropical coastal station Bakkhali in West Bengal, India. Int. J. Eng. Sci. Tech., 4, pp. 3824-3832.
[13] Burlon, R; Bivona, S.; Leone, C. (1991): Instantaneous hourly and daily radiation at tilted surfaces. Sol. Energy, 47, pp. 83-89. [14] Conley, J. R.; McKee, T. B. (1983): An analysis of solar radiation data for Fort Collins. Climatology Report No. 83-2. [15] Duffie, J. A; Beckman, W. A. (1991): Solar Engineering of thermal process. John-Wiley & Sons, New York.
[16] Epstein, Y.; Keren, G.; Moisseiev, J.; Gasko, O. Yachin, S. (1980): Psychomotor deterioration during exposure to heat. Aviat. Space Environ. Med., 51, pp. 607-610.
[17] Epstein, Y.; Moran, D. S. (2006): Thermal comfort and the heat stress indices. Indus. Health, 44, pp. 388-398.
[18] Frere et al., (1980): Graphs given in A.A Flocas paper Estimation and prediction of global solar radiation over Greece. Sol. Energy, 24, pp. 63-70.
[19] Khogali, A.; Al-Bar, O. (1992): A study of solar ultraviolet radiation at Makah solar station. Sol. Energy, 48, pp. 79-87.
[20] Kumar, R. (2011): Study and design of building integrated photo voltaic system at HCTM campus Kaithal, Haryana. IJRIME, 1 (5). [21] Lacis, A. L.; Hansen, J. E. (1974): A parameterization for absorption of solar radiation in the earth’s atmosphere. J. Atmospheric Sci.,
31, pp.118-133.
[22] Liu, YH; Jordan, RC.(1960): The inter relationship and characteristic distribution of direct, diffuse and total solar radiation from metrological data, Sol. Energy,4, pp. 1-19.
[23] Moon, P. (1940): Proposed standard solar-radiation curves for engineering use, J. Frankl Inst., 230, pp.583-617.
[24] Okundamiya, M.S.; Nzeako, A.N. (2011): Estimation of diffuse solar radiation for selected cities in Nigeria, ISRN Renewable Energy, 10, pp.1-6.
[25] Okundamiya, M.S.; Nzeako, A.N. (2010): Empirical model for estimating global solar radiation on horizontal surfaces for selected cities in the six geopolitical zones in Nigeria, Res. J. Appl. Sci. Engi. Technol., 2, pp. 805-812.
[26] Page, J. K. (1961): The estimation of monthly mean values of daily total shortwave radiation on vertical and inclined surfaces from sunshine records for latitudes 40°N-40°S. Proc. U.N. Conf. on New Sources of Energy, Paper No. 35/S/98, pp.378-390.
[27] Parsons, K. (2003): Human thermal environments, 2nd Ed. Taylor & Francis, London pp.258-92.
[28] Raschke, E.; Moller, F.; Bandeen, W.R. (1967): The radiation balance of the Earth-atmosphere system over both polar regions obtained from radiation measurements of the Nimbus II meteorological satellite, NASA Goddard Space Flight Centre,X-622-67-460. [29] Safaripur, M.H.; Mehrabian, M.A. (2011): Predicting the direct, diffuse, and global solar radiation on a horizontal surface and
comparing with real data, Heat Mass Transfer, 47, pp.1537-1551.
[30] Sellers, W.D. (1965): Physical Climatology, The University of Chicago Press, pp. 1-272.