OPTIMIZED APPROACH FOR
CHARACTERISTIC AND PREDICTIVE
OF ANOMALIES IN A DYNAMIC DATA
SYSTEM
Nethravathi K
Computer Science, Research Scholar, S.N.R Sons College,Coimbatore-641 006, India
Dr.Anna Saro Vijendran
Director, Department of Computer Applications, S.N.R Sons College,Coimbatore-641 006,India
ABSTRACT:
Events, as an application specific subset in the target sequence, are often closely related to certain time-ordered structures, called temporal patterns. Discovering such temporal patterns that are characteristic and predictive of the events is critical in many applications. Multivariate Reconstructed Phase Space (MRPS) embedding is proposed in the existing system, to detect multivariate predictive temporal patterns and explore their relationships with defined events in the target data sequence. This embedding creates a new feature space combining all the individual embedding of each variable sequence. This algorithm also provides a discriminative module that utilizes the Gaussian mixture model to score temporal patterns based on the posterior likelihood. In this thesis, proposing a new classifier and an associated objective function that integrate both temporal pattern modeling in MRPS and Bayesian discriminative scoring for temporal pattern classification in multivariate data sequences. Gaussian Mixer Model Classifiers are often affected by over fitting problems while labeling and errors occur far from the decision boundaries. To prevent this, proposed a new method which considers labeling errors independently of their distance to the decision boundaries. This is achieved by introducing binary latent variables which indicates a given instance to be an outlier (wrongly labeled instance) or not. The Bayesian inference is used to solve difficulty in learning problem. Model Evidence, Prediction and Outlier Identification are the three methods proposed to improve GMM classifier. In this thesis, includes a dual simplex optimization method to solve the complex event. The proposed objective method is an alternate optimization for the optimization objective function proposed in the existing work. From the experimentation result, the proposed system is well effective than the existing work.
Keywords:
Dual simplex optimization; Dynamic Data System; Gaussian Mixture Model; Multivariate Reconstructed Phase Space; Temporal Pattern.
I.INTRODUCTION
Intrusion detection in network is not rare interesting bursts .this detection does not adhere to rare outlier and many methods of an outlier but instead analysis of cluster algorithm method is used to detect the clusters by the patterns
II. LITERATURE REVIEW
2.1 Ensemble Classifiers-Mining Concept for Drifting Data Streams based on their classification
Data stream mining with drifts concept is challenging concept for fraud detection and all marketing intrusion[16]. In this, proposing a method for streaming data drifting. The data stream is divided into two parts training dataset and testing data set .the training data set is a model of classification that are the chunks of data. The testing data is used to find the prediction of accuracy of the ensemble classifier. In this paper proposing a method called weighted ensemble classifier for drifting the streaming data.
In the training data stream, the data is not consistent and timely manner. So presenting a refine models to handle drifting called classifier incremental decision tree is used to predict the data stream more accurately without loss in the data stream.
2.2 Reconstructed Phase Space Model for Fuzzy set Identifications of Temporal Patterns in Complex Time Series
In this work, proposing a new temporal pattern identification framework (called New Framework thereafter) that significantly improves over the original TSDM framework [37]. The new objective function is the composition of event characteristic function and the membership function of a fuzzy set based temporal pattern vector in the time delay embedding phase space, and is more logical for defining the pattern of temporal events naturally. The center and radius of the temporal event cluster are calculated by the statistical mean and standard deviation of a continuously differentiable Gaussian-shaped membership function. Other advantages of New Framework include the computing efficiency and consistency of the search results. It should be stressed that our New Framework is not aimed to model or to “fit” the all data points of the time series. That is, the resulting temporal pattern cluster is not targeted to include all temporal patterns. An event Xt is predicted whenever a point
is within the pattern cluster. After evaluating the testing results, a decision will be made whether or not the results are accepted, or the training stage is repeated till the results are satisfied.
2.3 Pattern Discovery in Time Series for Financial Prediction
In this knowledge based method in representing the financial time series and to equip. the knowledge discovery process of the time series [7]. The variance in the stock price is represented in fuzzy candlestick patterns which make the imprecise and huge investment knowledge computable, comprehensive visual and also editable. The rich information is carried by the fuzzy candle stick pattern to increase the efficiency of the knowledge discovery process of financial time series. To implement a system prototype to illustrate the usage of the fuzzy candle stick pattern the pattern construction and the recognition process are introduced. So that the investors can save and share their investment experience and also increase the efficiency of their investing strategies.
2.4 Time Series Events for The Complex Characterization and Prediction In A New Temporal Pattern Inspired by concepts in data mining and dynamical systems, this paper introduces a new method for identifying temporal patterns in time series that are significant for characterizing and predicting events [22], i.e., the important occurrences. The new method is capable of characterizing temporal patterns of complex time series, which are often no periodic, irregular, and chaotic. This method identifies predictive temporal structures in reconstructed phase spaces. A genetic algorithm searches such phase spaces for optimal heterogeneous (varying dimension) clusters that are predictive of the desired events. Instead of predefining the temporal Patterns subjectively, the method applies an optimization approach to search for the optimal temporal patterns, which match the specific goal of the problem. This is accomplished by defining a problem specific event characteristic function g(.). to formalize the concept of eventness. There are several significant features of the proposed method. the objective function in the optimization reflects the goal of the time series being examined, i.e., droplet releases, and is problem specific. A brief outline of the method is given here, with a detailed description presented in the following sections. Given a training time series X = {xt; t = 1; . . . ;N}. The time series X is unfolded into IRQ—a reconstructed phase space, called simply phase space here—using time-delayed embedding. The unfolding mechanism maps X into IRQ. Specifically, a set of Q time series
observations taken from X map to
2.5 Prediction of Sea Level Anomalies Using Ocean Circulation Model Forced by Scatterometer Wind and Validation Using TOPEX/Poseidon on Data
In this work, present further comparison of the ocean model results with the TOPEX-Poseidon altimeter measurements [21]. Simulated and measured sea level variability is described over the three tropical oceans. The annual and semi-annual signals, as well as the interannual variability, partly linked to the El Niño southern oscillation (ENSO) phenomenon, are well simulated by the OPA7 model when the satellite winds are used. Furthermore, it shows that the objective method, kriging technique, used to interpolate the mean ERS wind fields, dramatically reduces the effects of the satellite band like sampling. In the last part of this work, focus on the relationship between the wind stress anomalies and the sea level anomalies in the case of the 1997– 1998 El Niño event. It clearly shows that sea level anomalies in the eastern and western parts of the Pacific are strongly linked to wind stress anomalies in the central Pacific. The forthcoming scatterometers aboard the METOP and ADEOS satellites will provide a much better coverage. In this work, analyze ERS surface wind measurements to examine their adequacy to force the oceanic global circulation model (OGCM) OPA7. Taking advantage of this wealth of surface wind measurements over a time period covering several annual cycles, mean weekly surface wind and wind stress fields were computed onto a 1 square grid using a statistical interpolation method.
3. METHODOLOGY MRPS-GMM CLASSIFICATION IN PHASE SPACE 3.1 Data categorization
Consider the multivariate sequence. An (m + 1)-dimensional data vector xi = (x1i; x2i; . . . ; xmi; xei)T is observed at each time i as a sample instance. The definition of event function depends on specific applications. One commonly used event function is a threshold function which can be defined as follows:
Where k is the time-step ahead, c is the threshold above which an event occurs, and {xei; i = 1; . . .; N} denotes the target sequence with events that are of interest. The parameter k is problem-specific constant which specifies the maximum forecasting time horizon. For example, k is equal to 7 if we are interested in predicting the electric consumption of a customer over the next week horizon. The pattern vectors that are predictive of future events take positive values of event function, whereas normal state vectors take negative values. Therefore, in training stage, we can categorize multivariate data sequences into event, pattern or normal state at each time i. In general application, it is meaningful to predict events or classify patterns when the underlying system is not in event state. Thus, for detecting predictive patterns, our focus is primarily on classification of two categories of data, which are sequences in pattern and normal state according to the definition of event function g(xi) = {+1; -1} for each time i.
3.2 Multivariate Phase Space Embedding
Consider general multivariate data sequences with m causing variables Xj = {xji; i = 1; . . .; N}, with one target sequence Xe = {xei; i = 1; . . .; N} or an aggregated composite of multiple sequences, where j = 1; . . .; m. Denote xi = (x1i; x2i; . . . ; xmi; xei)T as an observation at time i, the observation data matrix is represented by
For each sequence, the resulting embedding for each sequence becomes
Where i = 1; 2; . . .; N; j = 1; 2; . . .; m + 1.The multivariate phase space embedding can then be constructed as at each time i, where xji represents the phase space embedding for jth variable xj with the time delay j and dimension Qj at time i. The dimension Q of the multivariate embedding is the sum of each embedding dimension .
3.3 Reconstructed Phase Space with Transformation
linear tra the data linear co underlyin structural sequence Where 3.4 Gaus state. Lo features employed discrimin The appr informati can be co sequence data sequ time t can 3.5 Test the event whether o 3.6 Baye probabili statistics probabili to Bayes 3.7 Dual when the the assoc infeasible optimal) we maint
ansform on ph sequence. Ac onstant transf ng dynamic sy
l similarity be
es can be meas
ssian Mixture As mentioned cal temporal in classifying d the clusterin native approac roach propos ion that can b onsidered belo e can be consi
uences includ n then be repr
process In the testing ts in the targe or not an even esian inferenc Bayesian infe ity as additio
and patterns ity often calle
rule:
means given. by data (calle The evidence the prior prob , The probabili
the likelihood rather than o is so l simplex algo For the prim e optimality co ciated basis is
e basis. As de bases. At the tain primal fea
hase space emb ccording to th formation, the ystem. The E etween tempor
sured by
e Model Clas d in previous, structures an g patterns in c
ng method to ch characteriz sed here appl e incorporated ong to pattern idered as mix ding event seq resented by xt
g stage, we ap et sequence. A nt will occur. ce
erence is invo onal evidence i s, and especia d "Bayesian p
Stands ed evidence be
correspon bability, is the , the posterior ity of a hypoth Is the probab d. The likeliho
f .So, it sho ometimes term orithm
al simplex al onditions are s
dual feasible. escribed, the p
final (optimal asibility and d
beddings. As he theorem of e resulting fi uclidean dista ral patterns th
sification the data sequ d statistical p complex dyna o identify temp
zing patterns b lies a multiva d in the design n state, norma xture of three
quence are tre = {x1t; x2t; .
pply the predic At each time t
olved in which is needed. Ba ally in mathe probability. B
for any elow).
nds to data t e probability o r probability, hesis given the
bility of obse ood function s ows the eviden med the margin
gorithm, som satisfied. In th . Alternatively primal simple l) solution, the drive toward d
a result, the n f filtered dela iltered delay ance in the ne han in a traditio
And the si
is the in
uences are sep property of ex amic data seq mporal patterns
based on stati ariate Gaussia n of classifier al state or eve
classes of var eated as obser . . ; xmt; xet}
ctive pattern t, based on th
h Bayes' rule ayesian updat ematical. Bay
ayesian infere
Where denot y hypothesis w
that is new, a of before
is the probab e observed ev erving giv
should not be nce of the com nal likelihood
me elements in he event that a y, if some of t ex method wo e basis is both dual feasibility
new phase spa ay embedding mapping also ew phase spac
onal phase spa
imilarity of
nitial differen
parated by thr xplaining vari quence. Previo s. However, f istical correlat
an mixture m r, as well as in ent state accor riables, which rvations, the r } with dimensi
classifier obta he classificatio
is used to up ting makes a yesian inferen ence compute
tes a condition whose prob
and it is used is observe bility of g idence. ven .As a fu e confused wit mpatibility f d or "model ev
n row 0 will all elements o the elements o orks with prim h primal and d y. In this secti
ce gives a det g prevalence i o gives a va ce, therefore,
ace.
temporal str
ce of two sequ
ree states: nor iables can be ous work und few discussion
tions for a mu model to exp n the optimiza rding to even h represent rec
resulting mult ion m + 1.
ained in the tr on decision, a
pdate the hypo an important nce is used to s the posterio
nal probabilit bability m
d in the prior ed.
given , i.e.
unction of th
for the given h vidence".
be negative u of row 0 are no of row 0 are ne mal feasible, b
dual feasible. T ion, a variant
truded represe in Sauer et al alid embeddin
can better me
ructures betw
uences.
rmal, pattern, viewed as tw der the RPS fr ns were made ultivariate dat loit the discr ation. A data in
t function. He curring states.
tivariate vecto
raining stage a forecast will
othesis of a e t technique th o detect the s or probability
ty; more spec may be
r probability.
., after is
with fixe as a functi hypothesis.
until the final onnegative, w egative, we ha but dual infeas Throughout th of the primal
entation of l., given a ng of the easure the
ween two
and event wo sets of ramework e to apply ta system. riminative nstance xt ence, data . If all the or at each
to predict l be made
estimating hroughout subjective according ifically, it affected , observed.
ed, this is ion of
which, known as the dual simplex method. Throughout the process we maintain dual feasibility and drive toward primal feasibility. The dual simplex algorithm is most suited for problems for which an initial dual feasible solution is easily available.
3.8 Performance evaluation Accuracy rate
Accuracy is defined as the overall accuracy rate or classification accuracy and is calculated as
Accuracy= T TT TF F
True Positive rate
True Positive rate (TP rate), also called sensitivity or recall, is the proportion of actual positives which are predicted to be positive and is calculated as
TP = T T F True Negative rate
True Negative rate (TN rate), or specificity, is the proportion of actual negatives which are predicted to be negative and is calculated as
TN = T T F
4. ARCHITECTURE DIAGRAM
5. RESULTS AND DISCUSSION
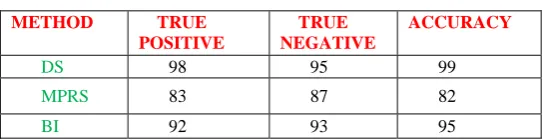
In this section, we are comparing the performance of the existing system such as MRPS-GMM classification with proposed system i.e., Bayesian inference in terms of classification accuracy, True Positive rate (TP rate) and True Negative rate (TN rate). To assess efficiency, we measured these comparison parameters for proposed system. From the end of this experimentation section, we can say that the proposed system has higher efficiency than the other techniques.
Dataset Training
dataset
Data categorization
Multivariate Phase space embedding ReconstructedPhase
space
Gaussian Mixture Model Classification
Bayesian inference classification
Test stage
Multivariate Phase space embedding
GMM classification
Performanceevaluation
Accurac Accuracy Accuracy Fig.1. sho methods comparis comparat True True Pos predicted Fig.2. show (existing conclude True Ne True Neg negative Fig.3. Sho (existing conclude y rate
y is defined as y= T
wed that compari
Accuracy rat (existing an son graph we
tively. Positive Rate sitive rate (TP d to be positiv
wed that comparis
TP rate is ma and proposed e as the pro
gative Rate gative rate (T
and is calcula
owed that compa
TN rate is ma and proposed e as the propos
s the overall a
T T
ison of the accura
e is mathema d proposed s e obtain concl
e P rate), also e and is calcu
son of TP parame
athematically d system) and oposed system
TN rate), or s ated as TN = T
arison of TN param
athematically d system) and sed system ha
70 80 90 100 110 AC 0% 20% 40% 60% 80% 100% 70 80 90 100 NE
ccuracy rate o
T F
acy parameter bet system
atically calcul system) and lude as the p
called sensitiv ulated as TP =
eter between the e B
calculated by d Y-axis will b
m has more specificity, is
T
T F
meter between th i.e.
calculated by d Y-axis will b s more effecti
CCURACY
TRUE
EGATIVE
or classificatio
F
tween the existin m i.e., Bayesian in
lated by using Y-axis will proposed syste
vity or recall = T T
existing system su Bayesian inferenc
y using formu be TP rate. Fr e effective M
the proportio
he existing system , Bayesian infere
y using formu be TN rate. Fr ive in TP perf
on accuracy an
ng system such tha nference.
g formula. As be accuracy em has more
, is the propo
F
uch that MRPS-G ce.
ula. As usual i rom view of t Min TP perf on of actual n
m such that MRPS ence.
ula. As usual i rom view of t formance com
nd is calculate
at MRPS-GMM c
s usual in the rate. From v e effective in
ortion of actu
GMM classificatio
in the graph X this TP comp formance.
negatives whi
S-GMM classifica
in the graph X this TN comp mparatively. MRPS BI DS DS BI MRPS MRPS BI DS ed as classification wit
e graph X-ax view of this
accuracy per
ual positives w
on with proposed
X-axis will be arison graph w
ich are predic
ation with propos
X-axis will be parison graph
th proposed
is will be accuracy rformance
which are
d system i.e.,
e methods we obtain . cted to be
sed system
e methods we obtain
TABLE 1: PERFORMANCE TABLE
METHOD TRUE
POSITIVE
TRUE NEGATIVE
ACCURACY
DS 98 95 99
MPRS 83 87 82
BI 92 93 95
6. CONCLUSION
In the existing work, presented a novel MRPS-GMM method for identifying temporal patterns predictive of events in a multivariate data system. However, in this work many disadvantages are there. Some of them are Gaussian Mixer Model Classifiers are often affected by over fitting problems when labeling errors occur far from the decision boundaries. To prevent this, we propose a new method which considers labeling errors independently of their distance to the decision boundaries. This is achieved by introducing binary latent variables that indicate when a given instance is considered to be an outlier (wrongly labeled instance) or not. The Bayesian inference is used to solve difficulty in learning problem. Model Evidence, Prediction and Outlier Identification are the three methods we proposed to improve GMM classifier. We also proposed a new classifier and an associated objective function that integrate both temporal pattern modeling in MRPS and Bayesian discriminative scoring for temporal pattern classification in multivariate data sequences. The experimentation result is show that the proposed system has higher classification accuracy compared to the existing system. 7.REFERENCE
[1] A. Dempster, N. Laird, and D. Rubin, “Maximum Likelihood from Incomplete Data via the EM Algorithm,” J. Royal Statistical Soc., Series B, vol. 39, no. 1, pp. 1-38, 1977.
[2] A.G. Capodaglio, H. Jones, V. Novotny, and X. Feng, “Sludge Bulking Analysis and Forecasting: Application of System Identification and Artificial Neural Computing Technologies,” Water Research, vol. 25, no. 10, pp. 1217-1224, 1991.
[3] A.M. Fraser and H.L. Swinney, “Independent Coordinates for Strange Attractors from Mutual Information,” Physical Rev. vol. 33, no. 2, pp. 1134-1146, 1986.
[4] A. Nanopoulos, R. Alcock, and Y. Manolopoulos, “Feature-Based Classification of Time-Series Data,” Int’l J. Computer Research, pp. 49-61, 2001.
[5] C. Faloutsos, M. Ranganathan, and Y. Manolopoulos, “Fast Subsequence Matching in Time-Series Databases,” Proc. ACM SIGMOD Int’l Conf. Management of Data, pp. 419-429, 1994.
[6] C.C. Aggarwal, J. Han, J. Wang, and P.S. Yu, “A Framework for Clustering Evolving Data Streams,” Proc. 29th Int’l Conf. Very Large Data Bases, pp. 81-92, 2003.
[7] C.-H. Lee, A. Liu, and W.-S. Chen, “Pattern Discovery of Fuzzy Time Series for Financial Prediction,” IEEE Trans. Knowledge and Data Eng., vol. 18, no. 5, pp. 613-625, May 2006.
[8] C.M. Bishop, Pattern Recognition and Machine Learning. Springer, 2007.
[9] D. Sciamarella and G. Mindlin, “Unveiling the Topological Structure of Chaotic Flows from Data,” Physical Rev. E, vol. 64, article 036209, 2001.
[10] D.B. Percival and A.T. Walden, Wavelet Methods for Time Series Analysis. Cambridge Univ. Press, 2000.
[11] E. Keogh, S. Chu, D. Hart, and M. Pazzani, “An Online Algorithm for Segmenting Time Series,” Proc. IEEE Int’l Conf. Data Mining, pp. 289-296, 2001.
[12] F. Takens, “Detecting Strange Attractors in Turbulence,” Dynamical Systems and Turbulence. Springer, 1981. [13] G. Box and G. Jenkins, Time Series Analysis: Forecasting and Control. Holden-Day, 1976.
[14] H. Kantz and T. Schreiber, Nonlinear Time Series Analysis. Cambridge Univ. Press, 1997.
[15] H. Wang, W. Fan, P.S. Yu, and J. Han, “Mining Concept-Drifting Data Streams Using Ensemble Classifiers,” Proc. Ninth ACM SIGKDD Int’l Conf. Knowledge Discovery and Data Mining, pp. 226- 235, 2003.
[16] H. Wang, J. Yin, J. Pei, P.S. Yu, and J.X. Yu, “Suppressing Model Overfitting in Mining Concept-Drifting Data Streams,” Proc. 12th
ACM SIGKDD Int’l Conf. Knowledge Discovery and Data Mining, pp. 736-741, 2006.
[17] J. Friedman, T. Hastie, and R. Tibshirani, “Additive Logistic Regression: A Statistical View of Boosting,” The Annals of Statistics, vol. 28, no. 2, pp. 337-407, 2000.
[18] J. Lin, E.J. Keogh, L. Wei, and S. Lonardi, “Experiencing SAX: a Novel Symbolic Representation of Time Series,” Data Mining and Knowledge Discovery, vol. 15, no. 2, pp. 107-144, 2007.
[19] J.J. Rodriguez and C.J. Alonso, “Interval and Dynamic Time Warping-Based Decision Trees,” Proc. ACM Symp. Applied Computing, pp. 548-552, 2004.
[20] J. Iwanski and E. Bradley, “Recurrence Plot Analysis: To Embed or Not to Embed,” Chaos, vol. 8, pp. 861-871, 1998.
[21] W. Zhang, X. Feng, and N. Bansal, “Detecting Temporal Patterns Using RPS and SVM in the Dynamic Data Systems,” Proc. IEEE Int’l Conf. Information and Automation, pp. 209-214, 2011.