Healthy food incentive impacts on direct-to-consumer sales:
A Michigan example
John Mann a * and Steve Miller a
Michigan State University, Department of Agricultural, Food, and Resource Economics
Jeff O’Hara b
U.S. Department of Agriculture, Agricultural Marketing Service
Laura Goddeeris c and Rich Pirog c
Michigan State University, Department of Community Sustainability
Elissa Trumbull d Fair Food Network
Submitted August 29, 2017 / Revised October 21 and November 30, 2017 / Accepted November 30, 2017 / Published online March 17, 2018
Citation: Mann, J., Miller, S., O’Hara, J., Goddeeris, L. Pirog, R., & Trumbull, E. (2018). Healthy food incentive impacts on direct-to-consumer sales: A Michigan example. Journal of Agriculture, Food Systems, and Community Development, 8(1), 97–112. https://doi.org/10.5304/jafscd.2018.081.006
Copyright © 2018 by the Authors. Published by the Lyson Center for Civic Agriculture and Food Systems. Open access under CC BY license.
Abstractp
Numerous interventions have been implemented at farmers markets across the United States in recent years in order to increase Supplemental Nutrition Assistance Program (SNAP) redemptions. These initiatives include ensuring that farmers markets have the technological capability of accepting SNAP and implementing financial incentive
programs that provide matching benefits for the redemption of SNAP benefits. While a main objec-tive behind these initiaobjec-tives is to increase revenue to direct marketing farmers, it is challenging to distinguish between the impacts of distinct inter-ventions. This shortcoming is a significant deter-rent in understanding how to effectively implement policies that enhance such objectives. We examine the impact of Double Up Food Bucks (DUFB), a prominent farmers market financial incentive pro-gram, on county-level direct-to-consumer (DTC) agricultural sales in Michigan. In our models, we distinguish between counties with farmers markets a Michigan State University, Department of Agricultural, Food,
and Resource Economics.
bUSDA, Agricultural Marketing Service.
c Michigan State University, Department of Community Sustainability.
d Fair Food Network.
* Corresponding author: John Mann, Department of Agricultural, Food, and Resource Economics, Michigan State University; 446 West Circle Drive, Room 87; East Lansing, MI 48824 USA; +1-517-353-2129; [email protected]
Funding disclosure
that do not accept SNAP, counties with markets that accept SNAP but not DUFB, and counties with markets that accept DUFB. We also estimate separate models that allow us to distinguish between the presence and magnitude of DUFB on county-level sales. We find that offering DUFB and accepting SNAP benefits were each associated with positive and statistically significant increases in direct marketing sales, and the magnitude of the DUFB coefficient was greater than the SNAP coefficient. Our preliminary evidence from coeffi-cient magnitudes also suggests that the county-level increase in direct sales exceeded the benefit levels.
Keywords
Double Up Food Bucks (DUFB); Supplemental Nutrition Assistance Program (SNAP); Farmers Markets; Direct-to-Consumer (DTC) Sales; Economic Model
Introduction
The conversion of the paper based “food stamp” program to the electronic Supplemental Nutrition Assistance Program (SNAP) created administrative impediments to the redemption of SNAP benefits at farmers markets and other direct marketing out-lets. Two main initiatives were subsequently under-taken to increase SNAP redemptions at farmers markets. These include installing electronic benefit transfer (EBT) machines at farmers markets so that markets are authorized SNAP retailers with the technology to accept benefits, and include pro-grams that provide incentives for the purchase of fruits and vegetables at farmers markets by match-ing the value of SNAP shoppers’ benefits. As a consequence of these cumulative initiatives, SNAP redemptions at farmers markets and with direct marketing farmers increased in nominal dollars from US$1.6 million in 2007 to US$20.2 million in 2016 (USDA Food and Nutrition Service [FNS], 2017). Also, almost 7,000 farmers markets and direct marketing farmers have been authorized SNAP retailers as of 2016, up from approximately 750 in 2008 (USDA FNS, 2017).
There are multiple motivations behind efforts intended to increase SNAP redemptions at farmers markets. One of the principle objectives is to increase the sales and revenue to direct marketing
farmers. Enhancing local food markets has been perceived as an economic development strategy since local food sales can have positive regional economic impacts (Hughes, Brown, Miller, & McConnell, 2007; Hughes & Isengildina-Massa, 2015; Jablonski, Schmit, & Kay, 2016; Miller, Mann, Barry, Kalchik, Pirog, & Hamm, 2015). However, one of the challenges with evaluating the impacts of efforts to increase SNAP redemptions at farmers markets is distinguishing between the relative impacts of the numerous interventions. In many instances, these interventions have occurred either simultaneously or within a relatively short timeframe of each other. For instance, installing a nutrition incentive program at a farmers market may “crowd out” expenditures that SNAP bene-ficiaries would otherwise make. Alternately, incen-tives could draw shoppers to the market whom would not normally not attend, and result in them making expenditures from other payment forms, such as cash, at the market which they would otherwise not make. The extra income from these transactions may also provide direct marketing farmers with an additional revenue stream. Under-standing how these disparate interventions comple-ment, or perhaps substitute, for each other is important in the design and implementation of policies for these purposes.
In this paper, we develop a county-level model to examine how the Double Up Food Bucks (DUFB) incentive program managed by the Fair Food Network (FFN) impacted 2012 direct mar-keting sales in Michigan. The DUFB program offers a dollar-for-dollar match of up to US$20 per market day for the redemption of SNAP benefits for Michigan grown fruits and vegetables at farm-ers markets. DUFB was initiated as a pilot program in 2009. While other similar financial incentive programs at farmers markets were also developed around the United States, DUFB is one of the most prominent programs, operating in more than 50 counties in Michigan, and used by customers to purchase fruits and vegetables more than 600,000 times between 2010 and 2016. To date, it operates in markets and grocery stores in 21 states, including Michigan.
SNAP, counties with markets that accept SNAP but not DUFB, and counties with markets that accept DUFB in addition to SNAP. We also esti-mate a separate model that allows us to distinguish between the presence and magnitude of DUFB on county-level sales. While our models do not inform us about the mechanisms by which changes in direct-to-consumer (DTC) agricultural sales may be impacted as a result of these initiatives, this paper provides one of the first attempts of distinct esti-mates of how financial incentive programs impact DTC sales.
Literature Review
At the intersection of the economic development and local food systems literature, the question has been raised about the potential impacts of incen-tive and benefits programs on sales at farmers markets (Bertmann, Ohri-Vachaspati, Buman, & Wharton, 2012; Broad Leib, 2013; Horst & Gaolach, 2015; Palma, Morgan, Woods, & McCoy, 2013; Sadler, 2016; Young, Karpyn, Uy, Wich, & Glyn, 2011).1This issue is relevant to policymakers
focused on expanding local and regional food systems, as SNAP benefit program recipients may represent new customers for regional and local food products (Oberholtzer, Dimitri, &
Schumacher, 2012; Sadler, 2016). Expanding sales at farmers markets has potential economic and social impacts through expanded regional markets for agricultural production and improved access and health outcomes associated with the consump-tion of more fruits and vegetables (Bell, Mora, Hagan, Rubin & Karpyn, 2013; Herman, Harrison, Afifi, & Jenks, 2008; Project for Public Spaces, 2013).
One challenge to identifying the relationships between incentive and benefits programs and their broader economic impacts is the availability of relevant data for such analyses.2Using a 2010
survey of 100 farmers markets across 16 states,
1Two other cited studies on the economic impacts of
increasing the food stamp program (FSP) are Hanson and Golan (2002) and Zandi (2009) who reported that a US$1 increase in FSP expenditures would lead to a US$1.84 and US$1.73 impact on broad economic activity, respectively. The context of these studies is important, as both were framed around addressing policies intended to manage recessions in
Oberholtzer, Dimitri, and Schumacher (2012) found that incentive programs for food assistance benefits contribute to increased sales at farmers markets. However, their sales data were statistically censored (five sales categories), limiting the level of analysis. Additionally, incentive programs were aggregated into a single indicator which did not allow for distinctions between different incentive programs. Similarly, Freedman, Marrison-Faye, Alia, Guest and Hébert (2014) reported that SNAP and Farmers Market Nutrition Program (FMNP) benefits provided increased sales revenue, as their analysis focused on the treatment effect from including in the “Shop N Save” (SNS) program (similar in concept to DUFB). However, their data were limited to a single farmers market in rural South Carolina and the analysis of variance method only considered whether revenues changed.
While the research on the economic impacts of benefit and incentive programs on local foods is limited, there are a handful of other studies that provide important insights to help frame the development of relevant economic models used in this study. For example, Sadler (2016) found that socioeconomically disadvantaged persons comprise a significant market segment relevant to farmers markets in Flint, Michigan. Based on a 2015 famers market consumer survey, Sadler also reported that about one quarter of respondents participated in benefit programs such as SNAP and DUFB. Prior work also supported the view that benefit program recipients, in many cases, are an important cus-tomer segment for farmers markets (Young et al., 2011). Therefore, providing the means for custom-ers to use benefits programs at farmcustom-ers markets may contribute to their willingness and/or ability to participate in farmers markets (Bertmann et al., 2012; Freedman et al., 2014; Hood, Martinez-Donate, & Meinen, 2012; Oberholtzer et al., 2012). More specifically, Bertmann et al. (2012) found that providing EBT machines terminals at selected
2001 and 2008 respectively, and were not intended to be applied to the economics of local food systems.
2 Other studies interested in the economics of local food
farmers markets in Arizona was correlated with increased average sales by about 72%. Finally, Saitone and McLaughlin (2017) found that par-ticipants in the Women, Infants and Children (WIC) program in California were more likely to fully utilize their benefits when redeeming them at farmers markets, rather than at other WIC retailers.
Estimating the economic impacts of redeeming food assistance benefits at farmers markets requires some assessment of the market place location and accessibility. Sadler (2016) reported that several supermarkets in the Flint area had recently closed, while the farmers market relocated to a more cen-tralized location that previously had limited outlets for fresh foods. Thus, the Flint farmers market studied fills an important gap as a venue for typical grocery shopping. Location may not be the only factor impacting whether or not low-income households patronize farmers markets. For example, Taylor and Villas-Boas (2016) found that low-income households travel further to shop at large grocers, superstores, and fast food outlets compared to farmers markets. One explanation for this finding is that consumers have preferences for processed and fast food that may outweigh desires to access a greater variety of locally produced fresh fruits and vegetables. It could also reveal a prefer-ence for conveniprefer-ence and/or one-stop shopping when access to transportation may be limited. Another explanation may be that the prices at farmers markets are perceived to be higher relative to those at more conventional grocers (Hood et al., 2012). However, there is no consensus in the litera-ture on differences that may exist between prices at DTC markets and prices for comparable products at traditional retail outlets (e.g., Valpiani, Wilde, Rogers, & Stewart, 2015).
SNAP in Michigan
Nationally, recent SNAP program declines follow a nearly three-fold increase in SNAP issuance across the U.S., not controlling for inflation or
3 We focus on this particular time period because this is the
same period during which the SNAP and DUFB data used in this study were collected by the Fair Food Network.
4 Values were estimated by summing the total SNAP dollars
redeemed at farmers markets participating in the DUFB
population, between 2004 and 2011 (USDA FNS, 2016). The biggest year to year jump occurred between 2009 and 2010, due in part to the 2009 American Recovery and Reinvestment Act. Upon sunset of the stimulus and given other economic and political factors, total SNAP expenditures in the U.S. declined from US$79.9 billion in FY 2013 to US$70.1 billion in FY 2016 (Dean & Rosenbaum, 2013; USDA FNS, 2016). This is also reflected in our study area, Michigan, as total SNAP redemptions declined by 24% between the years 2011 and 2015, which was a statewide reduction from US$3.1 billion to US$2.4 billion.3
Despite stretches of decline, by 2016, US$20.2 million in SNAP benefits had been redeemed at farmers markets and through direct marketing farmers nationally in nominal dollars, with 6,996 farmers markets and direct marketing farmers becoming authorized SNAP retailers (USDA FNS, 2016). Five percent (381) of nationally authorized farmers markets and/or direct marketing farmers in 2016 were in Michigan, and the state currently ranks third, behind California and New York, in total number of farmers markets accepting SNAP. Furthermore, Wayne County in Michigan, which contains Detroit, has been among the top five counties nationally in terms of the number of SNAP households redeeming benefits from farm-ers markets and direct marketing farmfarm-ers in 2011 and 2013-2016, while Genesee County in Michigan, which contains Flint, was among the top 5 counties nationally in 2011 and 2012.
Between 2011 and 2015, Michigan farmers markets that provided the DUFB program, which includes SNAP, increased their respective share of SNAP dollars captured at farmers market by 34.7%. In Table 1, the average share estimates at the county level for each year across all farmers markets that participated in the DUFB program are shown.4 The table also reveals that there is wide amount of variance in shares which may be
impacted by several factors such as the number of participating farmers markets in a county or the length of time farmers markets participated in the DUFB program. Despite the decline in SNAP issuances, Michigan farmers markets that offer DUFB, on average, have been able to collectively increase their relative shares.
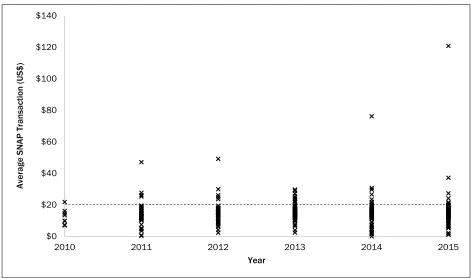
In Figure 1, we plot the average SNAP transaction values across all farmers markets that participated in the DUFB program between 2010
and 2015. While data are
aggregated to the farmers market level and across each market’s season, this figure provides some evidence that SNAP recipients are redeeming values above the US$20 dollar DUFB match value as several farmers markets had average transaction values above this mark. We highlight this point as it is one indicator that SNAP recipients are spending beyond the DUFB US$20 threshold.
Methods
Since other initiatives have been undertaken con-currently to increase SNAP redemptions at farmers markets, the objective of this study is to estimate distinct impacts of the issuance of DUFB while also allowing SNAP redemptions on DTC market activity. To accomplish this, we construct an economic model using Michigan county-level data. Table. 1 Average Share of SNAP Captured by Farmers Markets
Year
Share of SNAP issued a
Mean Std. Dev. Minimum Maximum
2011 0.0291% 0.0348% 0.0047% 0.1525%
2012 0.0362% 0.0963% 0.0002% 0.5232%
2013 0.0339% 0.0760% 0.0006% 0.4359%
2014 0.0367% 0.0964% 0.0006% 0.6017%
2015 0.0392% 0.0905% 0.0012% 0.5666%
a Values estimated at the county-level aggregate, and averaged across DUFB participating counties. Data are from Fair Food Network and USDA FNS.
Figure 1. Plot of Average SNAP Transactions in Farmers Markets Participating in the Double Up Food Bucks Program 2010–2015
$0 $20 $40 $60 $80 $100 $120 $140
2010 2011 2012 2013 2014 2015
Average SN
AP Transaction
(US$)
Year
We use total DTC sales from USDA’s Census of Agriculture (USDA, 2014) as a proxy for total farmers market sales in the county, as data on farmers market sales either from individual markets or at the county level were not available. The value of DTC sales in Michigan in 2012 was US$58.8 million nominally.
There are several caveats with this approxima-tion. First, DTC sales data in the Census of Agri-culture represent the sales of unprocessed and edible agricultural products that occur at any direct marketing venue. These can include farmers mar-kets but also encompass other direct marketing venues such as roadside stands, community sup-ported agriculture programs, and pick-your-own operations. For perspective, consider that farmers markets sales represented 18% of DTC sales in a five state region containing Michigan, Indiana, Illinois, Ohio, and Wisconsin in 2015 (USDA NASS, 2016). Second, the county-level DTC sales data represents the county where the agricultural operation resided, which may not always match the county where all of its farmers market transactions occurred. However, we believe this to be a reason-able approximation in the case of farmers markets, as 61% of agricultural operations selling at farmers markets traveled less than 20 miles to reach their highest grossing market, and 82% traveled less than 40 miles (USDA NASS, 2016).
The DUFB and SNAP data from farmers markets were collected between 2010 and 2015 by FFN. We provide a brief description of the DUFB and SNAP transaction data collection in Appendix A. The DTC sales data is only available for 2012 during the same period. Therefore, we consider the influence of DUFB and SNAP on the farmers markets sales proxy for only 2012 in our model. The empirical model is as follows:
=
+
where is the log of total DTC sales in county i,
5 See Greene (2012) for a detailed discussion on log
transformations in econometric modeling.
6While Michigan has 83 counties, Keweenaw County’s 2012
Census of Agriculture data are not disclosed as the county only has 6 farms and combined produced less than US$6,000 in market value in 2007 (USDA 2014). Therefore, this
is a vector of explanatory variables including the indicators for “SNAP only” and “DUFB participa-tion,” is a vector of the parameters to be esti-mated, and ~ (0,1) is the error term. Due to a high amount of variation across county-level obser-vations (discussed in the next section), we use the log of DTC to help control for potential hetero-scedasticity in the model.5
From the empirical model, we develop two sets of regression estimations. The first includes 82 county-level observations6 and the primary explan-atory variables of interest are indicator variables for counties with (1) the DUFB and SNAP program and (2) SNAP without the DUFB program (the indicator for neither program is dropped for esti-mation purposes). The second model is presented in Appendix B.7 The “DUFB” indicator identifies the presence of both DUFB and SNAP programs and is based on Michigan counties in 2012 with at least one farmers market that participated in the DUFB program. The “SNAP only” indicator identifies counties with at least one farmers market that accepted SNAP, but did not have any farmers markets participating in the DUFB program. This variable was constructed from two sources, USDA Agricultural Marketing Service (AMS) data avail-able from the USDA Economic Research Service (ERS) Food Environment Atlas (USDA ERS, 2017) and the FFN farmers market data indicating the presence of DUFB.
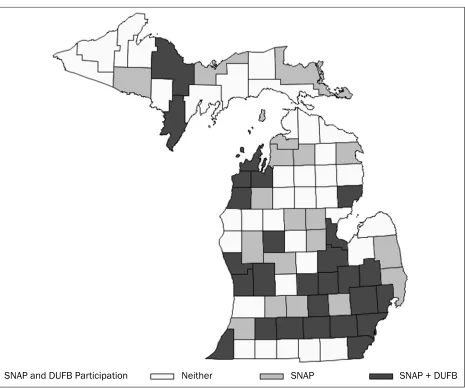
Because the DUFB leverages SNAP benefits, only farmers markets accepting SNAP are eligible to participate in the DUFB matching program. However, farmers markets that accept SNAP payments do not necessarily participate in the DUFB program. Within our data set, we identify three general groups of counties in the state: (1) those with at least one farmers market that accepts DUFB and SNAP; (2) those with at least one farmers market that accepts SNAP but not DUFB; and (3) those with farmers markets that do not
tion was dropped from the model in place of reporting it as zero.
7 A discussion of the motivation, methods, and results for the
accept either program. Thus, counties fell into one of the three categories as shown in Figure 2. There were a total of 46 counties with at least one famers markets that accepted SNAP in 2012, and 27 of them also participated in DUFB. The “SNAP only” indicator included the remaining 19 counties that accepted SNAP but that did not participate in the DUFB program. We use an indicator variable to track SNAP availability since county-level or market-level data on SNAP redemptions at all Michigan farmers markets and direct marketing venues is not available statewide.
We include per capita personal income (PCPI) (USDOC BEA, 2016) in log form to account for
the effect of income on DTC sales. While there is some debate in the local foods literature regarding the effect of income on farmers markets sales, income does play a role in food purchases by households (Gregory & Coleman-Jensen, 2013; Low & Vogel, 2011; Valpiani et al., 2016). Next, we include a proxy for food access by using the share of people in a county who commute to work using public transportation (USCB, 2016). Our motiva-tion here is that there are mixed results from studies considering the impact of food access on participation in farmers markets (Sadler, 2016; Taylor & Villas-Boas, 2016). We control for population (USDOC BEA, 2016) in place of Figure 2. 2012 Supplemental Nutrition Assistance Program (SNAP) and Double Up Food Bucks (DUFB) Participation in Michigan Farmers Markets, Aggregated to the County Level
Data sources: USDA ERS (2017) and original data from Fair Food Network.
scaling the dependent variable8 and we include regional indicators to control for regional-specific unobserved factors. We use regional indictors in place of county fixed effects since our data are cross-sectional only. Regions are based on the Michigan Department of Agriculture and Rural Development designations (MDARD, 2013).
The motivation for the design of our first model is to allow us to distinguish between the influence of the DUFB program and SNAP on DTC sales. Based on this model, we specifically consider the following three research questions: (1) would adding the DUFB program to farmers market in a county where it does not already exist in farmers markets increase DTC sales; (2) do SNAP recipients represent new customers to farmers markets, and thus, increase DTC sales; (3) does the addition of DUFB to farmers markets already accepting SNAP lead to an increase in sales above that provided by SNAP? We would interpret the first and second research questions as affirma-tive if the coefficients on the corresponding DUFB and SNAP variables, respectively, are positive and statistically significant from zero. We would con-clude that the third research question holds if the DUFB coefficient is larger than the SNAP coeffi-cient based on a statistical test of whether the DUFB parameter estimate is greater than the SNAP parameter estimate.
Results
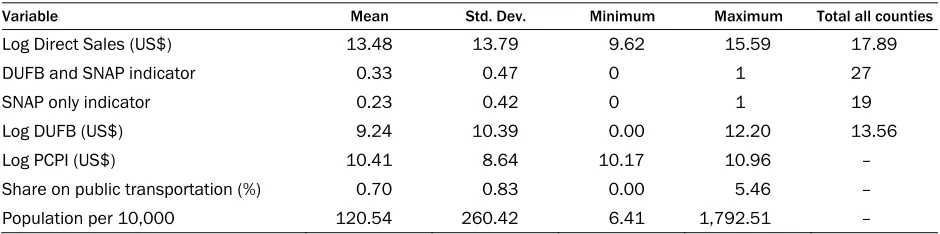
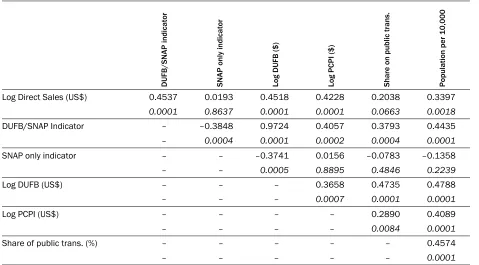
Summary statistics for our modeling data are presented in Table 2, and correlations results are
8The population parameter is small; therefore, population was
scaled to per 10,000 persons so the results would be visible
shown in Table 3. There is a high level of DTC sales variation across Michigan counties as DTC sales range for the 82 counties included in the model from US$15,000 to US$5.9 million (log DTC range is US$9.62 to US$15.59). The DTC variable is positively correlated with all variables, although the SNAP-only correlation is not statis-tically significant, and the highest level of corre-lation is with the DUFB and/or SNAP indicator. Total DUFB issued at farmers markets aggregated to the county-level range from US$0 (in counties where the program is not present) to US$0.2 million. Total DUFB issued across all participating farmers markets, in all counties included in the study, was about US$0.85 million in 2012.
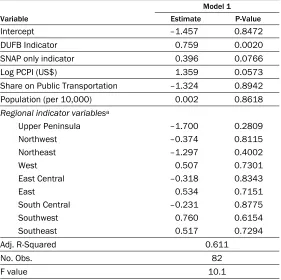
We use robust standard errors in the regression results presented in Table 4. We also report the p -values indicating the level of statistical significance of the parameters. The model 1 results9 reflect (1) DUFB and SNAP and (2) SNAP-only indica-tors as the independent variables of primary interest, and we use this model to test our three research questions presented above. Both primary variables are positive and statistically significant, as the DUFB indicator parameter is statistically sig-nificant at the 1% level and the SNAP-only indi-cator is statistically significant at the 10% level. We interpret the results as showing in a broad sense that they provide further support that incentive programs, in this case the DUFB and SNAP pro-grams separately, are positively related to increased DTC sales for counties with these kinds of pro-grams in place. Given our specific research
ques-(not reported as zero) in the table of results. .
9Model 2 results are presented in Appendix B. Table 2. Summary Statistics of County-Level Data in Regression Model, 2012
Variable Mean Std. Dev. Minimum Maximum Total all counties
Log Direct Sales (US$) 13.48 13.79 9.62 15.59 17.89
DUFB and SNAP indicator 0.33 0.47 0 1 27
SNAP only indicator 0.23 0.42 0 1 19
Log DUFB (US$) 9.24 10.39 0.00 12.20 13.56
Log PCPI (US$) 10.41 8.64 10.17 10.96 –
Share on public transportation (%) 0.70 0.83 0.00 5.46 –
tions, we further infer from the results that (1) adding both SNAP and the DUFB program to farmers markets in counties without them will also increase DTC sales in those counties (first research question); and (2) program recipients represent a new market segment of farmers market shoppers (second research question).
The DUFB parameter (0.757) is just under twice the size of the SNAP parameter (0.396). We find in a separate statistical test that the DUFB parameter is about 1.5 times the size of the SNAP parameter.10 This implies that the DUFB program contributes to additional DTC sales beyond those already provided by SNAP (addressing our third research question). For the control variables, only the log of PCPI is statistically significant and posi-tive. The magnitude of the log of PCPI is about 2 times the size of the DUFB indicator. This implies that income, or factors contributing to (or corre-lated with) higher levels of income, such as educa-tion, impact DTC sales. While the sign of the share of public transportation parameter is negative,
10We used the “test” syntax command in the SAS REG
gesting that reduced accessibility negatively impacts DTC sales, the parameter is not statistically signifi-cant. The sign of population (per 10,000) is posi-tive but is not statistically significant, and the intercept and regional indicators are also not statistically significant.
Discussion and Conclusion
The purpose of this study is to expand the current knowledge about the economic impact on DTC sales—and thus, on farmers market vendors— from incentive programs. Specifically, we focused on the Michigan DUFB program impacts on county-level DTC sales using a unique data set that combined 2012 Michigan farmers market SNAP and DUFB transaction data with USDA Census of Agriculture DTC sales and other county-level variables. The results from this study reveal important insights about benefits and incentive program impacts on DTC sales. First, our findings provide further support to previous work (e.g., Freedman et al., 2014; Oberholtzer et al., 2012;
procedure. Table 3. Correlations of County-Level Data in Regression Model, 2012
DUFB/SN
A
P
indicato
r
SN
AP o
nly
indicato
r
Log DUF
B
($)
Lo
g PC
PI
($
)
Share on public trans. Populatio
n per 10,000
Log Direct Sales (US$) 0.4537 0.0193 0.4518 0.4228 0.2038 0.3397
0.0001 0.8637 0.0001 0.0001 0.0663 0.0018
DUFB/SNAP Indicator – –0.3848 0.9724 0.4057 0.3793 0.4435
– 0.0004 0.0001 0.0002 0.0004 0.0001
SNAP only indicator – – –0.3741 0.0156 –0.0783 –0.1358
– – 0.0005 0.8895 0.4846 0.2239
Log DUFB (US$) – – – 0.3658 0.4735 0.4788
– – – 0.0007 0.0001 0.0001
Log PCPI (US$) – – – – 0.2890 0.4089
– – – – 0.0084 0.0001
Share of public trans. (%) – – – – – 0.4574
– – – – – 0.0001
Saddler, 2016) that benefits and
incentive program recipients, in this case SNAP and DUFB, are a market segment for farmers markets, and, where present, benefits and incentive programs help increase the sales revenue for farmers selling at DTC agricultural markets relative to where they are not in place. Further, this market segment has been one area of growth for Michigan farmers markets despite state-wide reductions in the level of SNAP benefits. Thus, we would expect that adding the DUFB program to counties where it is not present would result in additional sales at farmers markets.
Second, the DUFB program provides an economic benefit that is separate and in addition to that from the SNAP program. In particular, our results indicate that the presences of the DUFB program increases by about 50% the impact of that from the SNAP program on DTC agricultural market sales. This was reflected by the result that the DUFB indicator was about 1.5 times the
size of the SNAP only indicator. While the overall values appear relatively small, it is important to keep in mind that the DUFB program represents a fraction of total farmers market sales, and farmers market sales represent a percentage of DTC sales. As shown in Table 2, total DTC sales were about US$58.7 million in 2012 and total DUFB redemp-tions in farmers markets were about US$0.85 million (or 1.45% of total direct sales).
Our results also support finding from previous studies as well as expand the current understanding in terms of incentive program influences on farm-ers market sales. For example, Oberholtzer et al. (2012) reported that vendors perceived they experi-enced increased sales from farmers markets that participated in incentives program (such as SNAP). While their incentive programs parameter is posi-tive and statistically significant, it was generated from a logistic regression model and reported results did not include the marginal effects. Instead, their results are relative to the log-odds ratio for the incentive variable and not as intuitive in terms
of interpretation (Greene, 2012). Additionally, the different types of incentives potentially available at the farmers markets studied by Oberholtzer et al. (2012) were aggregated into a single indicator variable due to the nature of the survey question. Freedman et al. (2014) examined the influence of the SNS program, similar in concept to DUFB, at a single farmers market in South Carolina. While results indicated that the treatment effect of the SNS program resulted in increased farmers market sales, their analysis did not control for other factors that may have also influenced the outcome nor could it parse out the influence from other indi-vidual incentive programs. Parameter results reported in our study are elasticities which are easier to interpret. Further, our approach allowed incentives to be disaggregated into three groups (DUFB & SNAP, SNAP only, none).
Although we did not include the result from model 2 in the main results sections, instead placing it in Appendix B, they (combined with the information in Figure 1) suggest that some DUFB Table 4. Regression Results for Log Direct Sales Model 1, 2012
Variable
Model 1 Estimate P-Value
Intercept –1.457 0.8472
DUFB Indicator 0.759 0.0020
SNAP only indicator 0.396 0.0766
Log PCPI (US$) 1.359 0.0573
Share on Public Transportation –1.324 0.8942
Population (per 10,000) 0.002 0.8618
Regional indicator variablesa
Upper Peninsula –1.700 0.2809
Northwest –0.374 0.8115
Northeast –1.297 0.4002
West 0.507 0.7301
East Central –0.318 0.8343
East 0.534 0.7151
South Central –0.231 0.8775
Southwest 0.760 0.6154
Southeast 0.517 0.7294
Adj. R-Squared 0.611
No. Obs. 82
F value 10.1
a The dropped regional indicator includes Wayne County (Detroit metropolitan
recipients are spending more at farmers markets than just the matched SNAP and DUFB incentive. Since the DUFB program is a matching program to SNAP expenditures, we would expect to see about 1:2 ratio with respect to DUFB issued and DTC sales. In other words, for every US$1 of DUFB (which is matched with US$1 of SNAP, resulting in US$2 to spend) we expect to see a US$2 impact on DTC sales. Instead, this model estimates the ratio of influence about 1:9—i.e., US$1 of DUFB would lead on average to a US$9 increase in DTC sales. This estimate includes the contributions from SNAP and DUFB, and the amount in excess of US$2 may include other dollar contributions, for example, higher SNAP redemptions, other incen-tives and/or philanthropy, or out of pocket spend-ing from recipients. While we are concerned about the robustness of the model 2 results in the exact impact, when considered along with the evidence in figure 2 showing average transactions beyond the US$20 DUFB maximum allowable use, this provides some support that the contribution of at least some DUFB and SNAP recipients to DTC market activity in Michigan appears to exceed the combined dollar value of the DUFB and SNAP benefit.
While investigating these other potential sources of contributions, whether out of pocket or from other programs, is beyond the scope of this study, this notion of benefits and incentive pro-gram recipient expenditures exceeding the com-bined dollar value of the DUFB and SNAP is relevant for multiple reasons. The most obvious is the potential economic benefits to farmers and markets, as these additional purchases could trans-late into a multiplier-type effect with respect to recipient spending at farmers markets. It may also be possible to connect these economic benefits from the SNAP and DUFB programs offered at farmers markets to the health benefits and behav-iors of recipients related to their shopping at farmers markets. Implied additional spending on eligible farmers market products could also be translated into increased consumption of fruits and vegetables on the part of recipients, another of the motivating factors for offering these incentive programs. Going forward, it will be important to evaluate whether shopping and spending behaviors
continue as consumers transition off of food assistance benefits and incentives.
Third, this analysis highlighted areas for fur-ther study. While prior work has considered bene-fits and incentive program impacts in aggregate, the contribution of our study was to examine the benefit and incentive programs independently of one another. Though the two programs are linked, our results indicate that each program provides a separate impact. This may be true of other benefits and incentive programs, and could provide
important policy implications with respect to expenditure allocation; i.e., to what degree would changes in one program help or hamper another?
Finally, our experience during this study points to the need for improved local food data collection as this will help further advance our understanding of how financial incentives for food assistance benefits impacts local economic activity. One limitation of our study is that DUFB was exclu-sively administered at farmers markets, while we are using aggregated DTC sales data that includes farmers market sales in addition to other kinds of sales. Access to total sales data at the market level would enable more rigorous analysis of the influ-ence of benefits and incentives, but this is generally difficult if not impossible to obtain. Also, in recent years DUFB has been incorporated at grocery stores in Michigan, and there is not a publicly available secondary data source that tracks the purchases of local food products by grocery stores. We hope that this approach based on county-level DTC sales inspires further modeling using publicly-available data, as well as enhanced communication between researchers and farm and market stake-holders about the information necessary to evalu-ate economic implications of market activities and
interventions.
Acknowledgments
References
Bell, J., Mora, G., Hagan, E., Rubin, V., & Karpyn, A. (2013). Access to healthy food and why it matters: A review of the literature. Retrieved from http://thefoodtrust.org/uploads/media_items/access-to-healthy-food.original.pdf
Bertmann, F. M. W., Ohri-Vachaspati, P., Buman, M. P., & Wharton, C. M. (2012). Implementation of wireless terminals at farmers’ markets: Impact on SNAP redemption and overall sales. American Journal of Public Health, 102(7), e53–e55.
https://doi.org/10.2105/AJPH.2012.300727
Broad Leib, E. M. (2013). All (food) politics is local: Increasing food access through local government action. Harvard
Law and Policy Review, 7, 321–341. Retrieved from http://nrs.harvard.edu/urn-3:HUL.InstRepos:11189975
Dean, S., & Rosenbaum, D. (2013). SNAP benefits will be cut for nearly all participants in November 2013. Retrieved from https://www.cbpp.org/research/snap-benefits-will-be-cut-for-nearly-all-participants-in-november-2013 Freedman, D. A., Mattison-Faye, A., Alia, K., Guest, M. A., & Hébert, J. R. (2014). Comparing farmers’ market revenue
trends before and after the implementation of a monetary incentive for recipients of food assistance. Preventing
Chronic Disease, 11, 130347. https://doi.org/10.5888/pcd11.130347
Greene, W. H. (2012). Econometric analysis (7th ed.). Upper Saddle River, New Jersey: Prentice Hall.
Gregory, C. A., & Coleman-Jensen, A. (2013). Do high food prices increase food insecurity in the United States? Applied
Economic Perspectives and Policy, 35(4), 679–707. https://doi.org/10.1093/aepp/ppt024
Hanson, K., & Golan, E. H. (2002). Effects of changes in food stamp expenditures across the US economy. Retrieved from
https://www.ers.usda.gov/publications/pub-details/?pubid=46641
Herman, D. R., Harrison, G. G., Afifi, A. A., & Jenks, E. (2008). Effect of a targeted subsidy on intake of fruits and vegetables among low-income women in the Special Supplemental Nutrition Program for Women, Infants, and Children. American Journal of Public Health, 98(1), 98–105. https://doi.org/10.2105/AJPH.2005.079418
Hood, C., Martinez-Donate, A., & Meinen, A. (2012). Promoting healthy food consumption: A review of state-level policies to improve access to fruits and vegetables. Wisconsin Medical Journal, 111(6), 283–288. Retrieved from
https://www.ncbi.nlm.nih.gov/pubmed/23362705
Horst, M., & Gaolach, B. (2015). The potential of local food systems in North America: A review of foodshed analyses.
Renewable Agriculture and Food Systems, 30(5), 399–407. https://doi.org/10.1017/S1742170514000271
Hughes, D. W., Brown, C., Miller, S., & McConnell, T. (2007). Evaluating the economic impact of farmers’ markets using an opportunity cost framework. Journal of Agricultural and Applied Economics, 40(1), 253–265.
https://doi.org/10.1017/S1074070800028091
Hughes, D. W., & Isengildina-Massa, O. (2015). The economic impact of farmers’ markets and a state level locally grown campaign. Food Policy, 54, 78–84. https://doi.org/10.1016/j.foodpol.2015.05.001
Jablonski, B. B. R., Schmit, T. M., & Kay, D. (2016). Assessing the economic impacts of food hubs on regional economies: A framework that includes opportunity cost. Agricultural and Resource Economics Review, 45(1), 143–172.
https://doi.org/10.1017/age.2016.9
Low, S. A., & Vogel, S. (2011). Direct and intermediated marketing of local foods in the United States (Economic Research Report No. 128). Retrieved from https://www.ers.usda.gov/webdocs/publications/44924/8276_err128_2_.pdf?v=4105 Mann, J., & Shideler, D. (2015). Measuring Schumpeterian activity using a composite indicator. Journal of Entrepreneurship
and Public Policy, 4(1), 57–84. https://doi.org/10.1108/JEPP-07-2013-0029
Michigan Department of Agriculture and Rural Development (MDARD). (2013). Regional initiative to coordinate service
delivery, grow economy through local collaboration. Retrieved from
http://www.michigan.gov/snyder/0,4668,7-277-57577_57657-310340--,00.html
Miller, S. R., & Mann, J. T. (2016). On measuring the importance of local food to regional economies. Paper presented at Mid-Contenting Regional Science Association, Charlotte, North Carolina. Retrieved from
https://ww.researchgate.net/publication/303246064
Miller, S. R., Mann, J., Barry, J., Kalchik, T., Pirog, R., & Hamm, M. W. (2015). A replicable model for valuing local food systems. Journal of Agricultural and Applied Economics, 47(4), 441–461. https://doi.org/10.1017/aae.2015.19
Oberholtzer, L., Dimitri, C., & Schumacher, G. (2012). Linking farmers, healthy foods, and underserved consumers: Exploring the impact of nutrition incentive programs on farmers and farmers’ markets. Journal of Agriculture, Food
Palma, M. A., Morgan, K., Woods, T., & McCoy, S. (2013). Response of land grant universities to the increase in consumer demand for local foods in the South. Choices, 28(4). Retrieved from
http://www.choicesmagazine.org/UserFiles/file/cmstheme_342.pdf
Project for Public Spaces. (2013). Farmers markets as a strategy to improve access to healthy food for low-income families and
communities. Retrieved from https://www.pps.org/wp-content/uploads/2013/02/RWJF-Report.pdf
Sadler, R. C. (2016). Strengthening the core, improving access: Bringing healthy food downtown via a farmers’ market move. Applied Geography, 67, 119–128. https://doi.org/10.1016/j.apgeog.2015.12.010
Saitone, T. L., & McLaughlin, P. W. (2017). Women, Infants and Children (WIC) Program redemptions at California farmers’ markets: Making the program work for farmers and participants. Renewable Agriculture and Food
Systems. Advance online publication. https://doi.org/10.1017/S1742170517000102
Taylor, R., & Villas-Boas, S. B. (2016). Food store choices of poor households: A discrete choice analysis of the National Household Food Acquisition and Purchase Survey (FoodAPS). American Journal of Agricultural Economics, 98(2), 513– 532. https://doi.org/10.1093/ajae/aaw009
U.S. Census Bureau (USCB). (2016). American Community Survey (ACS). Retrieved from
https://www.census.gov/programs-surveys/acs/
U.S. Department of Agriculture (USDA). (2014). Census of Agriculture. Retrieved from
http://agcensus.usda.gov/index.php
U.S. Department of Agriculture, Economic Research Service (USDA ERS). (2017). Food Environment Atlas [Webtool]. Retrieved from https://www.ers.usda.gov/data-products/food-environment-atlas/
U.S. Department of Agriculture, Food and Nutrition Service (USDA FNS). (2016). SNAP state activity reports. Retrieved from https://www.fns.usda.gov/pd/snap-state-activity-reports
U.S. Department of Agriculture, Food and Nutrition Service (USDA FNS). (2017). SNAP retailer data. Retrieved from
https://www.fns.usda.gov/snap-retailer-data
U.S. Department of Agriculture, National Agricultural Statistics Service (USDA NASS). (2016). 2015 local food marketing
practices survey. Retrieved from https://agcensus.usda.gov/Publications/Local_Food/
U.S. Department of Commerce, Bureau of Economic Analysis (USDOC BEA). (2016). Regional economic accounts. Retrieved from http://www.bea.gov/regional/index.htm
Valpiani, N. H., Wilde, P. E., Rogers, B. L., & Stewart, H. G. (2016). Price differences across farmers markets, roadside stands, and supermarkets in North Carolina. Applied Economic Perspectives and Policy, 2(1), 2762–91.
https://doi.org/10.1093/aepp/ppv018
Young, C., Karpyn, A., Uy, N., Wich, K., & Glyn, J. (2011). Farmers’ markets in low income communities: Impact of community environment, food programs and public policy. Community Development, 42(2), 208–220.
https://doi.org/10.1080/15575330.2010.551663
Zandi, M. (2009). The economic impact of the American Recovery and Reinvestment Act. Moody’s Analytics, Economy.com. Retrieved from https://www.economy.com/mark-zandi/documents/Economic_Stimulus_House_Plan_
Appendix A
DUFB and SNAP Transaction data
For the direct sales models presented in this paper we only used the 2012 data (discussed in more detail in the methods section above). However, the discussion below includes information for the years 2011-2015. In these years, most markets disbursed incentives using a token based system at participating Michigan farmers market locations. At these locations, customers swiped their EBT card at the market’s information booth or at the farm stand. Customers received a 1:1 match in DUFB silver tokens, which were immediately
redeemable for Michigan-grown produce in the marketplace. Incentive tokens were universal and could be earned and spent at any participating market location throughout the state. Market staff tracked SNAP sales and incentive disbursement data at the point of sale in every market day on a paper ledger or Excel file. Market staff also collected and recorded redeemed tokens from participating vendors in the marketplace on a regular schedule.
Some locations have piloted electronic disbursement of incentive funds. At these outlets, EBT customers enrolled at a central booth on their first trip to the farmers market and then customers earned and spent incentive dollars directly with vendors in the marketplace. FFN has piloted two models for electronic disbursement:
• Flint Farmers Market incentive credits were stored on a separate card with magnetic strip, and vendors processed transactions at their stall on a hard-wired device that does not process EBT.
• Other electronic pilot sites used the Mobile Market Plus app, where incentive credits were stored on a customer’s EBT card in a separate, associated account. Vendors processed incentive transactions at their stall on the same wireless mobile device that processes EBT with the Mobile Market Plus app.
Token-based sites.Beginning in 2015, market outlets reported weekly transaction data on a monthly basis via the online Qualtrics survey software system. Program transaction data included weekly EBT and incentive dollars distributed and redeemed, the number of EBT and incentive transactions, and the number of new EBT customers at their market. Famers markets also provided market profile data (e.g., market hours of operation, location), vendor-specific data, and supporting documentation (e.g., EBT batch reports) once each season to FFN via completion of an online survey administered in March. Prior to 2015, farmers market outlets reported weekly transaction data on a monthly basis via an editable shared Google spreadsheet with other farmers markets and FFN. FFN manually transferred this data via cutting and pasting to master Excel file for analysis.
Appendix B
Model 2 Methods
To estimate the impact on a per dollar basis of DUFB issued on county-level DTC sales, we developed a second model using the log of DUFB issued in place of an indicator. Our second model is in the same form as model one, where is the log of total DTC sales in county i. In this case, however, is a vector of explanatory variables that includes the log of the DUFB value redeemed. Additionally, the second model only includes data from the 27 counties that had one or more farmers markets that participated in the DUFB program in 2012. We control for population and income in model 2, but drop the food access variable.
Similar to the previous model, we expect the DUFB parameter to be positive if this is a distinct customer segment shopping at farmers markets. Since both the DTC sales and DUFB variables are in log form, we interpret results in Model 2 as follows: a 1% change in DUFB would result in a percentage increase, if the parameter is positive, or decrease, if the parameter is negative, that corresponded to the DUFB parameter estimate. Our fourth research question to consider based on these results is: to what extent does increasing (decreasing) the magnitude of the DUFB program in counties’ farmers markets currently using the program increase DTC sales?
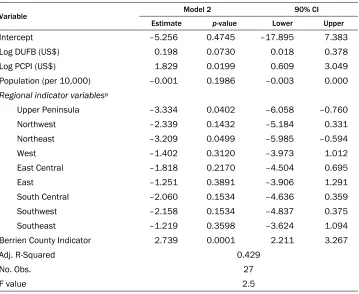
An initial assessment of a scatter plot of the data showed that Berrien County appeared as an extreme value, accounting for the highest share of total DTC sales (17% or US$5.9 M) among the 27 counties and one of the lowest shares of DUFB issued (US$786). To put this in perspective, we estimated the ratio of DTC sales to DUFB issued (DTC and/or DUFB) and found Berrien County’s ratio was 18 times larger than the county with the next highest share. Further analysis revealed that only one farmers market in Berrien County participated in the DUFB program in 2012, and that the prior year, 2011, was its first year to participate in SNAP. Additionally, this specific market was open about 50% less time than the average of other markets in the 27 county sample (98 days compared to the mean of 199 days). While individually considered, these factors are not unique. Combined, however, these factors likely contributed to Berrien County’s appearance as an extreme value in the data set. Therefore, we included an indicator for Berrien County in model 2 in place of dropping the observation.11
Model 2 Results
The results for the model 2 (shown in Table B1) reflect the use of the log of DUFB as the main independent variable and are used to test our fourth research question. Here, the log of the DUFB parameter is positive and statistically significant at the 10% level. Parameter results suggest that, on average, a 1% increase in the DUFB dollars redeemed at farmers markets would increase DTC sales by 0.198% (an elasticity of about 0.20). We use average values of the county-level parameters reported in Table 2 to estimate that issuing one
additional DUFB dollar at a farmers market would increase DTC sales in a county on average by US$9.31. We include the 90% confidence intervals (since the p-value is between 5-10% for the log DUFB) and estimate a range of DUFB impact. We find the range for issuing an additional DUFB dollar to be between US$0.85 and US$17.76.
Table B1. Regression Results for Log Direct Sales Model 2, 2012
Variable Model 2 90% CI Estimate p-value Lower Upper
Intercept –5.256 0.4745 –17.895 7.383
Log DUFB (US$) 0.198 0.0730 0.018 0.378
Log PCPI (US$) 1.829 0.0199 0.609 3.049
Population (per 10,000) –0.001 0.1986 –0.003 0.000
Regional indicator variablesa
Upper Peninsula –3.334 0.0402 –6.058 –0.760
Northwest –2.339 0.1432 –5.184 0.331
Northeast –3.209 0.0499 –5.985 –0.594
West –1.402 0.3120 –3.973 1.012
East Central –1.818 0.2170 –4.504 0.695
East –1.251 0.3891 –3.906 1.291
South Central –2.060 0.1534 –4.636 0.359
Southwest –2.158 0.1534 –4.837 0.375
Southeast –1.219 0.3598 –3.624 1.094
Berrien County Indicator 2.739 0.0001 2.211 3.267
Adj. R-Squared 0.429
No. Obs. 27
F value 2.5
a The dropped regional indicator includes Wayne County (Detroit metropolitan area).