Impact of Income and Income Inequality on Infant
Health Outcomes in the United States
WHAT’S KNOWN ON THIS SUBJECT: The relationship between income inequality and health outcomes has been explored extensively for adults. However, relatively little is known about the impact of income inequality on infant health outcomes in the United States in the past decade.
WHAT THIS STUDY ADDS: This study demonstrates that both income and income inequality affect infant health in the United States. Also, the study documents that the health of the poorest infants in our country is affected more by absolute income than by relative income.
abstract
OBJECTIVES:The goal was to investigate the relationships of income and income inequality with neonatal and infant health outcomes in the United States.
METHODS:The 2000 –2004 state data were extracted from the Kids Count Data Center. Health indicators included proportion of preterm births (PTBs), proportion of infants with low birth weight (LBW), pro-portion of infants with very low birth weight (VLBW), and infant mortal-ity rate (IMR). Income was evaluated on the basis of median family income and proportion of federal poverty levels; income inequality was measured by using the Gini coefficient. Pearson correlations evaluated associations between the proportion of children living in poverty and the health indicators. Linear regression evaluated predictive relation-ships between median household income, proportion of children living in poverty, and income inequality for the 4 health indicators.
RESULTS:Median family income was negatively correlated with all birth outcomes (PTB,r⫽ ⫺0.481; LBW,r⫽ ⫺0.295; VLBW,r⫽ ⫺0.133; IMR, r⫽ ⫺0.432), and the Gini coefficient was positively correlated (PTB,r⫽0.339; LBW,r⫽0.398; VLBW,r⫽0.460; IMR,r⫽0.114). The Gini coefficient explained a significant proportion of the variance in rate for each outcome in linear regression models with median family income. Among children living in poverty, the role of income decreased as the degree of poverty decreased, whereas the role of income in-equality increased.
CONCLUSIONS:Both income and income inequality affect infant health outcomes in the United States. The health of the poorest infants was affected more by absolute wealth than relative wealth.Pediatrics2010; 126:1165–1173
AUTHORS:Maren E. Olson, MD, MPH,aDouglas Diekema,
MD, MPH,b,cBarbara A. Elliott, PhD,d,eand Colleen M.
Renier, BSf
aDepartment of Pediatrics, Children’s Hospitals and Clinics of
Minnesota, Saint Paul, Minnesota;bTreuman Katz Center for
Pediatric Bioethics, Seattle Children’s Hospital, Seattle, Washington;cDepartment of Pediatrics, School of Medicine,
University of Washington, Seattle, Washington;dDepartment of
Family Medicine and Community Health andeCenter for
Bioethics, School of Medicine, University of Minnesota, Duluth, Minnesota; andfEssentia Institute of Rural Health, Essentia
Health, Duluth, Minnesota
KEY WORDS
income inequality, infants, median family income, infant mortality rate, low birth weight
ABBREVIATIONS
SES—socioeconomic status PTB—preterm birth LBW—low birth weight VLBW—very low birth weight IMR—infant mortality rate FPL—federal poverty level
Accepted for publication Aug 27, 2010
www.pediatrics.org/cgi/doi/10.1542/peds.2009-3378
doi:10.1542/peds.2009-3378
Address correspondence to Maren E. Olson, MD, MPH, Children’s Hospitals and Clinics of Minnesota, 347 Smith Ave N., Suite 302, Saint Paul, MN 55102-3355. E-mail: maren.olson@childrensmn. org
PEDIATRICS (ISSN Numbers: Print, 0031-4005; Online, 1098-4275).
Copyright © 2010 by the American Academy of Pediatrics
The World Health Organization1 re-ported recently that, throughout the world, poor children have worse health outcomes than do nonpoor chil-dren, an assertion that is supported by a wide range of health indicators. In-fant mortality rates (IMRs) have been shown to be inversely related to socio-economic status (SES).2–5 Decreasing maternal educational level and de-creasing family income are each asso-ciated with increasing IMRs.4,5 Poor children also are more likely than non-poor children to have low birth weight (LBW) (⬍2500 g), to be diagnosed as having asthma, to have any type of chronic health condition, and to have activity limitations because of a chronic health condition.6In addition, infants of lower SES have greater risk of persistent respiratory symptoms than do infants of higher SES.7Finally, both individual-level and population-level associations between lower SES and increased risk of obesity among youths have been identified.8
Interestingly, poverty alone does not entirely explain these findings. When considered at the population level, the absolute level of poverty does not seem to explain fully the worse health outcomes of poor individuals.9–13Once individuals and families are able to meet their basic needs, their relative income (ie, how their income com-pares with that of the people living around them) seems to play an in-creasing role in determining the health outcomes of the community in which they live.9,10 Wilkinson14,15 sug-gested that once a society progresses beyond the point of absolute depriva-tion and people are able to meet their basic needs, then it is the distribution of income within the society that af-fects health outcomes. He referred to this transition point as the epidemio-logical transition.
The idea that the distribution of in-come within a society may affect
health outcomes for the population has become known as the income in-equality hypothesis. According to this hypothesis, health outcomes for a community worsen as the gap be-tween rich and poor individuals in the community increases.
The income inequality hypothesis has been explored extensively in the litera-ture,9–12,16with the vast majority of the research focusing on adult health out-comes. The results of such studies are mixed, with some supporting the hy-pothesis that greater income disparity within communities, states, or na-tions leads to worse health out-comes9,10,12,14,17–21 and others refuting such an association.22–26 Only a small proportion of the published studies ex-amined the impact of income inequal-ity on infant and child health. The pedi-atric health indicators for which the relationship with income inequality has been investigated are neonatal mortality rates, IMRs, child mortality rates, preterm birth (PTB) rates, LBW birth rates, child overweight status, mental health problems, bullying, teen violence, teen pregnancy rates, and high school dropout rates.27,28 Pub-lished studies have examined various populations, including those of devel-oping nations, countries belonging to the Organization for Economic Cooper-ation and Development, counties and states within the United States, and subsets of other nations’ populations. As in the adult literature, the findings are mixed, but the majority of studies supported an association between each of the indicators and income inequality.27– 40
The impact of income inequality on in-fant and child health is a particularly pressing question in the United States, because the gap between rich and poor individuals in this country has in-creased significantly in the past 40 years. Income inequality, as deter-mined with the Gini coefficient, a
widely accepted statistical measure of income disparity, has increased⬃16% for US households since 1967.9,10,41,42An increase in the Gini coefficient indi-cates increasing income disparity within a population. A significant por-tion of the increase in the Gini coeffi-cient for US households occurred re-cently; between 1997 and 2007, the Gini coefficient increased 3.3%.43However, most published studies that examined infant and child health and income in-equality within the United States did not include data from the current de-cade. This study was designed to exam-ine the associations of both income and income inequality with neonatal and infant health by focusing on 4 key indicators: PTB rate, proportion of in-fants with LBW, proportion of inin-fants with very low birth weight (VLBW), and IMR during the years 2000 to 2004.
METHODS
Data Sources and Measures
Data on health indicators, family in-come, and children living in poverty were obtained from the Annie E. Casey Foundation Kids Count Data Center Web site, a comprehensive, publicly available database of child health and well-being that compiles original data from a variety of sources. Data were extracted from the data set by the au-thors for all 50 US states for the years 2000 to 2004. Neonatal and infant health indicators included PTB rate (proportion of live-born infants born at
poverty level [FPL], 50% to⬍100% of FPL, 100% to⬍150% of FPL, and 150% to ⬍200% of FPL). These categories parallel the fact that many programs and services (eg, Medicaid and State Children’s Health Insurance Program) are allocated on the basis of grada-tions of poverty, which potentially leaves infants living in lesser degrees of poverty with differing access to health care.
Income inequality was measured by using the Gini coefficient, a statistical measure of income distribution based on the Lorenz curve, with values rang-ing from 0 to 1. A lower value indicates more-equal distribution of wealth in a population, whereas a higher value in-dicates greater disparity.16The US Cen-sus Bureau calculates the Gini coeffi-cient for each state annually. Gini coefficients for each state for the years 2000 –2004 were obtained di-rectly from the US Census Bureau Cur-rent Population Survey.
Data Analyses
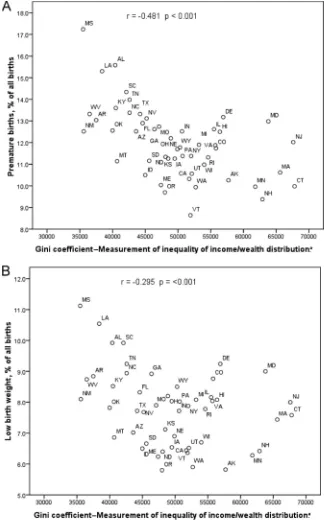
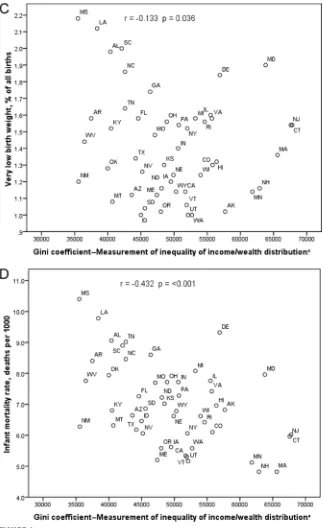
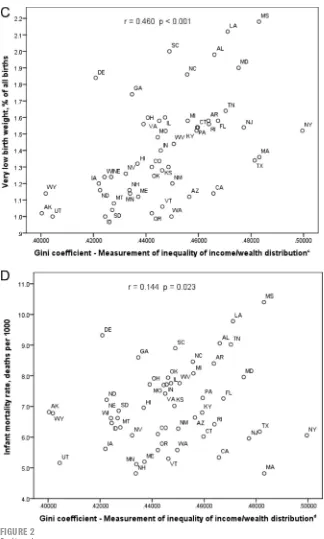
Mean state data across the 5 years (2000 –2004) were used for represen-tational graphics prepared from the study data (Figs 1 and 2). However, all statistical analyses included data for each state for each year, with each analysis adjusted for year whenever statistically significant yearly variation existed.
Pearson correlations evaluated the as-sociations between the proportion of children living in poverty (⬍50% of FPL, 50 to⬍100% of FPL, 100 to⬍150% of FPL, or 150 to⬍200% of FPL) and the 4 health indicators (PTB rate, LBW rate, VLBW rate, and IMR). Linear regression analyses were performed to identify associations between the 4 neonatal and infant health indicators (PTB rate, LBW rate, VLBW rate, and IMR), median income, poverty (⬍50% of FPL, 50 to
⬍100% of FPL, 100 to⬍150% of FPL, or 150 to⬍200% of FPL), and income
in-equality. Initial linear regression mod-els included year (when statistically significant), median family income, and Gini coefficient as the potential predictors of the 4 health indicators (Table 1). Secondary stepwise linear
regression analyses assessed the ef-fect of each level of poverty (⬍50% of FPL, 50 to⬍100% of FPL, 100 to⬍150% of FPL, or 150 to⬍200% of FPL) sepa-rately, by including year as appropri-ate, poverty category individually, and
FIGURE 1
then Gini coefficient as the potential predictors of the 4 health indicators, to determine whether there were trends in the amounts and proportions of the variance explained by poverty and Gini coefficient across increasing poverty levels.
RESULTS
The median family income for the 50 US states during the 5-year period of our study was $48 900 (25th percen-tile: $43 435; 75th percenpercen-tile: $54 500). The lowest median income was in West
Virginia ($31 400) and the highest was in New Jersey ($76 200). The mean Gini coefficient was 0.447 (SD: 0.025), with the lowest value being that for Alaska in 2001 (Gini coefficient: 0.389) and the highest being that for New York in 2001 (Gini coefficient: 0.515). The PTB rates ranged from 8.2% (Vermont in 2000) to 17.9% (Mississippi in 2004), with a mean of 12% (SD: 1.7%). The propor-tion of infants born with LBW was smallest in Oregon in 2001 (5.5%) and largest in Mississippi in 2004 (11.6%), with an overall mean of 7.8% (SD: 1.3%). The VLBW rate ranged from 0.8% in Alaska in 2000 to 2.3% in Louisiana in 2001, with a mean of 1.4% (SD: 0.3%). Finally, the mean IMR was 7.0 deaths per 1000 live births (SD: 1.4 deaths per 1000 live births). The lowest rate was 3.8 deaths per 1000 live births in New Hampshire in 2001, whereas Missis-sippi in 2000 and Delaware in 2001 tied for highest rate, at 10.7 deaths per 1000 live births.
Median family income was negatively correlated with PTB rate, LBW rate, VLBW rate, and IMR (Fig 1). Linear re-gression analyses evaluated the asso-ciations between these outcomes and year (when significant), median family income (in thousands), and Gini coeffi-cient (Table 1). Median family income was found to explain a statistically sig-nificant proportion of the variance in rate for each of the outcomes, as rep-resented by the associatedR2change values, with decreasing income levels being associated with worse health outcomes for neonates and infants with respect to all 4 outcome vari-ables. The health indicator with the largest proportion of variance ex-plained by median family income was PTB rate, with the smallest proportion for VLBW rate.
Income inequality, as measured with the Gini coefficient, was positively cor-related with PTB rate, LBW rate, VLBW rate, and IMR (Fig 2). Income inequality
FIGURE 1
also was positively associated with all 4 health indicators when included in linear regression models with median family income (Table 1). Income in-equality explained a statistically signif-icant proportion of the variance in rate for each outcome. The infant health in-dicator with the largest proportion of variance explained by income inequal-ity was VLBW rate, with the smallest proportion for IMR.
Additional analyses were performed to assess 4 categories of poverty (⬍50% of FPL, 50 to ⬍100% of FPL, 100 to
⬍150% of FPL, or 150 to ⬍200% of FPL). As shown in the correlation anal-ysis in Table 2, the strongest correla-tions existed between all 4 health indi-cators (PTB rate, LBW rate, VLBW rate, and IMR) and the proportion of chil-dren living at⬍50% of the FPL, with the correlations gradually decreasing as the level of poverty decreased. Linear regression analyses evaluated the as-sociations between these 4 outcomes and year (if significant), each of the 4 levels of poverty (separately), and Gini coefficient (Table 3). Poverty levels demonstrated that the poorest infants’ health was affected more by poverty than by income inequality. This trend gradually reversed for infants living in lesser degrees of poverty.
DISCUSSION
New Findings
This study supports and extends previ-ous research that demonstrated the role of both income and income in-equality in determining infants’ health outcomes. These data documented that significant proportions of the vari-ance in PTB rates, LBW rates, VLBW rates, and IMRs could be attributed to the combined impact of income and in-come inequality. The study also yielded interesting findings regarding the im-pact of income and income inequality on children living with different de-grees of poverty.
This study adds to the existing litera-ture in 2 important ways. First, it shows that, among 4 subsets of pov-erty, neonatal and infant outcomes
im-proved as the amount of income in-creased; the poorest children had the worst outcomes. The results of this study document that the health of the
FIGURE 2
poorest infants in our country is af-fected more by absolute income than by relative income. Therefore, on the basis of the explanation proposed by Wilkinson,15it can be argued that the United States has not fully made the epidemiological transition, a
conclu-sion that is both surprising and trou-bling. It is surprising because the United States is one of the richest na-tions in the world,9and it is troubling because it suggests that the basic needs of the poorest children in this country are not being met. These
re-sults suggest that the public programs designed to serve the health needs of the poorest infants in this nation may not be meeting those needs.
Second, by considering 4 key indica-tors of infant health, this study pro-vides a comprehensive examination of the relationship between infant health and both income and income inequal-ity. Income inequality explained little of the variation in infant outcomes in states with larger proportions of chil-dren in the lowest income categories, but income inequality explained more of the variation in states with larger proportions of children in higher in-come categories.
Study Strengths and Limitations
This study has several important strengths. Most existing studies per-taining to income inequality and pedi-atric health outcomes included only simple correlations. This study used regression analysis to define further the amount of variance in infant health outcomes attributable to both income and income inequality. The findings add support to the hypothesis that in-come inequality affects infants’ health outcomes.
In addition, the study used recent data and thus provides a better reflection of the current social and political climate in the United States, compared with most previous studies. The data do not reflect the recent downturn in the economy and subsequent unemploy-ment, which likely have further af-fected birth outcomes negatively. De-spite that, the results offer a useful comparison with historical data, par-ticularly because most existing studies used data from periods before the 1990s welfare reforms.
One important limitation of the study is that it was based on aggregate state-level data. Despite the lack of individual-level data, the results add important information to the research
FIGURE 2
on income, income inequality, and in-fant health outcomes. Future studies based on both individual-level health and income data and population-level data should be useful for further delin-eation of these relationships.
The analysis also was limited to a rel-atively small number of infant health outcomes, and several of those (PTB, LBW, and VLBW rates) can be signifi-cantly affected by maternal factors. The results may be more a reflection
of the impact of inequality on preg-nant women’s health than a descrip-tion of the impact of income inequal-ity on infants’ health. Future studies are needed to explore the relation-ships between income inequality and a wider range of pediatric health indictors.
Other investigators included racial composition as a variable in similar analyses and documented that Gini co-efficients were correlated with LBW
rates before but not after correction
for state racial composition.44 Racial
composition was not included in the
current study for 2 reasons. First,
ra-cial composition is too highly
corre-lated with income inequality to allow for their respective effects on health outcomes to be determined by using regression analysis.45 Second, it can
be argued that the association be-tween income inequality and infants’ health is relevant regardless of the ra-cial composition of the population. Within the United States, there is
re-gional variation in the racial composi-tion of the populacomposi-tion. Although race is worth noting in any study of the asso-ciations between income inequality
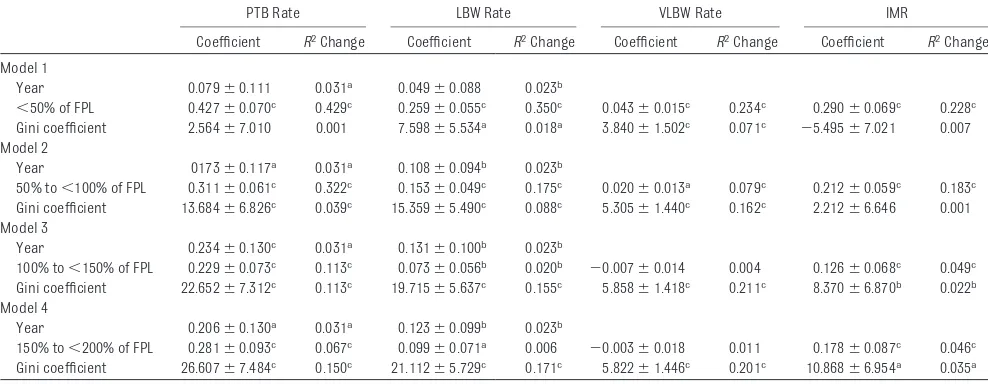
and health, it is not a population-level variable that could or should be al-tered through public health or policy TABLE 1 Regression Models for Neonatal and Infant Health Outcomes and Median Family Income, Gini Coefficient, and Year
PTB Rate LBW Rate VLBW Rate IMR
Coefficient R2Change Coefficient R2Change Coefficient R2Change Coefficient R2Change
Year 0.298⫾0.118a 0.031b 0.166⫾0.096b 0.023c
Median income ⫺0.103⫾0.020a 0.269a ⫺0.047⫾0.016a 0.106a ⫺0.004⫾0.004c 0.018c ⫺0.072⫾0.019a 0.186a
Gini coefficient 20.795⫾6.604a 0.095a 18.910⫾5.379a 0.142a 5.813⫾1.410a 0.023a 7.232⫾6.368c 0.016c
aP⬍.001. bP⬍.01. cP⬍.05.
TABLE 2 Pearson Correlations for Neonatal and Infant Health Outcomes and FPL Categories
r
PTB Rate LBW Rate VLBW Rate IMR
⬍50% of FPL 0.675a 0.608a 0.484a 0.477a
50% to⬍100% of FPL 0.575a 0.425a 0.281a 0.428a
100% to⬍150% of FPL 0.316a 0.126b ⫺0.061 0.221a
150% to⬍200% of FPL 0.252a 0.073 ⫺0.106 0.215a
aP⬍.001. bP⬍.05.
TABLE 3 Regression Models for Neonatal and Infant Health Outcomes and Proportions Within Each FPL Category, Gini Coefficient, and Year
PTB Rate LBW Rate VLBW Rate IMR
Coefficient R2Change Coefficient R2Change Coefficient R2Change Coefficient R2Change
Model 1
Year 0.079⫾0.111 0.031a 0.049⫾0.088 0.023b
⬍50% of FPL 0.427⫾0.070c 0.429c 0.259⫾0.055c 0.350c 0.043⫾0.015c 0.234c 0.290⫾0.069c 0.228c
Gini coefficient 2.564⫾7.010 0.001 7.598⫾5.534a 0.018a 3.840⫾1.502c 0.071c ⫺5.495⫾7.021 0.007
Model 2
Year 0173⫾0.117a 0.031a 0.108⫾0.094b 0.023b
50% to⬍100% of FPL 0.311⫾0.061c 0.322c 0.153⫾0.049c 0.175c 0.020⫾0.013a 0.079c 0.212⫾0.059c 0.183c
Gini coefficient 13.684⫾6.826c 0.039c 15.359⫾5.490c 0.088c 5.305⫾1.440c 0.162c 2.212⫾6.646 0.001
Model 3
Year 0.234⫾0.130c 0.031a 0.131⫾0.100b 0.023b
100% to⬍150% of FPL 0.229⫾0.073c 0.113c 0.073⫾0.056b 0.020b ⫺0.007⫾0.014 0.004 0.126⫾0.068c 0.049c
Gini coefficient 22.652⫾7.312c 0.113c 19.715⫾5.637c 0.155c 5.858⫾1.418c 0.211c 8.370⫾6.870b 0.022b
Model 4
Year 0.206⫾0.130a 0.031a 0.123⫾0.099b 0.023b
150% to⬍200% of FPL 0.281⫾0.093c 0.067c 0.099⫾0.071a 0.006 ⫺0.003⫾0.018 0.011 0.178⫾0.087c 0.046c
Gini coefficient 26.607⫾7.484c 0.150c 21.112⫾5.729c 0.171c 5.822⫾1.446c 0.201c 10.868⫾6.954a 0.035a
interventions. On the basis of the re-sults of this study, part of the solution to the very real problem of health dis-parities experienced by minority popu-lations46is to decrease the degree of absolute and relative poverty they experience.
Future Research Questions
By focusing on infant health indicators, this study provides an initial look at the role of income and income inequality in children’s health. Further research should examine other pediatric health indicators, including childhood mor-tality rates, teen mormor-tality rates, teen pregnancy rates, and rates of specific diagnoses such as asthma, obesity, and respiratory infections. It also would be useful to examine the relative contributions of neonatal death and postneonatal death to IMRs, as well as the impact of income inequality on each of these outcomes, because Shi et al19suggested that income inequal-ity affects neonatal mortalinequal-ity rates more than postneonatal mortality rates.
Although this study does suggest causal relationships between both
in-come and inin-come inequality and infant health outcomes in the United States, future studies will need to explore fur-ther the pathways that produce these relationships. For future research projects, the model suggested by Mayer and Sarin32 may provide a framework to approach these issues. They described 4 potential mecha-nisms linking income inequality and IMRs, namely, nonlinearity in the rela-tionship between parents’ income and infant death, economic segregation, social resources (eg, state health care spending), and psychosocial mecha-nisms. An additional approach that may offer insight in future analyses is further investigation of psychosocial determinants, including maternal edu-cation level, because this has been shown to affect both family income level47and IMRs.48
CONCLUSIONS
The results of this study show that sig-nificant proportions of the variance in the PTB rate, LBW rate, VLBW rate, and IMR among US states in 2000 –2004 can be attributed to the combined impact of income and income inequality.
These findings support the hypothesis that both income and income inequal-ity affect infants’ health outcomes. In-deed, they strengthen this position, in that the regression results presented here suggest potential causal relation-ships of both median income and Gini coefficients with the outcomes of interest.
Many studies have shown that access to health care plays an important role in ensuring good pediatric health out-comes. However, the results of this study suggest that the public pro-grams designed to meet the health needs of the poorest infants in this na-tion may not be adequately meeting those needs. This implies that ensur-ing health care access for all may not be sufficient; it also may be necessary to focus on interventions that address poverty and decrease income inequal-ity to make significant improvements in infant health outcomes in this coun-try. While our lawmakers consider how to build this into future health and so-cial policies, as pediatric clinicians we must continue to be especially atten-tive to the health needs of our poorest patients.
REFERENCES
1. Commission on Social Determinants of Health. Closing theGap in a Generation: Health Equity Through Action on the Social Determinants of Health: Final Report on the Commission on Social Determinants of Health. Geneva, Switzerland: World Health Organization; 2008
2. Kehrer BH, Wolin CM. Impact of income maintenance on low birth weight: evidence from the Gary Experiment.J Hum Resour. 1979;14(4):434 – 462
3. Wang C, Guttmann A, To T, Dick PT. Neighbor-hood income and health outcomes in in-fants.Arch Pediatr Adolesc Med. 2009; 163(7):608 – 615
4. Singh G, Yu S. Infant mortality in the United States: trends, differentials, projection, 1950 –2010.Am J Public Health. 1995;85(7): 957–964
5. Singh G, Kogan M. Persistent socioeco-nomic disparities in infant, neonatal, and postneonatal mortality rates in the United
States, 1969 –2001.Pediatrics. 2007;119(4). Available at: www.pediatrics.org/cgi/ content/full/119/4/e928
6. Currie J, Lin W. Chipping away at health: more on the relationship between income and child health. Health Aff (Millwood). 2007;26(2):331–344
7. Margolis PA, Greenberg RA, Keyes LL, et al. Lower respiratory illness in infants and low socioeconomic status.Am J Public Health. 1992;82(8):1119 –1126
8. Janssen I, Boyce WF, Simpson K, Pickett W. Influence of individual- and area-level mea-sures of socioeconomic status on obesity, unhealthy eating, and physical inactivity in Canadian adolescents.Am J Clin Nutr. 2006; 83(1):139 –145
9. Kawachi I, Kennedy B. The Health of Nations: Why InequalityIs Harmful to Your Health. New York, NY: New Press; 2002
10. Wilkinson R. The Impact of Inequality. New York, NY: New Press; 2005
11. Kawachi I, Kennedy BP, Lochner K, Prothrow-Stith D. Social capital, income in-equality, and mortality.Am J Public Health. 1997;87(9):1491–1498
12. Kennedy BP, Kawachi I, Prothrow-Stith D. In-come distribution and mortality: cross sec-tional ecological study of the Robin Hood index in the United States [published cor-rection appears inBMJ.1996;312(7040): 1194].BMJ. 1996;312(7037):1004 –1007
13. Kaplan GA, Pamuk ER, Lynch JW, Cohen RD, Balfour JL. Inequality and mortality in the United States: analysis of mortality and po-tential pathways [published correction ap-pears inBMJ. 1996;312(7041):1253].BMJ. 1996;312(7037):999 –1003
14. Wilkinson R. Unhealthy Societies: The Afflic-tions of Inequality. New York, NY: Routledge; 1996
16. Subramanian SV, Kawachi I. Income in-equality and health: what have we learned so far?Epidemiol Rev. 2004;26(1):78 –91
17. Lynch JW, Kaplan GA, Pamuk ER, et al. In-come inequality and mortality in metropol-itan areas of the United States.Am J Public Health. 1998;88(7):1074 –1080
18. Wilkinson RG. Income distribution and life expectancy.BMJ. 1992;304(6820):165–168
19. Shi L, Starfield B, Kennedy B, Kawachi I. In-come inequality, primary care, and health indicators.J Fam Pract. 1999;48(4):275–284 20. Pickett KE, Kelly S, Brunner E, Lobstein T, Wilkinson RG. Wider income gaps, wider waistbands? An ecological study of obesity and income inequality.J Epidemiol Commu-nity Health. 2005;59(8):670 – 674
21. Babones SJ. Income inequality and popula-tion health: correlapopula-tion and causality.Soc Sci Med. 2008;66(7):1614 –1626
22. Lynch J, Smith GD, Harper S, et al. Is income inequality a determinant of population health? Part 1: a systematic review.Milbank Q. 2004;82(1):5–99
23. Wagstaff A, van Doorslaer E. Income in-equality and health: what does the litera-ture tell us?Annu Rev Public Health. 2000; 21:543–567
24. Backlund E, Rowe G, Lynch J, Wolfson MC, Kaplan GA, Sorlie PD. Income inequality and mortality: a multilevel prospective study of 521 248 individuals in 50 US states.Int J Epi-demiol. 2007;36(3):590 –596
25. Judge K. Income distribution and life expectancy: a critical appraisal.BMJ. 1995; 311(7015):1282–1285
26. Fiscella K, Franks P. Poverty or income in-equality as predictor of mortality: longitudi-nal cohort study. BMJ. 1997;314(7096): 1724 –1728
27. Emerson E. Relative child poverty, income inequality, wealth, and health.JAMA. 2009; 301(4):425– 426
28. Pickett KE, Wilkinson RG. Child wellbeing and income inequality in rich societies: eco-logical cross sectional study. BMJ. 2007; 335(7629):1080 –1086
29. Huynh M, Parker JD, Harper S, Pamuk E,
Schoendorf KC. Contextual effect of income inequality on birth outcomes.Int J Epide-miol. 2005;34(4):888 – 895
30. Flegg AT. Inequality of income, illiteracy and medical care as determinants of infant mortality in underdeveloped countries. Popul Stud (Camb). 1982;36(3):441– 458
31. Waldmann RJ. Income distribution and in-fant mortality. Q J Econ. 1992;107(4): 1283–1302
32. Mayer SE, Sarin A. Some mechanisms link-ing economic inequality and infant mortal-ity.Soc Sci Med. 2005;60(3):439 – 455
33. Hales S, Howden-Chapman P, Salmond C, Woodward A, Mackenbach J. National infant mortality rates in relation to gross national product and distribution of income.Lancet. 1999;354(9195):2047
34. Wennemo I. Infant mortality, public policy and inequality: a comparison of 18 industri-alised countries 1950 – 85.Sociol Health Ill-ness. 1993;15(4):429 – 446
35. Sohler NL, Arno PS, Chang CJ, Fang J, Schechter C. Income inequality and infant mortality in New York City.J Urban Health. 2003;80(4):650 – 657
36. Spencer N. The effect of income inequality and macro-level social policy on infant mor-tality and low birthweight in developed countries: a preliminary systematic review. Child Care Health Dev. 2004;30(6):699 –709
37. Reagan PR, Salsberry PJ. Race and ethnic differences in determinants of preterm birth in the USA: broadening the social con-text.Soc Sci Med. 2005;60(10):2217–2228
38. Collison D, Dey C, Hannah G, Stevenson L. Income inequality and child mortality in wealthy nations.J Public Health. 2007;29(2): 114 –117
39. Pickett KE, Mookherjee J, Wilkinson RG. Ad-olescent birth rates, total homicides, and income inequality in rich countries.Am J Public Health. 2005;95(7):1181–1183
40. Gold R, Kawachi I, Kennedy BP, Lynch JW, Connell FA. Ecological analysis of teen birth rates: association with community income and income inequality.Matern Child Health J. 2001;5(3):161–167
41. Jones AF Jr, Weinberg DH.The Changing Shape of the Nation’s Income Distribution: 1947–1998. Washington, DC: US Census Bureau; 2000. Publication P60-204. Available at: www2.census.gov/prod2/popscan/p60-204.pdf. Accessed January 9, 2009
42. Webster B, Bishaw A. US Census Bureau, American Community Survey Reports, ACS-08, Income, Earnings, and Poverty Data From the 2006 American Community Sur-vey. Washington, DC: US Government Print-ing Office; 2007. Available at: www.census. gov/hhes/www/poverty/publications/acs-08.pdf. Accessed November 22, 2008
43. Johnson DS. News conference on 2006 in-come, poverty and health insurance cover-age estimates from the Current Population Survey and the American Community Survey. Available at: www.census.gov/ newsroom/releases/archives/news_ c o n f e r e n c e s / 2 0 0 7 - 0 8 - 2 8 _ r e m a r k s _ johnson.html. Accessed January 9, 2009
44. McLeod JD, Nonnemaker JM, Call KT. Income inequality, race, and child well-being: an ag-gregate analysis in the 50 United States.J Health Soc Behav. 2004;45(3):249 –264
45. Kawachi I, Blakely TA. When economists and epidemiologists disagree.J Health Polit Pol-icy Law. 2001;26(3):533–541
46. Egerter S, Braveman P, Pamuk E, et al. Amer-ica’s Health Starts With Healthy Children: How Do States Compare? Princeton, NJ: Robert Wood Johnson Foundation; 2008. Available at: www.commissiononhealth. org/Report.aspx?Publication⫽57823. Ac-cessed December 8, 2008
47. US Census Bureau. Employment, work experi-ence, and earnings by age and education, 1999. Available at: www.census.gov/hhes/www/ income/data/earnings/call1usfemale.html. Ac-cessed January 9, 2009
DOI: 10.1542/peds.2009-3378 originally published online November 15, 2010;
2010;126;1165
Pediatrics
Maren E. Olson, Douglas Diekema, Barbara A. Elliott and Colleen M. Renier
United States
Impact of Income and Income Inequality on Infant Health Outcomes in the
Services
Updated Information &
http://pediatrics.aappublications.org/content/126/6/1165
including high resolution figures, can be found at:
References
http://pediatrics.aappublications.org/content/126/6/1165#BIBL
This article cites 37 articles, 10 of which you can access for free at:
Subspecialty Collections
http://www.aappublications.org/cgi/collection/federal_policy_sub
Federal Policy
_sub
http://www.aappublications.org/cgi/collection/child_health_financing
Child Health Financing
http://www.aappublications.org/cgi/collection/advocacy_sub
Advocacy
following collection(s):
This article, along with others on similar topics, appears in the
Permissions & Licensing
http://www.aappublications.org/site/misc/Permissions.xhtml
in its entirety can be found online at:
Information about reproducing this article in parts (figures, tables) or
Reprints
http://www.aappublications.org/site/misc/reprints.xhtml
DOI: 10.1542/peds.2009-3378 originally published online November 15, 2010;
2010;126;1165
Pediatrics
Maren E. Olson, Douglas Diekema, Barbara A. Elliott and Colleen M. Renier
http://pediatrics.aappublications.org/content/126/6/1165
located on the World Wide Web at:
The online version of this article, along with updated information and services, is
by the American Academy of Pediatrics. All rights reserved. Print ISSN: 1073-0397.