M E T H O D O L O G Y
Open Access
In vivo
functional brain mapping in a conditional
mouse model of human tauopathy (tau
p301l
)
reveals reduced neural activity in memory
formation structures
Pablo D Perez
1, Gabrielle Hall
1, Tetsuya Kimura
3, Yan Ren
2, Rachel M Bailey
2, Jada Lewis
2, Marcelo Febo
1*and Naruhiko Sahara
2*Abstract
Background:Tauopathies are characterized by intracellular deposition of the microtubule-associated protein tau as filamentous aggregates. The rTg4510 mouse conditionally expresses mutant human tau protein in various forebrain areas under the Tet-off expression system. Mice develop neurofibrillary tangles, with significant neuronal loss and cognitive deficits by 6 months of age. Previous behavioral and biochemical work has linked the expression and aggregates of mutant tau to functional impairments. The present work used manganese-enhanced magnetic resonance imaging (MEMRI) to investigate basal levels of brain activity in the rTg4510 and control mice.
Results:Our results show an unmistakable curtailment of neural activity in the amygdala and hippocampus, two regions known for their role in memory formation, but not the cortex, cerebellum, striatum and hypothalamus in tau expressing mice.
Conclusion:Behavioral impairments associated with changes in activity in these areas may correspond to age progressive mutant tauP301L-induced neurodegeneration.
Keywords:Tauopathy, Neurodegenerative disease, Alzheimer’s disease, rTg4510, Manganese enhanced MRI
Background
Accumulation of intracellular neurofibrillary tangles (NFTs) consisting of microtubule-associated protein tau is a major hallmark of Alzheimer’s disease (AD) and related neurode-generative diseases regarded as‘tauopathies’[1-3]. Findings of tau mutations in subjects affected by frontotemporal de-mentia and mutant tau expression systems, which lead to tau-positive inclusions, neuron loss and behavioral abnor-malities in various animal models, have established a role of this protein in neurodegeneration [4-11].
The rTg4510 mouse line was specifically developed to model aspects of human tauopathy, with overexpression of human tau containing the P301L mutation that is asso-ciated with frontotemporal dementia with parkinsonism
linked to chromosome 17 (FTDP-17-Tau). Expression of human tau in the rTg4510 mouse is controlled by the tetracycline transactivator (tTA) transgene under the Ca2+/calmodulin-dependent protein kinase IIα(CaMKIIα) promoter. This leads to selective tau expression from an otherwise transcriptionally inactive tau transgene [12]. Mice develop robust intracellular deposition of tau protein in cortico-limbic areas, which is physiologically relevant to AD and other tauopathies, and they also show age-related forebrain atrophy.
The main pathological features of rTg4510 mice have been obtained as a result of postmortem analysis of brain tissue, except recent work employing multiphoton micro-scopical analysis [13,14]. The advent of rodent magnetic resonance imaging methods can fill the need for investi-gating in vivocorrelates of early signs of disease. Recent developments in the animal imaging have led to the use of the manganese ion (Mn2+) as a neuronal contrast agent * Correspondence:[email protected];[email protected]
1Department of Psychiatry, University of Florida McKnight Brain Institute,
Gainesville, Florida 32610, USA
2Center for Translational Research in Neurodegenerative Disease and
Department of Neuroscience, University of Florida, Gainesville, FL 32610, USA
that provides a useful tool for functional brain mapping at good spatial resolution [15,16]. MEMRI thus provides a noninvasive approach for mapping neural activity in trans-genic mice. Mn2+ is highly paramagnetic and enhances signal intensity in T1 weighted brain images [17,18]. It
enters neurons largely through voltage dependent calcium channels, and possibly also via vesicular reuptake mechan-isms, which correlates well with changes in synaptic firing of neuronal populations [19-21]. Other MEMRI studies in rodents have shown Mn2+signal intensity in various ROI, including the hippocampus, under basal conditions [17,18]. Here, we performedin vivobrain MEMRI of rTg4510 mice and non-transgenic (nonTg) littermates. Mutant rTg4510 mice sustain significant tau-associated hippocampal atrophy at 6 months of age and above and this was anticipated to result in less Mn2+ signal within this region in basal un-stimulated conditions. We observed clear differences in basal neural activity between mutant tau expressing mice and controls, with the magnitude of activity being lower in rTg4510 mice. Our study extends previous applications of MEMRI in the study of axonal transport rates in transgenic mice by showing reduced neural activity in two structures involved in learning and memory [22-24].
Results
Methodological considerations
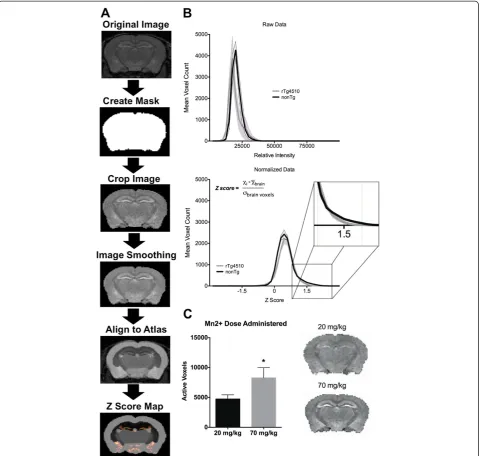
We closely analyzed the intensity histograms of rTg4510 and control mice (histograms in Figure 1B). The probabil-ity of finding voxels with a Z score of 1 or more was less than 5% (p < 0.05; Figure 1B bottom graph inset). This corresponds to 7.9% of the total population of brain voxels for rTg4510 mice and 10.6% for nonTg mice (unpaired t-test t8=3.4p= 0.01). About 0.05% of voxels had values of
Z =−1 or less (p< 0.0003); thus, negative Z values were negligible and not of interest in the present analysis. Only voxels with positive Z values were considered in subse-quent ROI analyses. We also carried out a series of pilot experiments to determine the optimal dose of Mn2+. Comparison of the two doses, shown in Figure 1C, high-lights a dose-dependent effect on signal intensity. Control nonTg mice (n = 6) administered 20 mg/kg Mn2+showed signal increases of significantly smaller magnitudes than a separate cohort of nonTg mice (n = 5) administered 70 mg/kg (t-test t9=4.757 p = 0.001). The higher dose
is just below previous doses reported in the literature for mouse (88 mg/kg in [18]), however, in our hands 70 mg/kg did not result in any overt motor or other visible disturbances in nonTg and rTg4510 mice.
ROI analysis
High signal intensity levels were observed in subregions of the hippocampus, hypothalamic areas, central amyg-dala, lateral habenula, basal forebrain area, layers of the olfactory bulb, and cerebellum, as previously reported
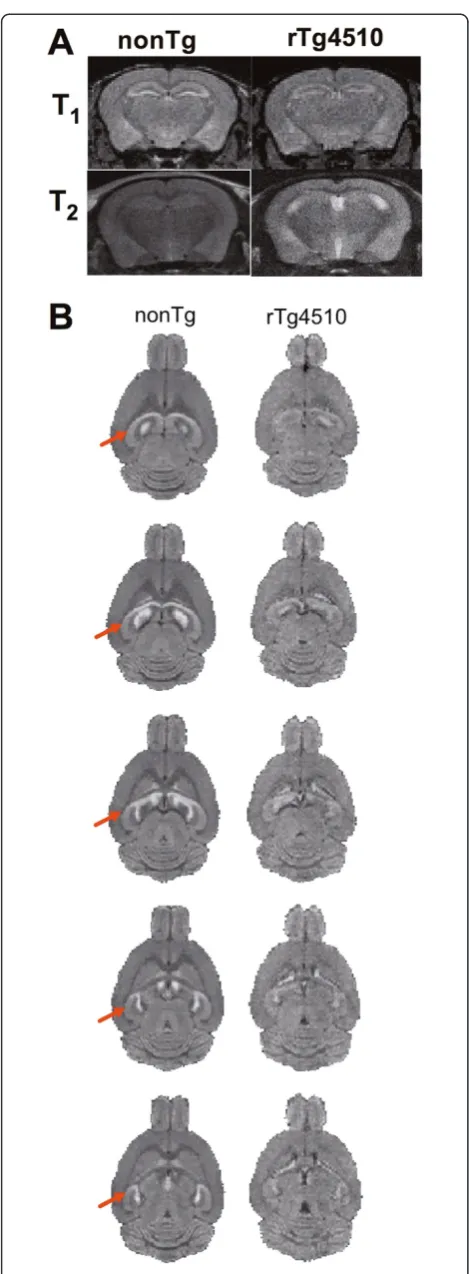
for systemically administered Mn2+ [18]. We noted also that there was high Mn2+associated signal in the amyg-dala, mostly pronounced in the central amygdala area. Further qualitative inspection of each of the MRI scans indicated a smaller hippocampal volume in rTg4510 mice than control mice (Figure 2A T2 weighted images),
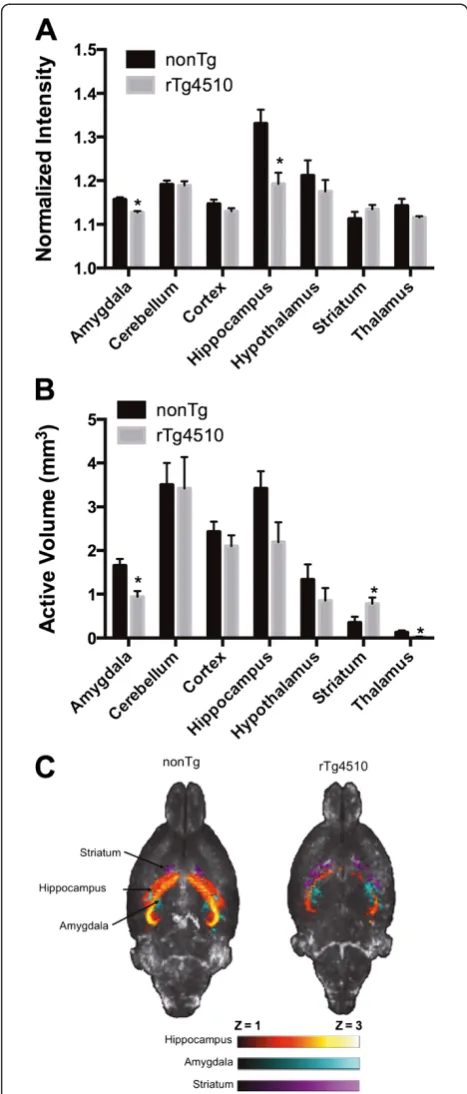
con-sistent with previous imaging of rTg4510 mice [25]. Nor-malized voxel intensity values (in Z scores), and the number of voxels with an intensity value equal to or above the threshold value (mean signal and activated volume, re-spectively) were extracted from each ROI. Signal intensity increases were more pronounced in dorsal areas of the hippocampus, particularly the dentate gyrus (Figure 2B). However, increased signal intensity was still observed in ventral CA3 (Figure 2B). Signal intensity was noticeably lower in the hippocampus of rTg4510 mice than in con-trols (Figure 2B). Generalized signal intensity differences between groups did not explain this difference, as these were normalized and values rescaled to within a similar range (Figure 1). In addition, cortical volume, which is re-portedly reduced in 5-month old rTg4510 mice [25], did not show similar reductions in neural activity (Figure 3). Thus, the reduced signal intensity is selective for hippo-campus and amygdala, of rTg4510 mice. Significant reduc-tions in signal intensity were observed in amygdala (t8=5.0
p = 0.001) and hippocampus (t8=3.407, p = 0.009) of
rTg4510 mice (Figure 3A). We also analyzed the number of voxels exceeding a threshold Z score value of 1 (pre-sumed“active regions”during basal conditions) (Figure 3B). As stated in the methods section, we normalized the images and set a threshold at 1 standard deviation above the mean. Thus, all voxels below this threshold were set to zero and signal intensities above the threshold were compared. The active volume was lower in rTg4510 mice than in control nonTg mice in amygdala (t8=3.7,p= 0.006) and thalamus
(t8=2.5,p= 0.04). The hippocampus showed the same trend
as with signal intensity (t8=2.0,p= 0.07). Interestingly, the
striatum showed a greater active volume in rTg4510 mice than controls (t8=2.2,p= 0.05). Mean intensity projection
images in Figure 3C illustrate the main findings. Hippocam-pal and amygdala signal intensity is lower in rTg4510 mice than controls. The striatum shows the opposite effect with greater active volume in rTg4510 mice.
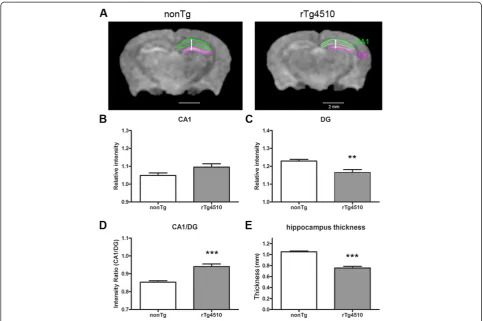
contrasted with the differences observed at the level of the dentate gyrus (DG; Figure 4C). When analyzed as intensity ratio between CA1 and DG, there is signifi-cantly greater differential activity in rTg4510 compared to nonTg mice (Figure 4D). This was observed de-spite reduced hippocampal thickness in these animals (Figure 4E). Reduced volume was further confirmed
by manual segmentation of dorsal hippocampal sub regions. Approximately 30% of hippocampus volume was decreased in rTg4510 compared to nonTg mice (Figure 5A). On the other hand, enlarged microg-lia staining was clearly visible despite significant neur-onal loss in CA1 region in 6 month-old rTg4510 mice (Figure 5B).
Figure 1Summary of manganese (Mn2+) enhanced MRI (MEMRI) preprocessing and analysis procedure. A) Steps in image processing
Discussion
rTg4510 mice develop NFTs and show significant loss of hippocampal neurons at around 5–6 months. Neuronal loss may be severe (~80%) by 8 months [26]. These fac-tors are likely to contribute to impairments observed in spatial navigation memory previously reported using the water maze test [27], a behavior that is associated with neuronal activity in the dorsal hippocampus. The present study usedin vivoMEMRI to map brain activa-tion in control and rTg4510 mice under baseline, non-stimulated conditions. We observed significantly lower signal intensity, which may reflect underlying reductions in neuronal firing in rTg4510 versus control littermates. This effect appeared selective for memory formation structures, such as the hippocampus and amygdala, and was not observed in other ROI such as the septum, cere-bellum, striatum, midbrain and brainstem. The hippo-campus and amygdala play important roles in learning and memory, with the hippocampal structures contribut-ing significantly to declarative memory while the amyg-dala contributes to implicit or emotional memory formation. While there is growing evidence that progres-sive reductions in hippocampal activity lead to general-ized memory impairments, the implications for the amygdala are new for the rTg4510 mouse. The amyg-dala, particularly the basolateral regions, develop NFT neuropathology, however, a mechanism in rTg4510 mice remains to be thoroughly investigated. Dickey et al. (2009) immunohistochemically stained for tau and found no staining in thalamus. Indirect effects of tau pathology (or tau expression) in other regions, such as the neocor-tex, may have contributed to the differences observed here. In addition, we observed increases in signal inten-sity (activity) in the striatum, an effect that might reflect some changes in disinhibitory process arising from cor-tical inputs. However, despite the lack of any evidence of neuronal loss in the striatum, this region does accumu-late NFTs beginning around 5.5 months [26].
Progression of NFT pathology in rTg4510 mice has been considerably explored by several groups. Immuno-histochemical analysis revealed that rTg4510 mice de-velop pre-tangle pathology at 2.5 M and fully formed NFTs at 4 M in the cortex and at 5.5 M in the hippo-campus [12,28]. NFT pathology in the hippocampal for-mation occurs in a distinctly staged sub regional pattern beginning from CA1 to CA3 and dentate gyrus [28]. Biochemical analysis of the rTg4510 hippocampus
confirmed that the progression of NFT formation was drastically increased from 4 months to 6 months of age [27,29-31]. In agreement with these neuropathological observations, our in vivo MRI analysis from rTg4510 mice (5.5-6.3 M) showed significant reduction of both neural activity and volume in the hippocampus. We observed significant reduction of signal intensity in the dentate gyrus of rTg4510 mice. Because CA1 pyramidal neurons were significantly decreased at this age, other sub regions of the hippocampus may receive less signal-ing associated with neural activity. Similar to our present observations, Yang et al. (2011) showed increased react-ive astrocytic gliosis and enlarged microglia in CA1 from 8 M male rTg4510. One interesting possibility may be the sequestering of Mn2+ in microglial cells occurs in rTg4510 CA1. This would either increase CA1 signal or pull away signal from the DG. An in-depth neurochem-ical investigation is warranted. An important follow up will be to control the expression of transgenic tau and the progression of NFT formation and/or neuronal loss through the administration of doxycycline and examine whether mice show unbalanced neural activity across hippocampal sub regions at different stages of disease progression.
A series of experiments using MEMRI have been carried out to examine axonal transport rates along the olfactory and optic tracts in transgenic mice for amyloid precursor protein (APP) expression. Using a fast temporal series of T1weighted image acquisitions it was shown that there is
an age progressive decline in olfactory tract axonal trans-port rates of Mn2+that worsened after plaque formation. In a subsequent study it was demonstrated that loss of APP in knockout mice resulted in reduced axonal trans-port rates for Mn2+, which was recovered by over-expressing human wildtype tau [22]. Similar deficits in axonal transport rates have been reported in regions of the visual system and hippocampal formation of APP knockout mice [24] and in the olfactory system of triple transgenic mice expressing APP and human presenilin [23]. The above references illustrate the versatility of the MEMRI method. Localizedin vivotreatment can be used to track not only global brain activity as in the present work, but also transport rates on selective regions of the CNS [32]. Our present results are consistent with recent work published by Kimura et al. (2007) showing lower ac-tivity in hippocampal and surrounding parahippocampal areas of aged mice with hyperphosphorylated tau protein. Levels of signal intensity in the parahippocampal areas highly correlated with performance on a spatial learning task [33]. In the latter study Mn2+was provided to animals only 4 hours prior to imaging session and thus provides evidence of significant brain uptake of Mn2+ across the blood brain barrier of mice. This is supported byin vitro
studies showing rapid uptake of Mn2+ in brain, which
appears to be aided by both active and passive transport processes [34].
To our knowledge, this is the first MEMRI study exam-ining neural activation in the rTg4510 mouse. Previous work on this transgenic mouse has focused on chemical and volumetric differences compared to controls. Both male and female mutant tau-expressing mice show reduced total brain volume which is largely associated with lower cortical and hippocampal volume [25]. We observed this feature as well and also noted the previously reported widening of ventricles [25]. This is consistent with postmortem tissue analysis in these same animals [12,26]. Proton MR spectroscopy showed greater myoino-sitol concentrations in the hippocampus and thalamus of rTg4510 mice, and this is consistent with increased gliosis [25]. Interestingly, N-acetylaspartate, which is often taken as a marker of neuronal function, was not different between controls and rTg4510 mice. We observe here that in vivo neural activity is reduced during baseline
conditions in these animals. The previously reported lower number of neurons [26], which may lead to lower hippocampal volume [25], also may have accounted for the generally lower signal intensity in this region in rTg4510 mice. However, cortical neural activity was not different between control mice and rTg4510 mice despite the reduced volume in the latter. This could signify that the lower neural activity is due to reduced functional activity in memory structures. We also found that the re-duction in hippocampal signal intensity is not uniform through the subanatomical layers of this paleocortical re-gion. rTg4510 mice show a somewhat modest, but signifi-cant increase in signal intensity in the CA1 region. It is tempting to speculate on what such an effect may be asso-ciated with. One possibility could be due to compensatory changes in neuronal activity across the dorsal hippocam-pal areas; however, this would potentially result in main-tenance of higher levels of performance on spatial navigation and memory tasks. Past data do not support
such a contention at this time. One alternative might be linked to gliosis, which would be consistent with past work by Yang et al. (2012). Microglial cells migrating to this region might sequester Mn2+ to such an extent that they result in increased signal intensity. This would not be due to increased neuronal activity, but rather it would be in line with the pathogenicity observed with tau over-expression at this age of the mice. This is somewhat sup-ported by the literature. Quinolic acid lesions of neural tissue result in greater levels of Mn2+accumulation than in controls, thus supporting internalization of Mn2+ in both neurons and glial cells [35]. In conclusion, we find that mice over expressing human mutant tau(P301L) show
lower brain activity in selected regions involved in mem-ory formation. The present novel findings are consistent with previous behavioral and biochemical studies in the rTg4510 mouse. Moreover, the methods used provide a novel approach to explore the specific relation between genetically-driven expression of pathogenic tau and func-tional changes over neurodegenerative disease progression.
Methods Mice
The parental P301L tau responder line, parental tTA acti-vator line, and the resultant F1 rTg4510 mice and litter-mates were generated and maintained as previously described [12]. Mice were maintained on a standard diet
lacking doxycycline to ensure that transgenic tau was expressed throughout the lifetime of the experimental ani-mals (weights were 25-40 g at the time of imaging). All mice were kept in standard size mouse cages (29 x 18 x 13 cm; up to 5 per same sex groups) at 20-26°C on a daily 12 hour light–dark cycle (light on during 0700 – 1900) withad libitumaccess to food and water. Mice kept under these conditions were handled twice per week. Animals were generated and cared for in accordance with the guidelines published in the Guide for the Care and Use of Laboratory Animals (8thEdition, 2011) and in adherence to the National Institutes of Health and the American As-sociation for Laboratory Animal Science guidelines. All procedures involving live mice received prior approval from the Institutional Animal Care and Use Committee of the University of Florida.
Manganese chloride pretreatment
Manganese (II) chloride tetrahydrate was purchased from Sigma-Aldrich Chemical Co. (St. Louis, MO, USA) and was dissolved in ddH2O and sterile filtered prior to
ad-ministration. We first carried out pilot experiments to examine the optimal MnCl2dose (20 and 70 mg/kg) that
produced T1weighted signal enhancement in the absence
of motor impairments. These experiments were carried out on a separate cohort of animals at 5.3-6.3 months of age (M) and resulted in selection of the 70 mg/kg MnCl2
solution. This dose produced results similar to those reported in previous work [18]. In order to map basal brain activity in rTg4150 mice (n=5; 5.5-6.3 M) and con-trol nonTg littermates (n=5; 5.5-6.3 M), MnCl2was
admi-nistered at a dose of 70 mg/kg, i.p. 24 hrs prior to MRI scanning. Animals were handled every two weeks and acclimatized to the investigator providing the injections. After injections, mice were returned to their home cage and imaged the following day.
Magnetic resonance imaging
Images of anesthetized mice were collected on an actively shielded 4.7-Tesla Magnex Scientific MR scanner controlled by Agilent Technologies VnmrJ 3.1 console software. A 38-mm quadrature transmit/receive radiofrequency (RF) coil tuned to 200 MHz was used (Insight NeuroImaging Sys-tems, LLC, Leominster, MA). Anesthesia was initially induced under 2.0-2.5% isoflurane (0.1 mL/min) delivered in 100% oxygen for 30–60 seconds and levels were then maintained between 1.0-1.25% throughout the entire setup and imaging session. Mice were placed prone on a custom-made plastic bed with a respiratory pad placed underneath the abdomen. They were covered with disposable paper towel to aid in preserving body warmth. Body temperatures were maintained using a warm air recirculation system that received feedback from a fiber optic thermocouple micro-probe (SA Instruments, Inc., New York). Respiratory rates
were monitored continuously and maintained between 20– 30 beats per minute by adjusting isoflurane levels between 1–1.25%. Incisors were secured on the front end of the plastic bed to minimize motion. The front half of the bed was aligned and clamped inside the quad RF coil and placed inside the isocenter of the scanner. Images were acquired using a T1-weighted 3D gradient echo sequence
with the following parameters: repetition time (TR) = 35 ms, echo time (TE) = 12 ms, flip angleα = 50°, data matrix 256 X 1282(along read X phase X slice directions), size 30 mm X 20 mm2(resolution 200 X 156μm2along the same read X phase X slice directions). Total scan time per mouse was 57 minutes.
Data processing and statistical analysis
Figure 1A provides a diagram describing portions of the image processing and data analysis procedure. Accu-mulation of Mn2+within brain tissue shortens its T1
re-covery time, leading to enhanced signal intensity [15,16]. However, there is significant scan-to-scan variability that requires normalization before carrying out between-groups’statistics. Various normalization procedures have been used in the past such as normalizing to phantoms containing chemical constituents of grey matter [36], normalization to specific regions of interest (ROI) not anticipated to sequester Mn2+ during specific tasks or stimuli [32], or normalizing brain to muscle tissue near the sampled ROI [22]. In the present study, we used a voxel-wise Z-score normalization procedure similar to [37] that facilitates within and between groups compari-sons at a set threshold level and minimizes some of the between scan variability (Figure 1B). Image processing was carried out using itk SNAP (http://www.itksnap. org), OsiriX (http://www.osirix-viewer.com/), and image math scripts available on FSL (http://www.fmrib.ox.ac. uk/fsl/). As shown in Figure 1A, a whole brain mask was generated per each scan and used to first crop out the non-brain portions of 3D MR scans (non-brain voxels were set to 0). A non-linear filter was applied to the cropped images to reduce noise without altering reso-lution [38]. Scans were aligned with a segmented atlas of the adult C57BL/6 J mouse brain (http://brainatlas.mbi. ufl.edu/) using an automated affine linear registration tool from FSL [39]. To overcome differences in brain volume between control and rTg4510 mice [28,40], subject-specific versions of the atlas were made based on alignment and warping of the atlas coordinates to each subjects’ scan space (12 parameter affine registration). Alignment was verified for accurate delineation of ROI and manually adjusted if needed (Figure 1A) The ana-tomical location of ROI was compared to a histological atlas of the mouse brain [41]. Finally, each scan was converted to a Z score map through a voxel-wise normalization procedure. The mean signal intensity
across the entire extracted brain volume (x) was sub-tracted from each voxel (xi) and then divided by the variance (σ):
ZScore¼xiσ x
A pre-set threshold of Z ≥ 1 was selected based on a priori observation of individual datasets and a close in-spection of their intensity distribution histograms. This corresponds to a threshold of 1 standard deviation above the mean. All voxels with z score values below this thresh-old were set to zero. The intensity histograms in Figure 1B show mean voxel counts for the entire brain of 5 rTg4510 mice and 5 control mice included in the study. Rescaling of intensity values based on each subjects’signal intensity variance allowed consistent sampling of brain voxels showing increase signal across each subject. The voxels exceeding the threshold value of z =1 were considered in our statistical analysis as having higher signal intensities (exceeding 1 standard deviation above the mean signal in-tensity across the whole brain). The segmented ROIs in the digital atlas of the mouse brain included the neocortex, striatum, globus pallidus, olfactory bulb, hypothalamus, septum/basalforebrain, midbrain, brainstem, thalamus, hippocampus, amygdala and cerebellum. Upon analyzing all regions, the hippocampus showed major differences be-tween rTg4510 and control mice. However, the digital atlas does not segment sub regions of the hippocampus. Therefore, a separate analysis was also carried out to examine in detail the volume of the hippocampus, which has previously been reported to be smaller in rTg4510 [28]. For this analysis, dorsal hippocampal sub regions CA1 and DG were manually traced. Mean normalized signal intensity values for each ROI were compared using an unpaired two-tailed t-test (homoscedastic variances,
α≤0.05).
Immunohistochemical staining
Formalin fixed brains were paraffin embedded and cut into sagittal (5 μm) sections. Standard immunohisto-chemical procedure was implemented with the Dako Universal Autostainer (Dako, Carpinteria, CA). Primary antibodies used CP13 (phosphorylated tau at Ser202, provided by Dr. P.Davies, Albert Einstein College of Medicine) and ionized calcium-binding adaptor mol-ecule 1 (Iba-1, Wako Chemicals USA, Richmond, VA).
Abbreviations
Competing interests
The authors have no conflict of interest to disclose
Authors’contributions
PDP, carried out the imaging data collection. GH, contributed to animal imaging and treatments. TK, contributed to data analysis and manuscript writing up. YR, carried out animal breeding, treatments and tissue processing. RB, carried out the immunohistochemistry, JL, contributed research animals manuscript editing and aided in conceptualization of study. MF, helped conceive the study, manuscript write up and did parts of the data analysis. NS, conceived study, manuscript write up and helped carry out portions of the study. All authors read and approved the final manuscript.
Acknowledgements
MF is supported by NIH grant DA019946 and a seed grant from the McKnight Brain Institute. NS is supported by NIH grant NS067127 and Thomas H. Maren Junior Investigator Fund from University of Florida. NS and JL are supported by the Center for Translational Research in
Neurodegenerative Disease and the Department of Neuroscience at University of Florida. The authors thank Dr. Stephen J. Blackband for providing the mouse brain atlas. MRI data were obtained at the Advanced Magnetic Resonance Imaging and Spectroscopy (AMRIS) facility in the McKnight Brain Institute of the University of Florida.
Author details 1
Department of Psychiatry, University of Florida McKnight Brain Institute, Gainesville, Florida 32610, USA.2Center for Translational Research in Neurodegenerative Disease and Department of Neuroscience, University of Florida, Gainesville, FL 32610, USA.3Department of Aging Neurobiology, National Center for Geriatrics and Gerontology, Obu-shi, Aichi 474-8511, Japan.
Received: 18 September 2012 Accepted: 18 January 2013 Published: 4 February 2013
References
1. Lee VM, Goedert M, Trojanowski JQ:Neurodegenerative tauopathies.Annu Rev Neurosci2001,24:1121–1159.
2. Swaab DF, Dubelaar EJ, Hofman MA, Scherder EJ, van Someren EJ, Verwer RW:Brain aging and Alzheimer’s disease; use it or lose it.Prog Brain Res 2002,138:343–373.
3. Binder LI, Guillozet-Bongaarts AL, Garcia-Sierra F, Berry RW:Tau, tangles, and Alzheimer’s disease.Biochim Biophys Acta2005,1739:216–223. 4. Lewis J, McGowan E, Rockwood J, Melrose H, Nacharaju P, Van Slegtenhorst
M, Gwinn-Hardy K, Paul Murphy M, Baker M, Yu X,et al:Neurofibrillary tangles, amyotrophy and progressive motor disturbance in mice expressing mutant (P301L) tau protein.Nat Genet2000,25:402–405. 5. Gotz J, Chen F, Barmettler R, Nitsch RM:Tau filament formation in
transgenic mice expressing P301L tau.J Biol Chem2001,276:529–534. 6. Tanemura K, Akagi T, Murayama M, Kikuchi N, Murayama O, Hashikawa T,
Yoshiike Y, Park JM, Matsuda K, Nakao S,et al:Formation of filamentous tau aggregations in transgenic mice expressing V337M human tau. Neurobiol Dis2001,8:1036–1045.
7. Tatebayashi Y, Miyasaka T, Chui DH, Akagi T, Mishima K, Iwasaki K, Fujiwara M, Tanemura K, Murayama M, Ishiguro K,et al:Tau filament formation and associative memory deficit in aged mice expressing mutant (R406W) human tau.Proc Natl Acad Sci USA2002,99:13896–13901.
8. Allen B, Ingram E, Takao M, Smith MJ, Jakes R, Virdee K, Yoshida H, Holzer M, Craxton M, Emson PC,et al:Abundant tau filaments and nonapoptotic neurodegeneration in transgenic mice expressing human P301S tau protein.J Neurosci2002,22:9340–9351.
9. Schindowski K, Bretteville A, Leroy K, Begard S, Brion JP, Hamdane M, Buee L:Alzheimer’s disease-like tau neuropathology leads to memory deficits and loss of functional synapses in a novel mutated tau transgenic mouse without any motor deficits.Am J Pathol2006,169:599–616. 10. Yoshiyama Y, Higuchi M, Zhang B, Huang SM, Iwata N, Saido TC, Maeda J,
Suhara T, Trojanowski JQ, Lee VM:Synapse loss and microglial activation precede tangles in a P301S tauopathy mouse model.Neuron2007, 53:337–351.
11. Eckermann K, Mocanu MM, Khlistunova I, Biernat J, Nissen A, Hofmann A, Schonig K, Bujard H, Haemisch A, Mandelkow E,et al:The beta-propensity
of Tau determines aggregation and synaptic loss in inducible mouse models of tauopathy.J Biol Chem2007,282:31755–31765.
12. Santacruz K, Lewis J, Spires T, Paulson J, Kotilinek L, Ingelsson M, Guimaraes A, DeTure M, Ramsden M, McGowan E,et al:Tau suppression in a neurodegenerative mouse model improves memory function.Science 2005,309:476–481.
13. Spires-Jones TL, de Calignon A, Matsui T, Zehr C, Pitstick R, Wu HY, Osetek JD, Jones PB, Bacskai BJ, Feany MB,et al:In vivo imaging reveals dissociation between caspase activation and acute neuronal death in tangle-bearing neurons.J Neurosci2008,28:862–867.
14. de Calignon A, Fox LM, Pitstick R, Carlson GA, Bacskai BJ, Spires-Jones TL, Hyman BT:Caspase activation precedes and leads to tangles.Nature 2010,464:1201–1204.
15. Pautler RG, Silva AC, Koretsky AP:In vivo neuronal tract tracing using manganese-enhanced magnetic resonance imaging.Magn Reson Med 1998,40:740–748.
16. Aoki I, Tanaka C, Takegami T, Ebisu T, Umeda M, Fukunaga M, Fukuda K, Silva AC, Koretsky AP, Naruse S:Dynamic activity-induced manganese-dependent contrast magnetic resonance imaging (DAIM MRI).Magn Reson Med2002,48:927–933.
17. Pautler RG, Mongeau R, Jacobs RE:In vivo trans-synaptic tract tracing from the murine striatum and amygdala utilizing manganese enhanced MRI (MEMRI).Magn Reson Med2003,50:33–39.
18. Lee JH, Silva AC, Merkle H, Koretsky AP:Manganese-enhanced magnetic resonance imaging of mouse brain after systemic administration of MnCl2: dose-dependent and temporal evolution of T1 contrast.Magn Reson Med2005,53:640–648.
19. Aschner M, Gannon M:Manganese (Mn) transport across the rat blood– brain barrier: saturable and transferrin-dependent transport
mechanisms.Brain Res Bull1994,33:345–349.
20. Narita K, Kawasaki F, Kita H:Mn and Mg influxes through Ca channels of motor nerve terminals are prevented by verapamil in frogs.Brain Res 1990,510:289–295.
21. Fukuda J, Kawa K:Permeation of manganese, cadmium, zinc, and beryllium through calcium channels of an insect muscle membrane. Science1977,196:309–311.
22. Smith KD, Kallhoff V, Zheng H, Pautler RG:In vivo axonal transport rates decrease in a mouse model of Alzheimer’s disease.NeuroImage2007, 35:1401–1408.
23. Kim J, Choi IY, Michaelis ML, Lee P:Quantitative in vivo measurement of early axonal transport deficits in a triple transgenic mouse model of Alzheimer’s disease using manganese-enhanced MRI.NeuroImage2011, 56:1286–1292.
24. Gallagher JJ, Zhang X, Ziomek GJ, Jacobs RE, Bearer EL:Deficits in axonal transport in hippocampal-based circuitry and the visual pathway in APP knock-out animals witnessed by manganese enhanced MRI.NeuroImage 2012,60:1856–1866.
25. Yang D, Xie Z, Stephenson D, Morton D, Hicks CD, Brown TM, Sriram R, O’Neill S, Raunig D, Bocan T:Volumetric MRI and MRS provide sensitive measures of Alzheimer’s disease neuropathology in inducible Tau transgenic mice (rTg4510).NeuroImage2011,54:2652–2658. 26. Spires TL, Orne JD, SantaCruz K, Pitstick R, Carlson GA, Ashe KH, Hyman BT:
Region-specific dissociation of neuronal loss and neurofibrillary pathology in a mouse model of tauopathy.Am J Pathol2006,168:1598–1607. 27. Berger Z, Roder H, Hanna A, Carlson A, Rangachari V, Yue M, Wszolek Z,
Ashe K, Knight J, Dickson D,et al:Accumulation of pathological tau species and memory loss in a conditional model of tauopathy.J Neurosci 2007,27:3650–3662.
28. Ramsden M, Kotilinek L, Forster C, Paulson J, McGowan E, SantaCruz K, Guimaraes A, Yue M, Lewis J, Carlson G,et al:Age-dependent
neurofibrillary tangle formation, neuron loss, and memory impairment in a mouse model of human tauopathy (P301L).J Neurosci2005, 25:10637–10647.
29. Sahara N, DeTure M, Ren Y, Ebrahim AS, Kang D, Knight J, Volbracht C, Pederson JT, Dickson DW, Yen SH, Lewis J:Characteristics of TBS-extractable hyperphosphorylated tau species: Aggregation intermediates in rTg4510 mouse brain.J Alzheim Dis2013,33:249-263.
31. Dickey C, Kraft C, Jinwal U, Koren J, Johnson A, Anderson L, Lebson L, Lee D, Dickson D, de Silva R,et al:Aging analysis reveals slowed tau turnover and enhanced stress response in a mouse model of tauopathy.Am J Pathol2009,174:228–238.
32. Yu X, Wadghiri YZ, Sanes DH, Turnbull DH:In vivo auditory brain mapping in mice with Mn-enhanced MRI.Nat Neurosci2005,8:961–968.
33. Kimura T, Yamashita S, Fukuda T, Park JM, Murayama M, Mizoroki T, Yoshiike Y, Sahara N, Takashima A:Hyperphosphorylated tau in parahippocampal cortex impairs place learning in aged mice expressing wild-type human tau.EMBO J2007,26:5143–5152.
34. Rabin O, Hegedus L, Bourre JM, Smith QR:Rapid brain uptake of manganese (II) across the blood–brain barrier.J Neurochem1993,61:509–517. 35. Sloot WN, Gramsbergen JB:Axonal transport of manganese and its
relevance to selective neurotoxicity in the rat basal ganglia.Brain Res 1994,657:124–132.
36. Liu CH, D’Arceuil HE, de Crespigny AJ:Direct CSF injection of MnCl(2) for dynamic manganese-enhanced MRI.Magn Reson Med2004,51:978–987. 37. Cross DJ, Minoshima S, Anzai Y, Flexman JA, Keogh BP, Kim Y, Maravilla KR:
Statistical mapping of functional olfactory connections of the rat brain in vivo.NeuroImage2004,23:1326–1335.
38. Smith SM:Flexible filter neighbourhood designation.Proc 13th Int Conf on Pattern Recognition1996,1:206–212.
39. Jenkinson M, Bannister P, Brady M, Smith S:Improved optimization for the robust and accurate linear registration and motion correction of brain images.NeuroImage2002,17:825–841.
40. Chen XJ, Kovacevic N, Lobaugh NJ, Sled JG, Henkelman RM, Henderson JT: Neuroanatomical differences between mouse strains as shown by high-resolution 3D MRI.NeuroImage2006,29:99–105.
41. Paxinos G, Franklin KBJ:The mouse brain: in stereotaxic coordinates. 2nd edition. San Diego: Academic Press; 2001.
doi:10.1186/1750-1326-8-9
Cite this article as:Perezet al.:In vivofunctional brain mapping in a conditional mouse model of human tauopathy (taup301l) reveals reduced neural activity in memory formation structures.Molecular
Neurodegeneration20138:9.
Submit your next manuscript to BioMed Central and take full advantage of:
• Convenient online submission
• Thorough peer review
• No space constraints or color figure charges
• Immediate publication on acceptance
• Inclusion in PubMed, CAS, Scopus and Google Scholar
• Research which is freely available for redistribution