R E S E A R C H
Open Access
Computational analysis reveals
histotype-dependent molecular profile and
actionable mutation effects across cancers
Daniel Heim
1, Grégoire Montavon
2, Peter Hufnagl
1, Klaus-Robert Müller
2,3,4,5,6*and Frederick Klauschen
1,7,8*Abstract
Background:Comprehensive mutational profiling data now available on all major cancers have led to proposals of novel molecular tumor classifications that modify or replace the established organ- and tissue-based tumor typing. The rationale behind such molecular reclassifications is that genetic alterations underlying cancer pathology predict response to therapy and may therefore offer a more precise view on cancer than histology. The use of individual actionable mutations to select cancers for treatment across histotypes is already being tested in the so-called basket trials with variable success rates. Here, we present a computational approach that facilitates the systematic analysis of the histological context dependency of mutational effects by integrating genomic and proteomic tumor profiles across cancers.
Methods:To determine effects of oncogenic mutations on protein profiles, we used the energy distance, which compares the Euclidean distances of protein profiles in tumors with an oncogenic mutation (inner distance) to that in tumors without the mutation (outer distance) and performed Monte Carlo simulations for the significance analysis. Finally, the proteins were ranked by their contribution to profile differences to identify proteins characteristic of oncogenic mutation effects across cancers.
Results:We apply our approach to four current proposals of molecular tumor classifications and major
therapeutically relevant actionable genes. All 12 actionable genes evaluated show effects on the protein level in the corresponding tumor type and showed additional mutation-related protein profiles in 21 tumor types. Moreover, our analysis identifies consistent cross-cancer effects for 4 genes (FGFR1, ERRB2, IDH1, KRAS/NRAS) in 14 tumor types. We further use cell line drug response data to validate our findings.
Conclusions:This computational approach can be used to identify mutational signatures that have protein-level effects and can therefore contribute to preclinical in silico tests of the efficacy of molecular classifications as well as the druggability of individual mutations. It thus supports the identification of novel targeted therapies effective across cancers and guides efficient basket trial designs.
Keywords:Cancer, Genomics, Pan-cancer analysis, Proteomics, Targeted cancer therapy
* Correspondence:klaus-robert.mueller@tu-berlin.de; frederick.klauschen@charite.de
2Department of Electrical Engineering and Computer Science, Technische
Universität Berlin, Marchstr. 23, 10587 Berlin, Germany
1Institute of Pathology, Charité - Universitätsmedizin Berlin, corporate
member of Freie Universität Berlin, Humboldt-Universität zu Berlin and Berlin Institute of Health, Berlin, Germany
Full list of author information is available at the end of the article
Background
Next-generation sequencing has facilitated comprehen-sive mutational profiling of all major cancers and has led to the discovery of oncogenic driver mutations, many of which can be targeted therapeutically [1–3]. Following the conventional organ- and tissue-based WHO classifica-tion of tumors and standard clinical trial design, precision therapies targeting these driver mutations are usually eval-uated for a specific cancer type. However, sequencing data has shown that actionable mutations, albeit with different frequencies, occur across cancers, which has raised the question about histotype-independent therapies and novel ways of tumor classifications no longer relying on hist-ology but on genetic profiles. Recent studies propose such molecular tumor classifications, which extend or even re-place the histology-based tumor typing as implemented by the World Health Organization (WHO) [4, 5]. Although different, these approaches share the common idea that molecular (mutational) profiles govern tumor pathology and should therefore replace histotyping in diagnostics and therapy selection [6]. That targeted therapies against the same single molecular alteration can be effective across cancers, as shown, for instance, by the efficacy of anti-Her2 therapy in both gastric and breast cancers [7,8] or the clinical benefit from inhibition of mutated cKIT in gastrointestinal stromal tumors (GIST) and melanoma or mastocytosis [9, 10]. However, the fact that inhibition of BRAF mutated at V600 is effective in melanoma but not in colorectal cancer [1, 11, 12] is a prominent ex-ample against the general transferability of knowledge on a single actionable mutation from one histological tumor type to another. This observation is corroborated by recent basket trials that point to histology as an import-ant predictor of response to targeted therapy against ac-tionable mutations [13,14].
The reasons for the variable therapeutic utility of genetic aberrations across cancers is likely due to the complex molecular“background”observed in many tu-mors. Using mutational profiles or just single genetic aberrations, as is the case in the current basket trials, is unlikely to cover the full scope of (tissue-specific) mo-lecular effects including epigenetic mechanisms and downstream regulation such as post-translational modi-fications. However, it would be highly desirable for therapy selection in individual patients and clinical trial design to predict genes with similar functional effects across histotypes.
To this end, we developed a computational approach that integrates genomic and proteomic data from 3590 tumors to analyze the impact of genetic aberrations on protein profiles and gauge the functional effects of muta-tional profiles across 32 different cancers. We apply our approach to evaluate the (functional) relevance of the abovementioned molecular tumor classifications and
systematically analyze the effects of all major driver mutations on protein profiles across all major cancers. Figure 1 provides an overview of our approach and compares it to traditional tumor classifications.
Methods Genetic data
Two TCGA data types were used: protein expression and somatic mutations. Data of all diseases available without limitation was used. For somatic mutation data, we used data processed with Oncotator [15]. TCGA data was downloaded from Broad Institute [16] via GDAC firehose http download. For pan-organ protein expres-sion analysis, we used TCPA data [17] (https:// www.tcpaportal.org/tcpa/; TCGA-PANCAN16-RBN.csv).
Batch removal
To remove possible TCGA batch effects on protein ex-pressions influencing our analysis, we excluded 21 batches with a total of 393 TCGA cases (details given in Additional file 1: Table S1). To identify problematic batches, we used the R package of mbatch (http:// bioinformatics.mdanderson.org/tcgambatch/). For each histological tumor type, we sequentially removed batches until the value of the Dispersion Separability Criterion (DSC) was below 0.3 and the corresponding pvalue was below 0.05. The batch to remove next was chosen by iteratively removing one of the current batches, calcu-lating the DSC value for a remaining set of batches, and adding the batch again. The batch with the low-est DSC for the remaining batches after its removal was chosen.
Tumor classifications
Tumor classifications proposed by Ciriello et al. [4] and Hoadley et al. [5] were investigated. We also tested a clas-sification we published earlier based on the definition of a nearest mutational neighbor by Heim et al. [18]. The fourth classification we analyzed is based on the genes TP53, TTN, and BRAF. These three genes were chosen after a principal component analysis of mutational profiles showed they identify the coarse cluster structure of the data when mutational profiles are represented as two-dimensional vectors (more details given in Additional file 1, section
Discriminability analysis
To test whether there are differences in protein expression between cases of different classes from the same tumor, we computed the energy distance of the two groups com-posed by those cases. Energy distance measures the homogeneity of protein expression of group A (for ex-ample, skin cancer melanoma BRAF V600E-positive cases) and group B (skin cancer melanoma BRAF V600E-negative cases) separately and compares it to the homogeneity of cases from A to B taken together. A smaller (negative) energy distance indicates the protein expressions of the cases from the two groups are discrim-inable. Let c11;A to ci1;A be the groupg1,A oficases with histological tumor type A assigned to class 1,c21; A toc2j;A
be the groupg2,Aofjcases with histological tumor type A assigned to class 2, and let d(cx,cy) be the
Euclidean distance of two cases in protein space, than the energy distance de1A, 2A of the two groups g1, A and g2, A
is defined as:
de1A;2A¼
Xi−1
k¼1 Xi
l¼kþ1
d c1k;A;c1l;A
þX
j−1
k¼1 Xj
l¼kþ1
d c 2k;A;c2l;A
−2X i
k¼1 Xj
l¼1
d c1k;A;c2l;A
To test whether the distance between two groups is sig-nificant or within random range, we ran Monte Carlo sim-ulations (1 million runs) to determine the p value corresponding to the measured distance. In each run, we
calculated the energy distance of two groups, which were randomly created from the same cases as originally used and having the same sizes iand jas the original groups. The frequency of the two random groups having a lower or equal energy distance (stronger or equal differences in protein expressions) than the groups based on the original genetic classes yields the p value. Benjamini-Hochberg procedure (pvalues given in the text are unadjusted) and
pvalue thresholding (p< 0.05) were used to find the pairs of genetic classes with significantly different protein ex-pressions for each histological tumor type. This results in a list of pairs of groups (a pair of groups are two groups of cases from the same histotype with different genetic clas-ses) with significant differences in protein expressions be-tween the two groups. As a trade-off bebe-tween the reliability of results and investigating as many classes as possible, we compared only groups with five or more cases.
Determine characteristic proteins
For each pair of groups with significant differences in pro-tein expression, we also calculated the contribution of each protein to the total energy distance of the two groups. Therefore, the energy distance of the two groups is calculated as described above, with the modification that the distance of two cases is not given by their Euclid-ean distance in protein space but by the difference in ex-pressions for a specific protein only. Calculated for each protein separately, the contribution of each protein to the distance is known. As a result, we were able to filter for those proteins that have the strongest effect on the dis-criminability of the two different groups. The proteins with the strongest contribution to the difference of the two groups are those with the most negative contribution values. Proteins with a negative contribution value are considered to be characteristic proteins if the absolute value of the contribution of the protein is higher than the highest positive contribution value among all proteins. We chose this dynamic threshold as it can be considered as an estimate for the maximum noise of the contribution signals. Characteristic proteins are then divided into two sets by calculating their mean values among the cases of the two groups. The proteins with higher mean values in group A are considered to have significantly increased ex-pression values in group A cases compared to group B cases and vice versa. We chose this test for characteristic proteins over, for example, theUtest because it puts em-phasis on the proteins with larger differences rather than proteins with smaller yet significant differences between the two groups of cases.
Definition of cross-cancer effects
To address the question of how mutational differences between two classes affect protein expressions in more
than one histotype in the same way, we performed a cross-cancer effect analysis. We therefore searched the list of discriminable group pairs for group pairs with the same classes but different histological tumor types. The result would be two group pairs pA= (g1, A,g2, A) and
pB= (g1,B,g2,B). Associated with each pair of groups are two sets of characteristic proteins. Set sA
1 is the set of
characteristic proteins forpA that are increased for class 1, set sA2 is the set of characteristic proteins for pA that are increased for class 2, setsB
1 is the set of characteristic
proteins forpBthat are increased for class 1, and set sB2
is the set of characteristic proteins for pB that are in-creased for class 2. We then compute the number of inter-secting characteristic proteins by ni¼ jsA
1∩sB1j þ jsA2∩sB2j
and use one-tailed Fisher’s exact test to determine whether the number of intersecting characteristic proteins is sig-nificant relatively to the number of characteristic proteins of both groups and the total number of proteins used (120). The p value for all group and histological tumor type pairs were also false positive corrected with the Benjamini-Hochberg procedure.
Results
Proteomic profiles are more histotype-specific than genomic profiles
The attempts to propose novel molecular tumor classifi-cations are mainly based on the observation that gen-omic profiles show substantial similarities across histological tumor types and are often inconsistent with histology [4, 18]. Because this study aims at evaluating the functional relevance of these molecular classifications based on proteomic profiles, we first studied whether the observed inconsistencies between genomic and histo-logical typing also exist on the level of proteins by re-applying the analysis presented by Heim et al. [18] to corresponding reverse-phase protein array data available through The Cancer Protein Atlas (TCPA) [17].
Our analysis showed that mutational and histological tumor types agreed for only 45% of the 3590 cases, for which both protein and mutational data were available (47% if combining colon and rectal cancer as a single histotype). For protein profiles, the analysis demon-strates a consistency with histotypes in 94% of the cases (95.6% if colon and rectal cancer combined, Fig.2). The only relevant cross-cancer similarities on the protein level exist for colon and rectal cancer (1.6% of all cases) and, moreover, lung squamous and adenocarcinoma (1%), which arise in the same organ.
differentially expressed proteins. We found such rela-tions in 24 out of 76 pair-wise molecular class compar-isons, all of which were histotype-dependent (for details about the method, see Additional file1, section
“The relation between mutational and protein pro-files,”and for results, see Additional file2: Table S2).
Moreover, we tested if the fact that TCGA/TCPA of-fers only a limited panel of less than 200 proteins may introduce a bias when comparing cross-cancer similarities between genomic and proteomic data. Also, evaluating functional groups of genes may show different patterns of genetic profiles. To address these issues, we first re-per-formed our similarity analysis for only the genes with cor-responding proteins in the TCPA/RPPA data. Second, we assigned genes to the c6 gene set (oncogenic signaling) from MSigDB (Broad Institute). These controls showed that apart from minor quantitative differences, the overall pattern of substantial cross-cancer similarities is consistent between both approaches and our original findings shown in Fig. 2 (for details, see Additional file1, section “ Cross-cancer similarities for different gene sets”).
In summary, while substantial genetic cross-cancer similarities exist, our analysis points to a pronounced organ-type specificity of the observed protein profiles. At this point, it is unclear whether the reason for this in-consistency between genetic and protein profiles is the
differential translation of genetic profiles into protein levels in different cancer types, or organ- and tissue-specific pro-tein base levels that are modulated by mutations—or a combination of both.
Histotype specificity of genetic classifications and pan-cancer effects
Based on the findings that global genetic cross-cancer similarities are not reflected in corresponding protein pattern similarities, we evaluated to what extent tumor classifications based on molecular alterations are impact-ing protein profiles. We systematically compared if, and which, genetic classes affect proteins (i.e., which classes are discriminable on the level of protein profiles) for 3 molecular cancer classification approaches [4,5,18] and a computational approach based on reducing genetic complexity for 30 different histological tumor types. Subsequent to the identification of molecular classes with impact on the protein level as an indicator of func-tional relevance within each histotype, we also compared the molecular class discriminability on the protein level across histological tumor types to determine which of the molecular classes found to be functionally relevant in one histotype, are relevant also in another. To this end, the following aspects are addressed for each classification.
First, we provide a descriptive comparison between genetic and histological classifications by evaluating the distribution of genetic classes across the different histo-logical classes.
Secondly, we introduce the classification effectivity score (CES) which indicates to what extent different mu-tational classes can be discriminated by their protein profiles assuming that classifications are more effective and thus clinically relevant if their (genetic) classes are visible also on the protein level. The CES integrates the results of the different subtests (a subtest is the pair-wise comparison of two genetic classes with respect to their protein profiles) into one score to describe the accuracy of the classification with which individual classes can be discriminated by protein profiles (i.e., the percentage of evaluated class vs. class subtests where the protein pro-files were found to be significantly different from each other). The CES can be also evaluated class-wise (only subtests using a specific class are evaluated) to describe to what extent protein profiles of the specific class differ from those of all other classes. In analogy to this, the
histotype-wise CES evaluates all subtests for a specific histotype.
Thirdly, in addition to the global CES, we define the discriminability score sdisfor pairwise class comparisons.
The discriminability score measures to what extent pro-tein profiles of histological tumor type X differ between class A and class B (as sdisthe describes the difference in
protein levels of two classes, the score is more negative the more distinct the profiles of the two sets are). For those subtests, we also identify those proteins for which the profiles deviate most between two classes.
Finally, we analyze the cross-cancer protein profile ef-fects for each classification. A cross-cancer effect is re-ported when two genetic classes can be distinguished from each other in protein profiles in at least two histo-logical tumor types and if protein effect directionality is similar across histotypes.
Overall, the four tested molecular classifications de-fine classes that are associated with distinct protein pro-files in some tumor types. However, protein propro-files are affected similarly across tumor types for only two class
pairs, and for most classes, protein profile discriminability is dependent on tumor type.
In the proposal by Ciriello et al. [4], tumors are classi-fied by the presence of somatic mutations and copy number alterations in cancer-related pathways. Molecu-lar classes are composed of, on average, 2.5 different
histotypes (range 2 to 6), and histotypes are assigned to 7.2 different molecular classes on average (range 2 to 15). For details about histotype and molecular class con-gruence, also see Fig.3.
The global classification effectivity score (CES) is 17%. The highest effectivity score for a specific histotype is
found for breast cancer with 36.6%. The molecular clas-ses, which show the highest classification effectivity in breast cancer, are C11 (66%) and C7 (60%). Yet, both classes are separable from other classes in hardly any other histological type (C11: CES = 11%, C7: CES = 9% over all other histotypes). For histological tumor types other than breast cancer, the mean classification effectiv-ity score is 10%. Highest histotype-specific classification effectivity scores apart from breast cancer are found for colorectal adenocarcinoma (CES = 13%), ovarian cancer (CES = 9%), and endometrial carcinoma (CES = 20%), with CES = 36% for breast cancer being the highest score, followed by endometrial carcinoma with 20% and 10% for other histotypes. Our results indicate that the Ciriello classification is to some extent focused on breast cancer. An overview on class and histotype classification effectivity scores is also given in Fig.4.
The highest molecular class discriminability score is that within breast cancer cases for classes C11 and M1 with a score of sdis=−6.38 (p= 2.1e−3, based on a Monte Carlo
simulation with 1e6 random class assignment runs result-ing in an average discriminability score srand=−3.5e−4).
Comparing the protein expression of the two classes shows that the average expression of Cyclin_B1 is signifi-cantly increased for class C11 cases whereas PR, GATA3, ER-alpha, Bcl-2, and Caveolin-1 expression values are sig-nificantly higher for M1 cases. Interestingly, high Cyclin-B1 and low PR expression indicate a (more aggressive) basal subtype of breast cancer in the PAM50 profile which indicates that the proteomic profiles at least partially cor-relate with gene expression-based subtyping although this cannot be comprehensively tested here due to the small panel of available proteins.
The least pronounced but still significant class dis-criminability is achieved for classes C12 and C5 in breast cancer (sdis=−0.31,p= 4.4e−3; srand=−8.0e−5). Class C12
has significantly increased mean expression/phosphoryl-ation for Syk, p70S6K, HER2_pY1248, EGFR_pY1068, and HER2; class C5 is enriched for higher expression of PR, ER-alpha, GATA3, and Cyclin_D1.
To search for consistent effects of genetic alterations on protein profiles not just within a histological tumor type but across tumor types, we evaluate the overlap of proteins with altered expressions/phosphorylation for all molecular classes that are discriminable in more than one histotype. Pairs of molecular classes that are discriminable in more than one histological tumor type and therefore candidates for such an effect are, in principle, classes C11 and M4 in breast cancer and endometrial carcinoma, classes C11 and M5 in breast cancer and endometrial carcinoma, and classes C3 and M5 in breast cancer and endometrial carcinoma. How-ever, no significant intersection of characteristic pro-teins between breast cancer and endometrial carcinoma
can be found for any pair of classes, and therefore, no cross-cancer effects are present for the Ciriello classifi-cation (complete results are available in the Additional file3).
The classification proposed by Hoadley et al. [5] consists of 13 different classes based on comprehensive proteoge-nomic information. A molecular class comprises, on aver-age, 1.5 different histological types (min 1; max 3). Classes 3, 4, 5, 6, 8, 9, and 10 comprise only of cases of a single histotype. Cases from one histotype are assigned to 1.3 different classes on average (range 1 to 3). Compared to Ciriello et al., the Hoadley proposal has a substantial over-lap with the histological tumor types. In particular, five or more cases were assigned to more than one molecular class only for lung squamous cell carcinoma, breast can-cer, and urothelial bladder carcinoma. Because subtests are conducted for pairs of molecular classes within the same histotype, only five subtests can be performed. Four of those five class pairs show significant differences in pro-tein expression resulting in an overall classification effect-ivity score (CES) of 80% (urothelial bladder carcinoma 66%, breast cancer 100%, and lung squamous cell cancer 100%). The discriminability score is sdis=−4.24 (p= 0.0;
srand= 8.1e−5) in breast cancer for molecular classes 3
and 4. The proteins with significant expression differ-ences responsible for discriminability of classes 3 and 4 are INPP4B, ER-alpha, GATA3, PR, AR, Bcl-2, and Cyclin_B1. Significant differences in protein expres-sion (sdis=−0.58; p= 1.6e−5; srand= 3.5e−5) are also
found for lung squamous cell carcinoma cases assigned to molecular classes 1 and 2. For urothelial bladder carcinoma, classes 1 and 8 (sdis=−1.34;p= 7.0e−5;
srand= 2.6e−5) are discriminable as well as classes 2 and 8
(sdis=−1.41; p= 0.0; srand= 3.2e−5). Because no pairs of
molecular classes are discriminable in more than one histo-logical tumor type, no cross-cancer effects can be found.
Heim et al. [15] compute mutational profile similarity classes across all tumors based on somatic mutations. For example, a breast cancer case with a mutational pro-file that is most similar to an ovarian carcinoma case is assigned the class toOv. On average, cases from one his-totype are assigned to 5.4 different classes (min 1, max 16), and one class consists of cases from 5.1 different histological tumor types. As reported in [18] for each
“to-histotype” class, the majority of assigned cases be-longs to this tumor type (toBRCA consists of 50% breast cancer cases for instance).
cancer (2.5%), low-grade glioma (10%), gastric cancer (7%), and thyroid carcinoma (30%). Of all classes in this classification, toTHCA (the class consisting of cases that have a mutation profile most similar to thy-roid carcinoma) had the highest classification effectiv-ity score of 8%.
For this classification, class discriminability sdisis
high-est between class toLGG (cases that are most similar to low-grade glioma cases by their mutation profile) and class toPRAD for low-grade glioma (LGG) (sdis=−3.26;
p= 0.0; srand=−6.1e−5; characteristic protein profiles
in-creased in toLGG: p70S6K_pT389; inin-creased in ToPRAD: YAP_pS127, HER2_pY1248, HER2, EGFR_pY1068, EGFR_pY1173, Src_pY416, and Cyclin_D1). Also, breast cancer cases which are similar to gastric cancer can be dis-criminated from cases that are similar to thyroid carcin-oma with a discrimination score of sdis=−2.01 (p= 9.1e−5;
srand= 3.0e−4). For breast cancer cases, similar to gastric
cancer, characteristic proteins are ASNS and Cyclin_B1, whereas for cases similar to thyroid carcinoma, charac-teristic proteins with increased expression are Caveolin-1, Collagen_VI, PR, MAPK_pT202_Y204, and ER-alpha. Classes toSTAD and toTHCA can also be separated for gastric cancer with proteins characteristic to class toS-tad being Cyclin_B1, Caspase-7_cleavedD198, and Claud7 whereas toTHCA cases have significantly in-creased expression/phosphorylation of NF-kB-p65_p S536 and Caveolin-1.
A cross-cancer effect is present for the histotypes breast cancer and gastric cancer as classes toSTAD and toTHCA show overlapping characteristic proteins Cyclin_B1 and Caveolin-1 (p= 0.02) for those two his-totypes. No other cross-cancer effects can be found.
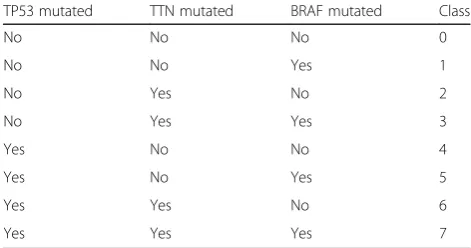
In addition to the three previously published methods, we evaluated a classification which is based on a nonlin-ear principal component analysis of mutational profiles which yielded the genes TP53, TTN, and BRAF as indi-cators of high-level molecular types (Table1). While it is
obvious that these genes are not sufficient to establish a comprehensive molecular classification (particularly with respect to the controversial gene TTN [19–21]), they may be regarded as a very basic molecular typing system. This classification scheme assigns most cases to class 0 (48% of all cases). Classes 2, 4, and 6 (no BRAF muta-tion) are also very well populated from cases of different histological tumor types (13%, 20%, 11%). Overall, a molecular class on average includes cases from 10.75 histotypes (min 0; max 26). Cases of one histotype are assigned to 2.9 different classes on average (min 1; max 6).
The evaluation of protein profiles of the same histo-type assigned to different classes yields an overall classi-fication effectivity score of 16.8% which is almost as high as the score of the Ciriello classification despite its sub-stantially lower complexity. The highest CES is found for adrenocortical carcinoma with 100%, although in this case only discriminable classes 0 and 4 have sufficient cases to be analyzed. Classes 0, 2, 4, and 6 are comprised of breast cancer cases, and their protein profiles are evaluated pairwise resulting in six comparisons. Of those six comparisons, only protein profiles of class 4 and 6 do not differ significantly. Therefore, the second highest classification effectivity score is found for breast cancer with 83.3% (five of six class to class comparisons). The class with the highest classification effectivity score is class 0 (no mutation in TP53, TTB, or BRAF) with 25.4%.
The highest class discriminability score for this classifi-cation is found in discriminating thyroid carcinoma pro-tein profiles for classes 0 and 1 (sdis=−2.07; p= 0.0;
srand=−1.3e−4; characteristic protein profiles: ER-alpha,
PR, GATA3, Bcl-2, and INPP4B increased for class 0— increased for class 4: Cyclin_B1 and ASNS). For breast cancer, differences in protein profiles are found between classes 0 and 6 (sdis=−1.85; p= 0.0; srand= 1.8e−5;
char-acteristic protein profiles increased in class 0: ER-alpha, PR, GATA3, Bcl-2, Caveolin-1, AR, and INPP4B—for class 6: ASNS, Caspase-7_cleavedD198, and Cyclin_B1) and between class 0 and class 4 (sdis=−1.64; p= 0.0;
srand=−7.6e−5; characteristic proteins increased in class
0: ER-alpha, PR, GATA3, Bcl-2, and INPP4B—increased in class 4: Cyclin_B1 and ASNS).
For this classification, a consistent cross-cancer effect is found for classes 2 and 4 in both breast cancer and endometrial carcinoma. Protein profiles of classes 2 and 4 in breast cancer differ significantly for proteins ER-alpha, GATA3, AR, and ER-alpha_pS118 (increased in class 2), and Cyclin_B1 and p53 (increased in class 4). For endometrial carcinoma, protein profiles between class 2 and class 4 differ for ER-alpha, Akt_pS473, Akt_pT308, E-Cadherin, ER-alpha_pS118, Claudin-7, and CD49b (in-creased in class 2), and p53, Cyclin_B1, Cyclin_E1, and
Table 1Genetic complexity reduction-based classification scheme.
The table is a complete illustration of the rules governing which class a case is assigned by the genetic complexity reduction-based classification
TP53 mutated TTN mutated BRAF mutated Class
No No No 0
No No Yes 1
No Yes No 2
No Yes Yes 3
Yes No No 4
Yes No Yes 5
Yes Yes No 6
IGFBP2 (increased in class 4). With an overlap of four char-acteristic proteins (ER-alpha, ER-alpha_pS118, Cyclin_B1, and p53) this constitutes a significant (p= 0.0054) cross-cancer effect.
Actionable genes are related to distinct protein profiles across cancers
While there are attempts to re-classify cancer based on comprehensive molecular profiles as outlined above, these are still largely theoretical considerations. Many so-called basket trials have already begun to evaluate the utility of
single actionable mutations for targeted treatment selec-tion independent of the histological tumor type. However, while some studies show that targeted therapies work in different histological tumor types (Anti-Her2 treatment in breast and gastric cancer, NTRK in various cancers [22]), several recent basket trials have demonstrated that the ef-ficacy of targeted treatments often depends on the histo-logical tumor type [13, 14]. Using the same approach as above, we are systematically evaluating all major action-able somatic mutations and copy number alterations against which drugs are approved for clinical use or which are currently tested in clinical trials with respect to their effects on proteins across cancers. Because we evaluate all actionable genes across all histotypes with sufficient numbers of mutated and wildtype cases, we both validate our approach by showing that estab-lished actionable genes show protein profile effects and identify novel gene-cancer combinations for which druggability is not yet established but for which we ob-serve specific protein patterns. This integration of gen-omic and protegen-omic data allows us to predict genetic aberrations that are promising candidates for successful basket trials particularly if protein profile effects show a consistent directionality across cancers.
In our analysis, we study genes currently listed as ac-tionable in the database OncoKB (http://oncokb.org/ #/actionableGenes) that contains information on 476 genes in 65 histological tumor types and 97 related drugs [23] and that are sufficiently represented in The Cancer Genome Atlas (TCGA/TCPA). OncoKB lists 12 genes with level 1 evidence (FDA-approved), 11 genes with level 2 evidence (standard care), 26 genes in level 3 (clinical evidence), and 20 genes with biological evidence (level 4). We used all actionable genes from evidence levels 1 to 3 with simple somatic mutations (SNPs, insertions, de-letions) and copy number variations with a sufficient num-ber of mutated cases (12 actionable genes). A detailed list of evaluated actionable mutations can be found in Add-itional file4: Table S3. We also analyzed actionable fusions using fusion data from [24], but due to the overall small number of fusions, there were only four tumor type fusion combinations that were analyzed. Results are given in Add-itional file1, section“Actionable Fusions.”
Overall, our analysis showed for all analyzed 12 action-able genes (OncoKB evidence levels 1–3) that the muta-tional status is associated with significant differences in protein profiles in histotypes for which the respective targeted drugs are approved or currently being clinically tested and showed additional mutation-associated pro-tein profiles in 9 histological tumor types. Moreover, our analysis identifies consistent cross-cancer effects for 4 genes (FGFR1, ERRB2, IDH1, KRAS/NRAS) in 11 histo-logical tumor types. Only KRAS/NRAS mutations in
Table 2Comparison between the results of cell line sensitivity
of cell lines with actionable mutations and TCGA protein profile discriminability. For each actionable gene-histotype combination, Y = yes and N = no indicate whether cell lines with actionable mutations show different drug response than cell lines without actionable mutation and if protein profiles of actionable TCGA cases of the specific histotypes have been discriminable from non-actionable ones
Actionable gene Histotype Drug response Differences in TCGA protein profiles
BRAF SKCM* Y Y
ERBB2 BRCA* Y Y
STAD* Y Y
LUAD Y Y
PAAD N N
EGFR LUAD* Y Y
FGFR1 LUSC* Y Y
COAD N N
UCEC N Y
SKCM* Y Y
KRAS LUAD Y Y
UCEC N Y
COAD* N N
STAD N N
LUAD Y Y
MET GBM N Y
SKCM N N
STAD Y N
BRCA N Y
KIRP Y Y
KIRC* N N
OV N Y
LUAD Y Y
PIK3CA BLCA Y N
HNSC N N
STAD N Y
*Histotypes where the gene is clinically established as actionable are marked. Fisher’s exact test shows there is a significant relation between protein discriminability and drug response (p= 0.0484)
colorectal cancer do not result in discriminable protein profiles comparing wild-type and mutated cases, whereas an effect can be observed for thyroid cancer and melan-oma. To provide further evidence for the significance of this observation, we tested if protein profile dis-criminability is more often seen in tumor types where the gene is actionable than in non-actionable tumor types. This showed that the actionability of mutations is highly significantly associated with dis-criminable protein profiles (Fisher’s exact test p< 0.0001).
To evaluate if the protein profile analysis approach may contribute to predicting druggability of oncogenic mutations across cancers, we validated our predictions made for tumors from TCGA with drug response data available for cell lines. Our results demonstrate that in addition to confirming known druggable genes in the available cell line data, protein profile discriminability in between presence or absence of oncogenic mutations is predictive of drug response in cell line data across cancers (p = 0.048, Table 2). For more details, please see Additional file 1 section “Cell line analysis” and Additional file5: Tables S4 and S5.
BRAF mutations are actionable in melanomas (OncoKB level 1). Mutations of BRAF are frequent enough in our data for melanoma (46% cases with
mutation) and thyroid carcinoma (not yet reported by OncoKB, 56% cases with mutation) for further analysis. The actionable mutations create discriminable groups of cases for thyroid carcinoma (sdis=−2.07;p= 0.0; srand=−
1.0e−4) and melanoma (sdis=−0.10; p= 4.7e−3; srand=−
1.1e−4). For thyroid carcinoma, the protein expression of Fibronectin is altered. For melanoma, the levels of MAPK_pT202_Y204, PTEN, and Bcl-2 are decreased, and IGFBP2, E-Cadherin, Akt_pT308, and Akt_pS473 are in-creased. With no significant proteins intersecting between the two tumor types, no cross-cancer effect can be identi-fied for BRAF.
CDK4 amplification is actionable for differentiated sar-comas (OncoKB level 2). CDK4 status testing reveals discriminable protein profiles for sarcomas and also for histotypes renal clear cell carcinoma, lung adenocarcinoma, breast cancer, ovarian carcinoma, thyroid carcinoma, low-grade glioma, adrenocortical carcinoma, and lung squamous cell carcinoma (all not yet reported by OncoKB). For sarcoma, 36% of the cases show CDK4 amplification and protein profiles are discriminable (sdis=−0.34;p= 0.0;
srand=−6.0e−5) with E-Cadherin, Caveolin-1, Akt_pS473,
Cyclin_B1, ER-alpha, Akt_pT308, YAP_pS127, S6_pS240_ S244, and Cyclin_E1 decreased and HSP70, Syk, Lck, Src_pY416, and Src_pY527 increased in CDK4 amplified cases. There is no cross similarity for CDK4.
EGFR mutations are actionable in non-small cell lung cancer (OncoKB level 1). Lung adenocarcinoma is the only histological tumor type with enough cases having an action-able mutation to perform our analysis. Lung adenocarcin-oma (LUAD) cases with actionable mutation of EGFR are discriminable from those without by protein profile (sdis=−0.44; p= 5.9e−4; srand= 3.1e−5). EGFR_pY1068
levels are increased for cases with the respective muta-tions, and Claudin-7 levels are decreased among those cases.
ERBB2/HER2 amplification is actionable in breast cancer and gastric cancer (level 1 evidence, FDA-approved). We find that ERBB2/HER amplification status significantly in-fluences protein expression profiles not only in breast and gastric cancer but also in lung squamous cell carcinoma and lung adenocarcinoma (in conformity with OncoKB level 4 data) and other 11 not yet reported histological types (endometrial carcinoma, renal papillary cell carcinoma, tes-ticular germ cell tumors, urothelial bladder carcinoma, renal clear cell carcinoma, colon carcinoma, ovarian carcin-oma, thymcarcin-oma, thyroid carcincarcin-oma, cervical carcincarcin-oma, head and neck squamous cell carcinoma)—see also Fig.5
or for details Additional file3. For ten histological tumor types (melanoma, esophageal carcinoma, glioblastoma, mesothelioma, cholangiocarcinoma, rectal adenocarcin-oma, sarcadenocarcin-oma, pancreatic adenocarcinadenocarcin-oma, uterine carci-nosarcoma, low-grade glioma), no influence on available protein expression profiles is found. The discriminability score sdisfor Her2-amplified breast cancers is sdis=−0.43
(p= 0.0). The mean random discriminability score (mean discriminability score for one million random class assign-ments) is srand=−6.2e−5. We identify characteristic
pro-teins for ERBB2 amplification: HER2_pY1248, HER2, ACC1, and EGFR_pY1068 (increased levels in amplified cases) and Bcl-2 and PR (decreased levels—Fig. 6 illus-trates in details characteristic proteins for ERBB2, FGFR1, IDH1, and KRAS-NRAS). For gastric cancer, actionable cases are discriminable from non-amplified cases (sdis
=−0.18; p= 6.0e−6; srand=−5.4e−5). The amplified
cases show a decrease of Caspase-7_cleavedD198 and STAT5-alpha expression levels and an increase of HER2, ACC1, ACC_pS79, HER2_pY1248, and Cyclin_E1 expression levels. For ten pairs of histological tumor types, a similar change in protein expression —a cross-cancer effect— is found. Two histological tumor types in which ERBB2 amplification has a similar impact on proteins are breast (BRCA) and gastric (STAD) cancers (p= 2.3e−3). HER2_pY1248, HER2, and ACC1 have sig-nificantly higher mean levels in ERBB2-amplified cases in both histotypes. Other pairs of similarly influenced histo-logical tumor types are lung adenocarcinoma and lung squamous cell carcinoma (p= 5.9e−6; proteins: Caveolin1, p70S6K, ACC_pS79, ACC1, Rb_pS807_S811) and breast cancer and ovarian carcinoma (p= 9.0e−6; proteins:
HER2_pY1248, HER2, ACC1, EGFR_pY1068). For lung adenocarcinoma, cell line drug response data analysis shows sensitivity for cell lines with actionable mutation. This fact correlates to the cross-cancer effect of lung adenocarcinoma to breast cancer and gastric cancer, for which ERBB2 is actionable.
For FGFR1 amplification, clinical evidence (OncoKB level 3) exists on its actionability in lung squamous cell carcinomas. Our analysis shows that besides lung squa-mous cell carcinoma, protein expression of amplified cases is discriminable from non-amplified cases in renal clear cell carcinoma, testicular germ cell tumors, lung adenocarcinoma, endometrial carcinoma, breast cancer, and thymoma (all currently not reported by OncoKB). For lung squamous cell carcinoma, the protein profiles of the amplified cases have significant differences from those without amplification (sdis=−0.08; p= 4.1e−4;
srand= 1.4e−5). Beta-Catenin, 53BP1, and HER2 are
de-creased in amplified cases whereas 4E-BP1 expression values are increased. A cross-cancer effect is found be-tween breast cancer and lung adenocarcinoma with HER2, HER2_pY1248, and EGFR_pY1068 levels decrease and 4E-BP1 levels increase associated with FGFR1 amplifi-cation for both histological tumor types.
Certain FGFR3 mutations are actionable in bladder cancer (OncoKB level 3). Targetable FGFR3 mutations are only frequent enough in urothelial and bladder car-cinoma for our analysis. The protein profiles of cases with at least one of these mutations are discriminable from the profiles of those without (sdis=−0.76;p= 2.7e−3;
srand=−1.3e−5). E-Cadherin, beta-Catenin, HER2, Ku80,
PTEN, IRS1, and 53BP1 are increased among cases having one or more specific FGF3 mutation.
IDH1 mutations are actionable in acute myeloid leukemia, cholangiocarcinoma, and glioma (OncoKB level 3). Specific IDH1 mutations lead to discriminable protein profiles for low-grade glioma (sdis=−0.47; p= 0.0;
srand=−3.1e−6) and glioblastoma (sdis=−1.59;p= 5.0e−4;
srand=−1.0e−5). For low-grade glioma cases with an
action-able mutation, protein profiles of EGFR_pY1068, HER2_ pY1248, HER2, IGFBP2, EGFR_pY1173, and STAT5-alpha are decreased. For glioblastoma IGFBP2, EGFR_pY1068, HER2_pY1248, Caveolin-1, Akt_pT308, Fibronectin, Col-lagen_VI, and EGFR_pY1173 are decreased in the group of mutated cases. Therefore, IGFBP2, EGFR_pY1068, HER2_ pY1248, and EGFR_pY1173 are affected in the same way by IDH1 mutations in low-grade glioma and glioblastoma, and we report a cross-cancer effect for those groups.
with decreased E-Cadherin and Fibronectin expression in wildtype cases and increased c-Kit, STAT5-alpha, and Syk expression levels. The results for KIT presented above are those for mutations typically treated with Ima-tinib; we also tested mutations treated with other KIT-inhibitory drugs yielding similar results.
KRAS/NRAS mutations are therapeutically relevant for melanomas, colorectal cancer, and thyroid cancer (OncoKB level 3). Specific KRAS/NRAS mutations are correlated with differences in protein profiles for melanomas and thyroid cancer and also for testicular germ cell tumors, endometrial carcinoma, and lung adenocarcinoma (in conformity with OncoKB level 4 data). No discrimin-ability of protein profiles can be found for colon carcin-oma (sdis=−5.3e−3;p= 0.43; srand=−6.2e−3) and rectum
adenocarcinoma (sdis= + 0.16; p= 0.59; srand= 0.027).
KRAS/NRAS mutations in colorectal adenomas are the only occurrence where we cannot find discriminable pro-tein profiles between cases that would be treated and those which would not. For melanoma (sdis=−0.16;
p= 1.0e−3; and= 5.2e−6) E-Cadherin, Caveolin-1, and
c-Kit expression levels are decreased for mutated cases, and MAPK_pT202_Y204 is increased. For thy-roid carcinoma (sdis=−1.53; p= 0.0; srand=−3.0e−4),
the level of Fibronectin is decreased in mutated cases. For lung adenocarcinoma and endometrial car-cinoma, we observed a cross-cancer effect for KRAS/ NRAS-mutated cases as ATM levels are decreased, and MAPK_pT202_Y204, Claudin-7, S6_pS235_S236, and MEK1_pS217_S221 are increased in both histo-logical tumor types consistently.
MDM2 amplification is actionable in liposarcoma (OncoKB level 3). Besides sarcoma, the protein profiles of cases with MDM2 amplification are discriminable from those with normal copy numbers for renal clear cell car-cinoma, lung adenocarcar-cinoma, thyroid carcar-cinoma, breast cancer, ovarian carcinoma, and low-grade glioma (all cur-rently not reported by OncoKB). Protein levels of sarcoma cases with MDM2 amplifications are discriminable from those without, with a dissimilarity score of sdis=−0.41 (p
= 0.0; srand=−8.9e−5). Amplified cases show decreased
levels of E-Cadherin, Akt_pS473, Akt_pT308, ER-alpha, Caveolin-1, S6_pS240_S244, S6_pS235_S236, and Cyclin_B1 and increased levels of HSP70, Syk, and Lck. No consistent cross-cancer effect is found.
MET amplification is actionable in non-small cell lung cancers and renal cell carcinoma (OncoKB level 2). In addition to these histotypes, we found 11 other histo-logical tumor types (renal clear cell carcinoma, low-grade glioma, renal papillary cell carcinoma, colon carcinoma, thyroid carcinoma, thymoma, sarcoma, lung oma, testicular germ cell tumors, prostate adenocarcin-oma, glioblastadenocarcin-oma, breast and ovarian carcinoma) where MET amplification is associated with a significant change
in protein expression. For lung adenocarcinoma, the dis-criminability score is sdis=−0.067 (p= 1.5e−3; srand= 2.0e
−5). Proteins that are characteristic of MET amplification status are cyclin_E1, ASNS, cyclin_B1, ACC1, Fibronectin, and ACC_pS79 (increased levels), and c-Kit, Caveolin-1, and Claudin-7 (decreased levels). MET amplification is present in renal clear cell carcinoma cases, and protein profiles of amplified and non-amplified cases can be dis-criminated (sdis=−0.18; p= 0.0; srand=−2.0e−5;
Src_pY527, Bcl-2, beta-Catenin, PTEN, MAPK_pT202 _Y204 are decreased in amplified cases and ACC1, Cyclin_B1, ASNS, ACC_pS79, and Transglutaminase are increased). We did not observe any similar effect of MET amplification on protein expression in other histological tumor types.
PIK3CA activating mutations are actionable for breast cancer (OncoKB evidence level 3). Besides breast cancer, we find an impact on protein profiles for gastric cancer and endometrial carcinoma. OncoKB level 4 data lists all available histological tumor types as possibly actionable for PIK3CA activating mutations. Yet no protein level effect is found for cervical carcinoma, head and neck squamous cell carcinoma, lung adenocarcinoma, urothe-lial bladder carcinoma, esophageal carcinoma, low-grade glioma, lung squamous cell carcinoma, and uterine carci-nosarcoma. Breast cancer cases with PIK3CA-activating mutations are discriminable from those without (sdis=−
0.52; p= 0.0; srand= 6.2e−6) with specific proteins
(in-creased levels) PR, ER-alpha, MAPK_pT202_Y204, Fibro-nectin, AR, and GATA3 in mutated cases and Cyclin_B1, Cyclin_E1, ASNS, and HER2 being decreased. As there is no significant overlap of altered proteins between breast cancer, gastric cancer, and endometrial carcinoma, no cross-cancer effect was found.
Discussion
therapy targeting a specific mutation strongly varies, which is likely due to the modulatory influence of the usually high mutational complexity in tumors.
Because proteins carry out most genetically defined cellular functions, our computational analysis relates genetic alterations and histology with protein profiles to estimate their functional effects and offer a way of evaluating molecular tumor classifications and action-able genes across cancers. To this end, we measured how classes from the four studied molecular classifi-cations are discriminable on the level of protein ex-pression and phosphorylation based on a panel of 120 cancer-associated proteins available through The Can-cer Proteome Atlas. The results showed only a partial histotype-independence, which is indicated by overall low classification effectivity scores for those classifica-tion that rely only on mutaclassifica-tional profiles (Ciriello CES = 17.5%, Heim CES = 2%, genetic complexity reduction-based classification CES = 16.8%). In con-trast to this, the classification by Hoadley et al. which combines genomic and proteomic information shows CES of 80% indicating that proteins have a substantial influence. Our results also show that even though a number of molecular classes of these four molecular classifications are reflected by the protein profiles, the characteristic proteins of the different classes are not identical. This indicates that identical genetic alter-ations are not translated into protein profiles in the same way in different histotypes. The only exception was one cross-cancer effect found in the classification by Heim et al. where the protein profiles between classes “toSTAD” and “toTHCA” showed same direc-tional changes in breast cancer and gastric cancer (of note, more cross-cancer effects were found for the ac-tionable gene analysis, see below).
These observations are largely consistent with the re-sults of the actionable gene analysis which showed spe-cific protein signatures for 12 actionable genes in the corresponding cancer types from the OncoKB database. In addition to showing that our analysis identifies protein-level effects for known actionable genes and cor-responding cancer types, our approach also identified protein-level alterations indicative of potential novel ac-tionable gene—cancer combinations that are so far un-known according to OncoKB including level 4 evidence (biological information). This includes ERBB2/HER2 amplification in endometrial carcinoma, renal papillary carcinoma, testicular germ cell tumors, urothelial carcin-oma, renal clear cell carcincarcin-oma, colon carcincarcin-oma, ovar-ian carcinoma, thymoma, thyroid carcinoma, cervical carcinoma, and head and neck squamous cell carcinoma. For MET amplification, our approach predicts effects for renal clear cell carcinoma, low-grade glioma, renal pa-pillary carcinoma, colon carcinoma, thyroid carcinoma,
thymoma, sarcoma, lung adenocarcinoma, testicular germ cell tumors, prostate adenocarcinoma, glioblastoma, breast cancer, and ovarian carcinoma; for FGFR1 amplification: renal clear cell carcinoma, testicular germ cell tumors, lung adenocarcinoma, endometrial carcinoma, breast cancer, thymoma; MDM2 amplification renal clear cell carcinoma, lung adenocarcinoma, thyroid carcinoma, breast cancer, ovarian carcinoma, and low-grade glioma; BRAF V600: thyroid carcinoma; CDK4 amplification: renal clear cell carcinoma, lung adenocarcinoma, breast cancer, ovarian carcinoma, thyroid carcinoma, low-grade glioma, adreno-cortical carcinoma, and lung squamous cell carcinoma.
Among the predicted genes, the most promising can-didates for cross-cancer therapies are ERBB2/Her2, FGFR1, IDH1, and KRAS because our analysis finds consistent protein profile changes across histotypes (ERBB2/Her2 among others breast cancer – gastric cancer, FGFR1: breast cancer – lung adenocarcinoma, IDH1: low-grade glioma – glioblastoma and KRAS: lung adenocarcinoma – endometrial carcinoma) for these genes. The fact that our approach also identifies the well-known trans-cancer efficacy of ERBB2/Her2 inhibition in breast and gastric cancer [7, 8] supports the potential clinical value of our predictions.
Interestingly, actionable genes with copy number alter-ations showed effects on protein expression for more histotypes than those with simple somatic mutations (10.2 affected tumor types on average for amplifications vs. 2.14 for simple somatic mutations).
To validate our findings, we used drug response data from cell line repositories. The results show that our computational proteomic analysis using data from The Cancer Genome Atlas correctly predicts drug response in an independent data set of cell lines.
A study also linking proteomic and mutation data by Akbani et al. [26] clusters cases based on proteomic data, but clustering is evaluated by survival time. Akbani et al. also report relations between differences in frequencies of certain mutations between clusters and the differences in survival statistics for these clusters. In contrast to this study, our approach relies on mutational data as clustering or classification input and evaluates classification based on proteomic data and is therefore also capable of evaluat-ing the effect of a sevaluat-ingle mutation directly.
hormone signaling, and proliferation deduced from a comprehensive mass spectrometry-based dataset [26]. While this may still lead to a slightly too pessimistic view on the global molecular tumor classifications, it is there-fore unclear to what extent the inclusion of more proteins would add to functionally and clinically relevant informa-tion. With respect to the actionable gene analysis, our ap-proach may underestimate the number of potentially druggable genes, but the fact that it readily identifies many well-established actionable gene, cancer combinations, such as, for instance, HER2 amplification in breast and gastric cancer [7,8], indicates its validity.
The approach we present facilitates analyses of the rela-tionship between genomic and proteomic profiles in the context of different histological tumor types. It is import-ant to note that the ability of our study to reveal cross-cancer effects is limited by the molecular classifica-tions we evaluate here. With the advance of our under-standing of cancer, improved molecular classifications and more detailed definitions of the actionability of genes will become available. The method presented in this study is independent of those changes and therefore can be also applied to evaluate future definitions. Future molecular tumor typing concepts are likely to also include additional aspects such as intratumoral heterogeneity which will be-come increasingly important for the interpretation of mo-lecular profiles [27,28].
Conclusions
While the current tumor classification system is still largely based on histology, it will be increasingly complemented by molecular profiling to meet the requirements of precision medicine. Our analysis shows that tumor typing solely based on mutational profiling is incomplete. By evaluating protein-level effects of genetic aberrations, our approach fa-cilitates the identification of functionally relevant mutations and may therefore contribute to predicting actionable mu-tations across cancers and to guide basket trial design.
Additional files
Additional file 1:Results for actionable fusions, details on genetic complexity reduction algorithm, method description of evaluating relations between mutational and protein profiles, method description of cell line analysis, an analysis on cross-cancer similarities for different gene sets, a figure for characteristic proteins on all actionable genes and information on batches not used due to possible batch effects. (PDF 1511 kb)
Additional file 2:Ciriello pathway analysis results. A table containing detailed results of the Ciriello pathway analysis. (XLSX 19 kb)
Additional file 3:Complete listing of results. Detailed listing of the results of discriminability and cross cancer effect analysis. (CSV 210 kb)
Additional file 4:Actionable genes. A table with details on all actionable genes analyzed. (XLSX 14 kb)
Additional file 5:Cell lines analysis results. Two tables containing results on cell line data analysis. (XLSX 14 kb)
Acknowledgments
Denise Treue and Michael Bockmayr commented on earlier versions of the manuscript. Moreover, we thank Ms. Bláthnaid Ryan for the proofreading.
Funding
Funding was provided by the Einstein Foundation Berlin and the Charité Universitätsmedizin Berlin. This research was partly supported by the Institute for Information & Communications Technology Promotion and funded by the Korean Government (MSIT) (No. 2017-0-00451, No. 2017-0-01779) and by BMBF (BZML, BBDC). We acknowledge support from the German Research Foundation (DFG) and the Open Access Publication Fund of Charité– Uni-versitätsmedizin Berlin.
Availability of data and materials
All data used in this study is publicly available. TCGA data via BROAD:
https://doi.org/10.7908/C11G0KM9. Cell line data via PharmacoGx [29]
https://doi.org/10.5281/zenodo.1038045.
Authors’contributions
FK and DH designed the computational experiments, analyzed the data, and wrote the manuscript. DH implemented the computational experiments. PH and DH performed the statistical analysis. KM and GM contributed analysis tools and the genetic complexity reduction classification and helped to iteratively improve the manuscript. All authors read and approved the final manuscript.
Ethics approval and consent to participate Not applicable.
Consent for publication Not applicable.
Competing interests
The authors declare that they have no competing interests.
Publisher’s Note
Springer Nature remains neutral with regard to jurisdictional claims in published maps and institutional affiliations.
Author details
1
Institute of Pathology, Charité - Universitätsmedizin Berlin, corporate member of Freie Universität Berlin, Humboldt-Universität zu Berlin and Berlin Institute of Health, Berlin, Germany.2Department of Electrical Engineering and Computer Science, Technische Universität Berlin, Marchstr. 23, 10587 Berlin, Germany.3Department of Computer Science, Machine Learning Group, Berlin Institute of Technology, Marchstr. 23, 10587 Berlin, Germany. 4
Bernstein Focus Neurotechnology, Berlin, Germany.5Max Planck Institute for Informatics, Stuhlsatzenhausweg, 66123 Saarbrücken, Germany.6Department of Brain and Cognitive Engineering, Korea University, Anam-dong, Seongbuk-gu, Seoul 02841, South Korea.7German Cancer Consortium (DKTK), Partner Site Berlin, Berlin, Germany.8German Cancer Research Center (DKFZ), Heidelberg, Germany.
Received: 5 January 2018 Accepted: 16 October 2018
References
1. Flaherty KT, Puzanov I, Kim KB, Ribas A, McArthur GA, Sosman JA, et al. Inhibition of mutated, activated BRAF in metastatic melanoma. N Engl J Med. 2010;363:809–19.https://doi.org/10.1056/NEJMoa1002011. 2. Kris MG, Natale RB, Herbst RS, Lynch TJ, JR PD, Belani CP, et al. Efficacy of
gefitinib, an inhibitor of the epidermal growth factor receptor tyrosine kinase, in symptomatic patients with non-small cell lung cancer: a randomized trial. JAMA. 2003;290:2149–58.https://doi.org/10.1001/jama.290.16.2149.
4. Ciriello G, Miller ML, Aksoy BA, Senbabaoglu Y, Schultz N, Sander C. Emerging landscape of oncogenic signatures across human cancers. Nat Genet. 2013;45:1127–33.https://doi.org/10.1038/ng.2762.
5. Hoadley KA, Yau C, Wolf DM, Cherniack AD, Tamborero D, Ng S, et al. Multiplatform analysis of 12 cancer types reveals molecular classification within and across tissues of origin. Cell. 2014;158:929–44.https://doi.org/10. 1016/j.cell.2014.06.049.
6. Weinstein JN, Collisson EA, Mills GB, Shaw KR, Ozenberger BA, Ellrott K, et al. The Cancer Genome Atlas pan-cancer analysis project. Nat Genet. 2013;45: 1113–20.https://doi.org/10.1038/ng.2764.
7. Bang Y-J, van Cutsem E, Feyereislova A, Chung HC, Shen L, Sawaki A, et al. Trastuzumab in combination with chemotherapy versus chemotherapy alone for treatment of HER2-positive advanced gastric or gastro-oesophageal junction cancer (ToGA): a phase 3, open-label, randomised controlled trial. Lancet. 2010;376:687–97. https://doi.org/10.1016/S0140-6736(10)61121-X.
8. Rugo HS, Barve A, Waller CF, Hernandez-Bronchud M, Herson J, Yuan J, et al. Effect of a proposed trastuzumab biosimilar compared with trastuzumab on overall response rate in patients with ERBB2 (HER2)-positive metastatic breast cancer: a randomized clinical trial. JAMA. 2017;317:37–47.https://doi. org/10.1001/jama.2016.18305.
9. Carvajal RD, Lawrence DP, Weber JS, Gajewski TF, Gonzalez R, Lutzky J, et al. Phase II study of nilotinib in melanoma harboring KIT alterations following progression to prior KIT inhibition. Clin Cancer Res. 2015;21:2289–96.https:// doi.org/10.1158/1078-0432.CCR-14-1630.
10. Macleod AC, Klug LR, Patterson J, Griffith DJ, Beadling C, Town A, Heinrich MC. Combination therapy for KIT-mutant mast cells: targeting constitutive NFAT and KIT activity. Mol Cancer Ther. 2014;13:2840–51.https://doi.org/10. 1158/1535-7163.MCT-13-0830.
11. Souglakos J, Philips J, Wang R, Marwah S, Silver M, Tzardi M, et al. Prognostic and predictive value of common mutations for treatment response and survival in patients with metastatic colorectal cancer. Br J Cancer. 2009;101:465–72.https://doi.org/10.1038/sj.bjc.6605164. 12. Yokota T, Ura T, Shibata N, Takahari D, Shitara K, Nomura M, et al. BRAF
mutation is a powerful prognostic factor in advanced and recurrent colorectal cancer. Br J Cancer. 2011;104:856–62.https://doi.org/10.1038/bjc.2011.19. 13. Hyman DM, Puzanov I, Subbiah V, Faris JE, Chau I, Blay J-Y, et al.
Vemurafenib in multiple nonmelanoma cancers with BRAF V600 mutations. N Engl J Med. 2015;373:726–36.https://doi.org/10.1056/NEJMoa1502309. 14. Lopez-Chavez A, Thomas A, Rajan A, Raffeld M, Morrow B, Kelly R, et al.
Molecular profiling and targeted therapy for advanced thoracic
malignancies: a biomarker-derived, multiarm, multihistology phase II basket trial. J Clin Oncol. 2015;33:1000–7.https://doi.org/10.1200/JCO.2014.58.2007. 15. Ramos AH, Lichtenstein L, Gupta M, Lawrence MS, Pugh TJ, Saksena G, et al.
Oncotator: cancer variant annotation tool. Hum Mutat. 2015;36:E2423–9.
https://doi.org/10.1002/humu.22771.
16. Broad Institute TCGA Genome Data Analysis Center. Analysis-ready standardized TCGA data from Broad GDAC Firehose stddata__2015_11_01 run: Broad Institute of MIT and Harvard; 2016.
17. Li J, Lu Y, Akbani R, Ju Z, Roebuck PL, Liu W, et al. TCPA: a resource for cancer functional proteomics data. Nat Meth. 2013;10:1046–7. 18. Heim D, Budczies J, Stenzinger A, Treue D, Hufnagl P, Denkert C, et al.
Cancer beyond organ and tissue specificity: next-generation-sequencing gene mutation data reveal complex genetic similarities across major cancers. Int J Cancer. 2014;135:2362–9.https://doi.org/10.1002/ijc.28882. 19. Kim N, Hong Y, Kwon D, Yoon S. Somatic mutaome profile in human
cancer tissues. Genomics Inform. 2013;11:239–44.https://doi.org/10.5808/GI. 2013.11.4.239.
20. Kim Y-A, Madan S, Przytycka TM. WeSME: uncovering mutual exclusivity of cancer drivers and beyond. Bioinformatics. 2017;33:814–21.https://doi.org/ 10.1093/bioinformatics/btw242.
21. Lawrence MS, Stojanov P, Polak P, Kryukov GV, Cibulskis K, Sivachenko A, et al. Mutational heterogeneity in cancer and the search for new cancer genes. Nature. 2013;499:214–8.https://doi.org/10.1038/nature12213.
22. Ricciuti B, Brambilla M, Metro G, Baglivo S, Matocci R, Pirro M, Chiari R. Targeting NTRK fusion in non-small cell lung cancer: rationale and clinical evidence. Med Oncol. 2017;34:105.https://doi.org/10.1007/s12032-017-0967-5. 23. Chakravarty D, Gao J, Phillips S, Kundra R, Zhang H, Wang J, et al. OncoKB: a
precision oncology knowledge base. JCO Precis Oncol. 2017:1–16.https:// doi.org/10.1200/PO.17.00011.
24. Hu X, Wang Q, Tang M, Barthel F, Amin S, Yoshihara K, et al. TumorFusions: an integrative resource for cancer-associated transcript fusions. Nucleic Acids Res. 2018;46:D1144–9.https://doi.org/10.1093/nar/gkx1018. 25. Yuan Y, van Allen EM, Omberg L, Wagle N, Amin-Mansour A, Sokolov A, et
al. Assessing the clinical utility of cancer genomic and proteomic data across tumor types. Nat Biotechnol. 2014;32:644–52.https://doi.org/10.1038/ nbt.2940.
26. Akbani R, Ng PK, Werner HM, Shahmoradgoli M, Zhang F, Ju Z, et al. A pan-cancer proteomic perspective on The Cancer Genome Atlas. Nat Commun. 2014;5:3887.https://doi.org/10.1038/ncomms4887.
27. Morris LG, Riaz N, Desrichard A, Senbabaoglu Y, Hakimi AA, Makarov V, et al. Pan-cancer analysis of intratumor heterogeneity as a prognostic
determinant of survival. Oncotarget. 2016;7:10051–63.https://doi.org/10. 18632/oncotarget.7067.
28. Andor N, Graham TA, Jansen M, Xia LC, Aktipis CA, Petritsch C, et al. Pan-cancer analysis of the extent and consequences of intratumor heterogeneity. Nat Med. 2016;22:105–13.https://doi.org/10.1038/nm.3984. 29. Smirnov P, Safikhani Z, El-Hachem N, Wang D, She A, Olsen C, et al. PharmacoGx: